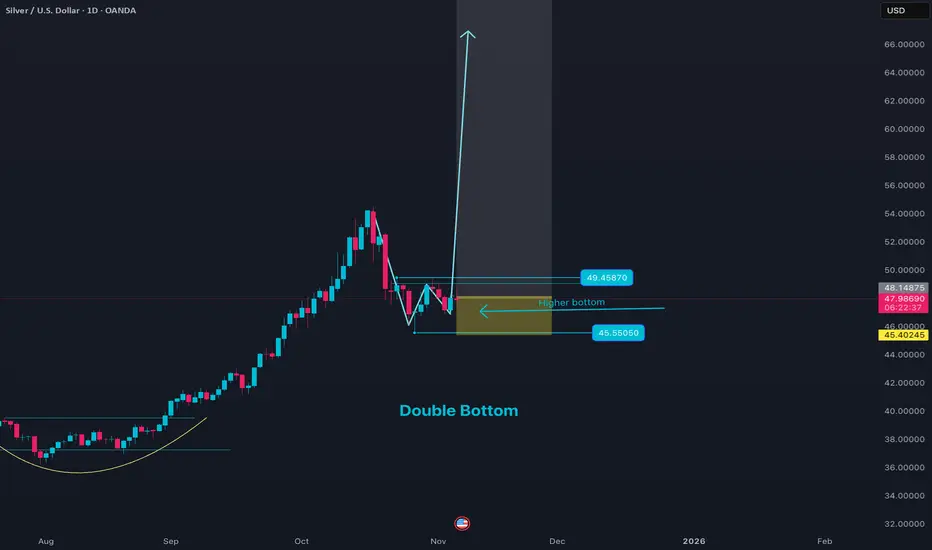
Silver Price Action set up with double bottomThe current price analysis for XAGUSD (Silver against US Dollar) in early November 2025 reveals a mixed but cautious outlook. Silver prices are moving within a corrective phase after exiting a bullish channel, trading approximately in the $47.50 range. Technical indicators such as moving averages cu
XAGUSD ANALYSISAs per my analysis we can see correction in both silver and gold and we can see a new last high in upcoming months as per this market can form now abc pattern as a corrective pattern it will takes time. as per my view high is formed of 3rd wave and now silver is in correction.
you can post your com

silver spot viewsilver spot cmp 62.70 is in 3 wave
4 wave 47.00, 43.00, 39.00, 35.00 take support continue 5 wave
65.00 above monthly close or sustain strongly is sl
view is only study purpose only , we are not recommend any trade or investment

Silver on a lifescale time frameOverall, I see that a rise in Silver prices is possible
The extent and speed of rise is getting higher
I feel a big rally is due in 2024 and after!

Silver Spot Viewsilver sell price 67.25 to 67.66
Target 65.00,63.25
Sl 68.70 Above sustain
view is for study purpose only, we are not recommend any trade or investment

XAGUSD (Silver): Impulsive Structure IntactXAGUSD (Silver): Impulsive Structure Intact, Consolidation Before Continuation
Silver continues to trade within a well-defined rising channel on the 3H timeframe, maintaining a clear bullish structure from the November lows. Despite short-term fluctuations, the broader price action remains orderly

Xagusd SilverXagusd chart Analysis .........24/12/2025
The XAGUSD XABCD harmonic target is at the 73.4 level. You can book your profits here, and if a reversal candle forms, you can also consider taking a short position with a stop-loss above the high of that candle.
ENJOY !
Note: This is my analysis for educ

Silver this week booked 19000 points profit will fall now 205k-Parameter Data
Asset Name ⬜ Silver MCX (March 2026 Futures)
Price Movement 🟥 Consolidation/Profit Booking (₹2,05,290 / -1.03%)
Current Trade 🟨 BUY ON DIPS (Zone: ₹2,01,500 - ₹2,03,500)
SMC Structure 🟩 Bullish Order Flow (Breakout from consolidation base)
Trap/Liquidity Zones 🟥 Bullish Trap: Above ₹2

todays trade plan in silver .sell trade got active on rejection of golden reversal , targeting liquidity sweep . from liquidity sweep will take buy trade once price faces rejection . for target of liquidity sweep top .
this is the trade plan for today .

Silver Forecast - Elliott Wave AnalysisThis Rally continue possible up to Around $80 without break trendline support or Invalidation level so go long ...

See all ideas
Summarizing what the indicators are suggesting.
Oscillators
Neutral
SellBuy
Strong sellStrong buy
Strong sellSellNeutralBuyStrong buy
Oscillators
Neutral
SellBuy
Strong sellStrong buy
Strong sellSellNeutralBuyStrong buy
Summary
Neutral
SellBuy
Strong sellStrong buy
Strong sellSellNeutralBuyStrong buy
Summary
Neutral
SellBuy
Strong sellStrong buy
Strong sellSellNeutralBuyStrong buy
Summary
Neutral
SellBuy
Strong sellStrong buy
Strong sellSellNeutralBuyStrong buy
Moving Averages
Neutral
SellBuy
Strong sellStrong buy
Strong sellSellNeutralBuyStrong buy
Moving Averages
Neutral
SellBuy
Strong sellStrong buy
Strong sellSellNeutralBuyStrong buy
Displays a symbol's price movements over previous years to identify recurring trends.