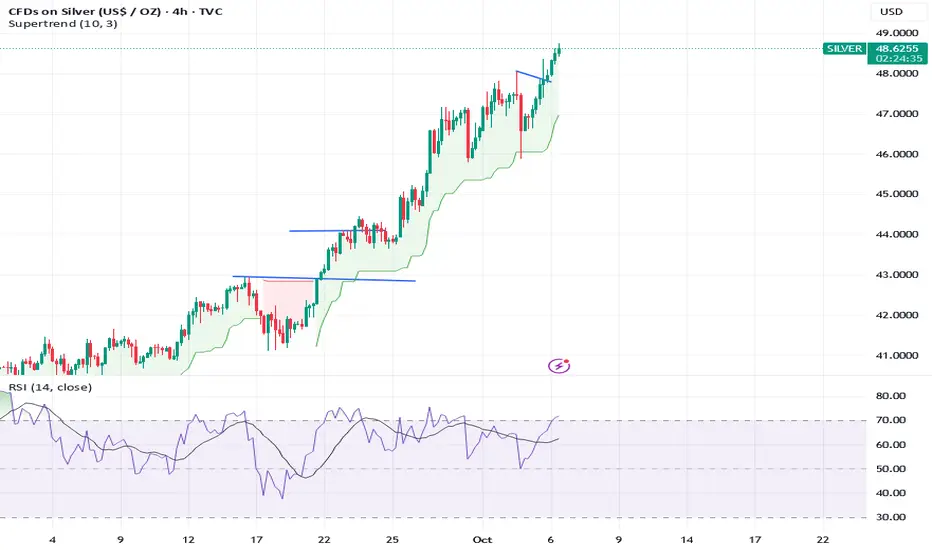
Silver breakout above ATH. What to expect next?Chart Analysis:
Silver gave a breakout above its all time high and major psychological level of 50$. All the technicals are very strong in the short run.
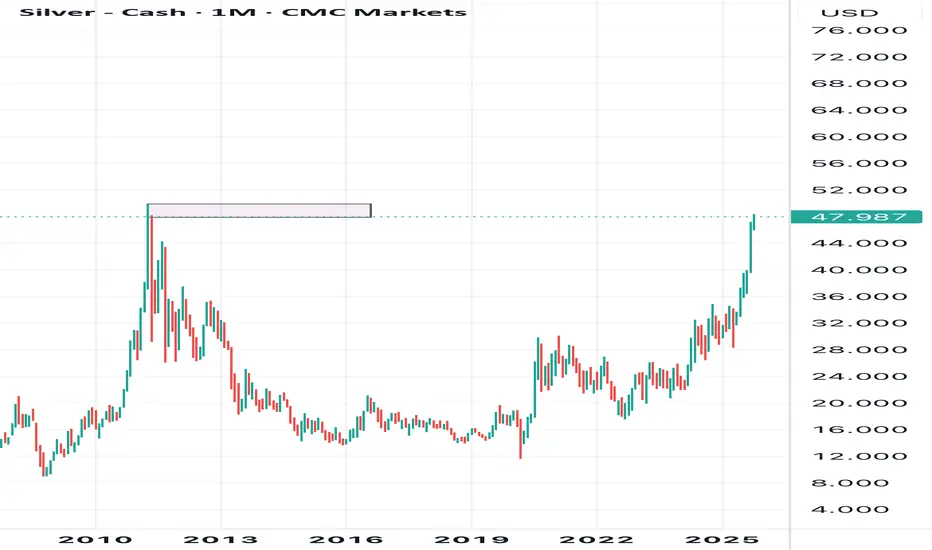
Looking at the monthly chart it looks like C recovery and breakout above major resistance without the H formation making the C&H pattern incompl
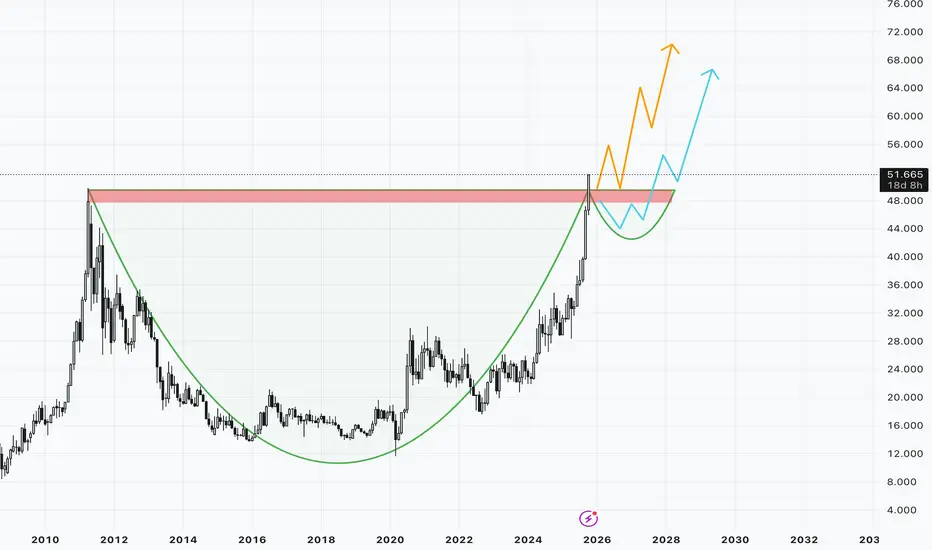
Silver as said on weekend 54$ for this week if comes then book Silver this week target 54 $ near now if comes then book profit, silver still buy in dip
How My Harmonic pattern projection Indicator work is explained below :
Recent High or Low :
D-0% is our recent low or high
Profit booking zone ( Early / Risky entry) : D 13.2% -D 16.1 % is
range if bre

Silver upmove will continue buy on dip 54$ target Silver buy on dip uptrend will continue 54 $ next upside target,
Silver updated levels given on chart
How My Harmonic pattern projection Indicator work is explained below :
Recent High or Low :
D-0% is our recent low or high
Profit booking zone ( Early / Risky entry) : D 13.2% -D 16.1 % i
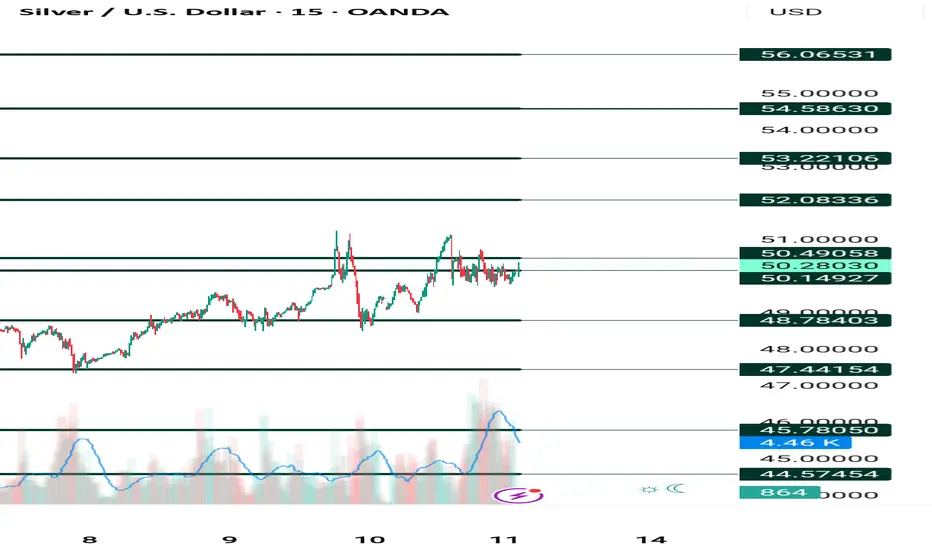
Silver 51.20 target hit then profit booking 54 $ come next week Silver as said earlier 51.20 $ target hit .
Silver buy on dip 54$ we will see on next week
How My Harmonic pattern projection Indicator work is explained below :
Recent High or Low :
D-0% is our recent low or high
Profit booking zone ( Early / Risky entry) : D 13.2% -D 16.1 % is
range if

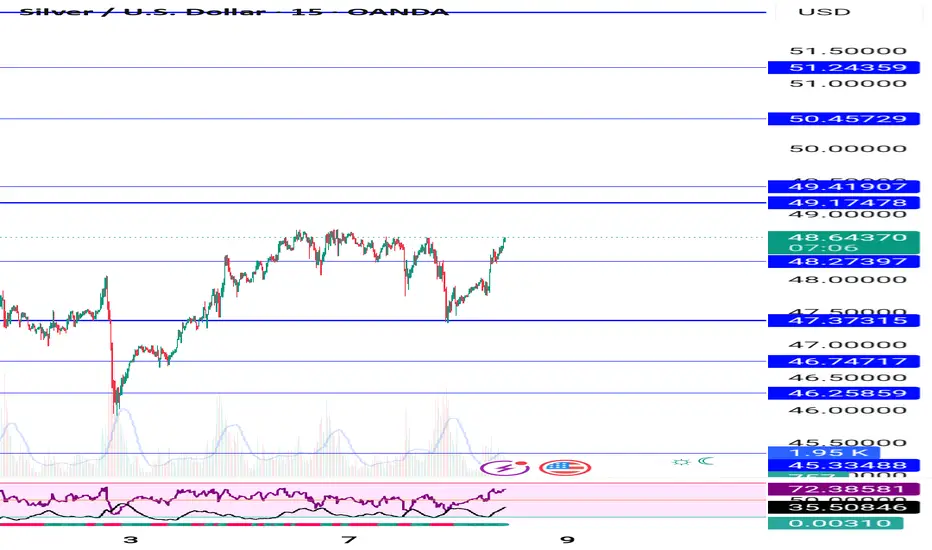
Silver holding buy from 48.80, 50.50 then 51.20 target Silver holding buy trade from 48.80 upside target 50.40 and 51.20 , levels given on chart
How My Harmonic pattern projection Indicator work is explained below :
Recent High or Low :
D-0% is our recent low or high
Profit booking zone ( Early / Risky entry) : D 13.2% -D 16.1 % is
range if br

Silver upmove will continue 49.80 to 49.90 next target hold buy Silver buying recommended now up 5000-6000 points next upside target 49.80 to 49.90
How My Harmonic pattern projection Indicator work is explained below :
Recent High or Low :
D-0% is our recent low or high
Profit booking zone ( Early / Risky entry) : D 13.2% -D 16.1 % is
range if break
Red Alert for Buyers as XAGUSD Nears $49 – Correction AheadSilver price (XAGUSD) faces strong resistance near $49. Neal Bhai Reports warns a “Red Alert for Buyers.” Check latest silver analysis with buy/sell targets, stop loss, and key support levels for traders.
Silver prices have shown a sharp rally, reaching near the $49–$50 zone — a strong resistance a

SILVER AT THE $50 "WIDOW MAKER ZONE": IS A CRASH IMMINENT?Silver has hit the wall. It's not just resistance—it's the exact price range $48.00–$50.00 that triggered the 70%+ market massacres of 1980 and 2011.
3 Reasons Why a Correction Is Locked In
The risk of a violent reversal is extreme. This zone is a perfect storm of selling pressure:
* The $50 Trap
silver spot or mcx lvl update at higher lvlsilver spot looks beast mode due to higher high pastern with short correction and made huge gap with daily or 4th hrs chart.
technical lvl--support 47--46.80$ indicate as per chart only blw some down correction expect 46.20--46--45.90$ where hurdle 48.45--48.50$ if sustain abv than next touch 48.80
Demat Account Secrets in Trading —Every Traders Should KnowIntroduction
A Demat account is the digital locker for your shares and securities — the backbone of equity investing and trading in modern markets. But beyond opening an account and watching prices, there are plenty of practical, operational, and strategic “secrets” that experienced traders and lon
See all ideas
Summarizing what the indicators are suggesting.
Oscillators
Neutral
SellBuy
Strong sellStrong buy
Strong sellSellNeutralBuyStrong buy
Oscillators
Neutral
SellBuy
Strong sellStrong buy
Strong sellSellNeutralBuyStrong buy
Summary
Neutral
SellBuy
Strong sellStrong buy
Strong sellSellNeutralBuyStrong buy
Summary
Neutral
SellBuy
Strong sellStrong buy
Strong sellSellNeutralBuyStrong buy
Summary
Neutral
SellBuy
Strong sellStrong buy
Strong sellSellNeutralBuyStrong buy
Moving Averages
Neutral
SellBuy
Strong sellStrong buy
Strong sellSellNeutralBuyStrong buy
Moving Averages
Neutral
SellBuy
Strong sellStrong buy
Strong sellSellNeutralBuyStrong buy
Displays a symbol's price movements over previous years to identify recurring trends.