silver soon topssilver could top soon , it had made the top and fallen , so could the history repeat ? we could see gold and silver prices falling soon because nothing could go so up forever
Trade ideas

Silver holding buy trade from 46.70 , upside target 48.40Silver holding buy trade from 46.70 upside target 48.40 then we will see new ATH
How My Harmonic pattern projection Indicator work is explained below :
Recent High or Low :
D-0% is our recent low or high
Profit booking zone ( Early / Risky entry) : D 12.3% -D 16.1 % is
range if break them profit booking start on uptrend or downtrend but only profit booking, trend not changed
SL reversal zone (Safe entry ) : SL 23.1% and SL 25.5% is reversal zone if break then trend reverse and we can take reverse trade
Target : T1, T2, T3, T4 and .
Are our Target zone
Any Upside or downside level will activate only if break 1st level then 2nd will be active if break 2nd then 3rd will be active.
Total we have 7 important level which are support and resistance area
Until , 16% not break uptrend will continue if break then profit booking will start.
If break 25% then fresh downtrend will start then T1, T2,T3 will activate
1,3,5,10,15,20 minutes are short term levels.
30 minutes 60 minutes , 2 hours,3 hours, ... 1 day and 1 week chart positional and long term levels

Silver Spot Price Technical Analysis [28-09-2025] Buy on DipsAny Correction Buy on Dips - Silver Spot (XAG/USD) daily chart from (dated 2025.09.27), here’s a technical analysis: The chart indicates a continuation of an uptrend, with the price recently breaking out above a key resistance level around 45.013. This breakout is supported by a strong upward move, suggesting bullish momentum.

Silver Bullish Breakout on Monthly & Weekly CharPattern Formed: Symmetrical Triangle (Long-Term Consolidation)
Breakout Type: Bullish Breakout on Monthly & Weekly Chart
Volume Confirmation: Strength in breakout with price expansion
Measured Move Target: ~$44 (based on triangle height projection)
Immediate Resistance Zone: $44.11 (Historical supply zone)
Support Levels Post-Breakout:
Immediate Support: $34.78
Strong Support: $33.28

Silver comex updated levels silver ready for New ATHSilver comex updated levels given on chart,silver will try to break previous ATH and make fresh ATH buy on dip near support
How My Harmonic pattern projection Indicator work is explained below :
Recent High or Low :
D-0% is our recent low or high
Profit booking zone ( Early / Risky entry) : D 12.3% -D 16.1 % is
range if break them profit booking start on uptrend or downtrend but only profit booking, trend not changed
SL reversal zone (Safe entry ) : SL 23.1% and SL 25.5% is reversal zone if break then trend reverse and we can take reverse trade
Target : T1, T2, T3, T4 and .
Are our Target zone
Any Upside or downside level will activate only if break 1st level then 2nd will be active if break 2nd then 3rd will be active.
Total we have 7 important level which are support and resistance area
Until , 16% not break uptrend will continue if break then profit booking will start.
If break 25% then fresh downtrend will start then T1, T2,T3 will activate
1,3,5,10,15,20 minutes are short term levels.
30 minutes 60 minutes , 2 hours,3 hours, ... 1 day and 1 week chart positional and long term levels

SILVERHello & welcome to this analysis
Silver in daily time frame appears to be in its 5th wave.
The larger impulse could end anywhere between $43.50 - 45 / INR 125000 - 129000. From there I expect it to retrace to $38 /INR 116000
MCX Silver will depend largely on $:INR movement.
Silver remains a strong commodity for medium to long term and all dips should be used to add.
All the best

Silver’s Bullish Cycle: Zones to Buy, Levels to Aim ! Silver is running one of its strongest bullish phases in recent years, having broken through key ranges and now holding around the mid-43s with momentum still intact. The structure shows that 42.7 is the immediate support staying above this level keeps short-term bulls in control. Once pressure mounts, the wider zone between 40 and 41 is where the market is Trend to react with macro catalysts, whether it’s Fed commentary, shifts in the dollar, or changes in yields. This zone is less about weakness and more about price discovery, often a place where institutional demand re-enters. A deeper correction cannot be ruled out, and the 37 region stands out as the medium-term load-up zone, where longer-term players will rebuild exposure. On the upside, silver has scope to stretch toward 44.9, and once momentum extends further, the 47.8 handle comes into play. From a macro perspective, the trend is supported by a weakening dollar, softer yields, and the Fed’s slow shift toward deeper rate cuts, while silver’s dual role both as a safe-haven and an industrial metal tied to the energy transition gives the rally added structural strength. Taken together, the bias remains firmly higher, with dips into support zones offering opportunities rather than threats. Trade safe!
Key Levels to Watch:
Immediate support: 42.7
Reaction zone: 40.0 – 41.0
Medium-term load up zone: 37.0
Upside targets: 44.9 and 47.8

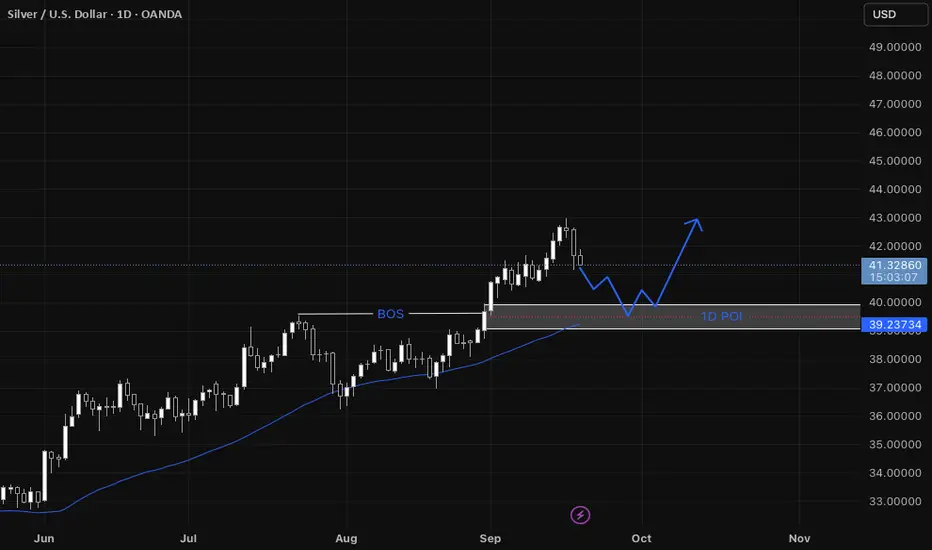
XAGUSD Step-by-step entry plan for XAGUSD
1. We have our Daily Point of Interest (POI)
- On the daily a zone that contains:
* a fair value gap (FVG),
* a break of structure (BOS) that previously acted as resistance and is now expected to act as support, and
* support from the 44 SMA.
2. Wait for price to return to the Daily POI
- Only consider the setup if price actually comes back into that daily POI zone.
3. Switch to the 1-hour timeframe to refine the entry
- Look for a shift in structure on the 1-hour (i.e., evidence that momentum is shifting bullish: BOS to the upside, higher highs/higher lows).
4. Confirm a 1-hour fair value gap forms
- The structure shift on 1-hour should create a 1-hour FVG (a short intraday imbalance).
5. Wait for the 1-hour FVG to be filled
- Let price fill that 1-hour FVG (price moves into/through the gap).
6. Look for a bullish confirmation on the filled 1-hour FVG
- After the fill, require a clear bullish formation on 1-hour (examples: bullish engulfing candle, strong demand candle, a higher-low + rejection wick).
7. Enter on the 1-hour bullish confirmation
- Enter when price breaks the confirmation level (e.g., breaks above the local 1-hour high formed by the bullish setup) or on a confirmed bullish candle close per your entry rules.
Bullish Silver is looking very very hot
Its bullish Flag making if silver sustain this week above 42.25$, then it comes to 49 superfast maybe next in two days only
There's no recommendations from my side
Only for learning purpose

XAGUSD / SILVER / SI ANALYSIS 01-SEP-2025LTP: 40.44x
Supports: 38.07/37.41/35.21
As long as the above supports levels hold, we will see 40.89-41.77-43.16 first.
Further Targets:
45.07
46.73-47.55-48.91 (Ultimate target)
52.50-53.37-55.95 (Extension)

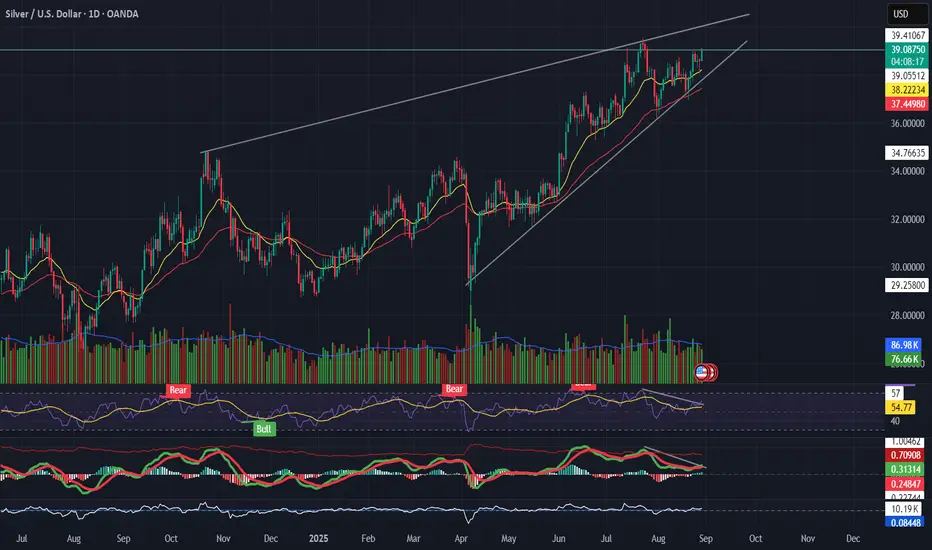
Silver (XAGUSD) Trading in a rising wedge Pattern📌 Silver (XAGUSD)
Trading in a rising wedge, pressing resistance near $39.
RSI divergence → price making higher highs, momentum not following.
MACD rolling over while price climbs = possible bearish divergence.
Support to watch: $37.3 → wedge breakdown if breached.
👉 Bullish only if $39.5 breaks with strong volume; otherwise, risk of pullback.
---
🎯 Takeaway
Silver = extended wedge → caution, momentum weak.
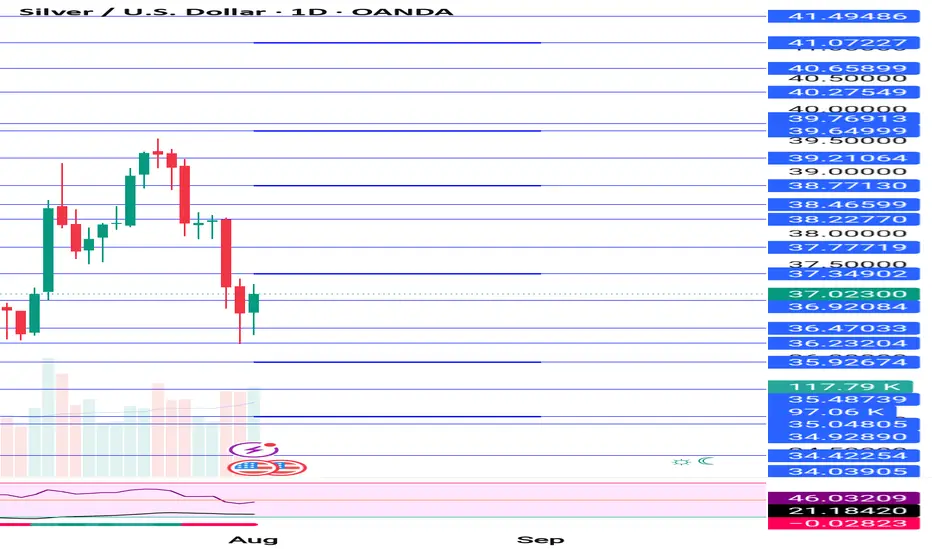
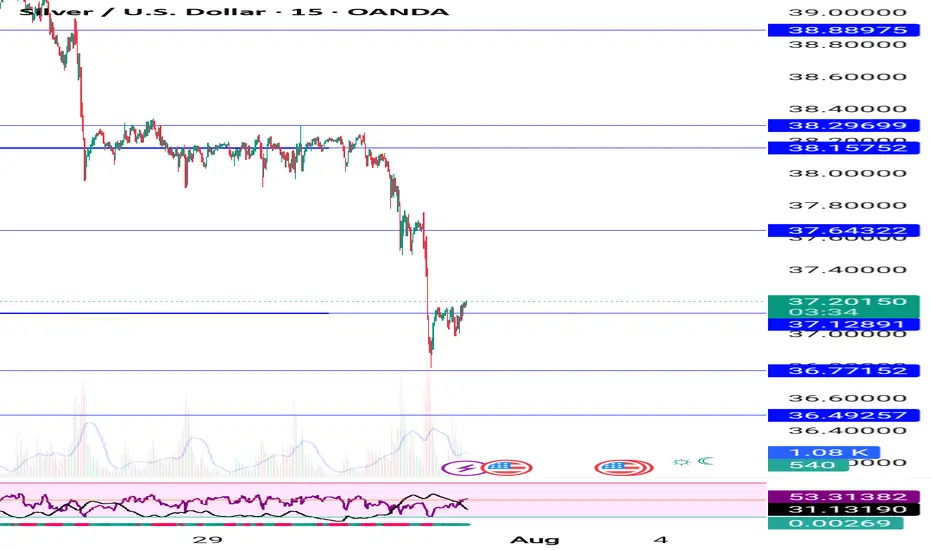
silver can be broughtsilver is at liquidity seweep level, silver can be brought sl below zone 3 mins candle closing target upper liquidity sweep


XAGUSD / SILVER / SI Analysis 12-Aug-2025: BULL or BEAR?LTP: 37.81x
Supports: 36.19/33.64
Base supports: 32.07/28.30
Resistance: 39.55
As long as the above supports hold, we can see 40.42 first.
Further 43.10/44.37, extension 47.47, 50.18

Silver sell given near 38.45 , better to book profit Silver sell recommended near 38.45 $ better to book profit,
Updated levels given on chart take trades intraday
Rate cuts geopolitical issues, tarrif will act both side move play safe , risk is high at current market scenario

Silver if break 37.55 then sell on on rise downside big target Silver if break 37.55 then sell on rise again downside target big mentioned on chart.
Avoid buying at current price

XAGUUSD/SILVER/SI ANALYSIS 05-AUG-2025: BULL or BEAR?LTP 37.41
Supports: 36.16/35.21
Resistance: 37.55/38.37/39.55
As long as 36.16/35.21 holds support, we can see new highs.
Targets: 39.55, 40.89, 41.77, 43.16, Extension 45.07

Last week silver sell given , next week updated levels on chart Last week sell on rise recommended on silver we get maximum profit .
For next week updated levels given on chart silver still negative compared to gold sell on rise again and book profit near previous week low
XAG USD SELL POSSIBILITY
As of July 30, 2025, the spot price of gold (XAU/USD) is approximately $3,330 per troy ounce, showing a marginal change from the previous day and a year-to-date increase of about 36%. For silver (XAG/USD), the spot price is around $38.16 per troy ounce, down slightly for the day but up about 31% compared to the same time last year. Both metals remain in long-term uptrends, with short-term movements reflecting consolidation phases after strong runs earlier in the year.

Silver holding sell trade from 37.85 , downside target 36.80,Silver holding sell trade from 37.85 , downside target mentioned on chart,
Continuesly recommended sell aftrr break 38.85 $
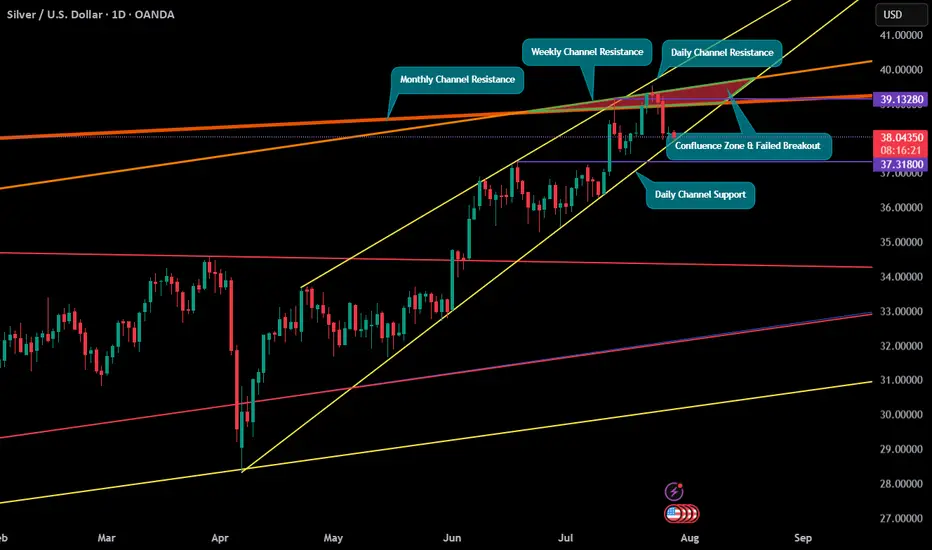
Silver at Multiple Confluence ResistanceSilver came up to a confluence of three Channel Resistances on all major timeframes i.e. Monthly, Weekly & Daily. Near term support currently is only the Daily Channel Support line & the last breakout attempt on D1 has failed to a certain extent. Should big volatility be expected? A break of such strong resistance may signal strong bullish momentum but can the support hold under such conditions.
Silver sell trade was active below 38.80 , downside target 37.95Silver sell on rise in short term levels mentioned on chart if break 38.55 and sustain upside then upmove possible ,

Breakout in silver ??Silver $38.3
Breakout - the precious metal has broken out after 45 long years. It made an attempt in 2011 too but failed. Will it breakout decisively this time around ??
Elliott - according to Elliott wave count this is the 3rd wave and is generally the strongest of the three impulse waves. On the weekly chart on the right the precious metal is all set to make new highs to $41 a good 10% from here. This will finish the 5wave and a correction will set in , which will bring it back to the current zone. A new set of 5 waves will again begin form the $38 zone and will be a stronger move.
Pattern - definitely looks like a cup and handle breakout and is bullish. But am not a fan of these patterns.
Cycle- 45 years is the half harmonic of the 90year cycle. hence to me this breakout will be very significant.
Conclusion - I will be able to give a tgt once the three of three is over. And that has not even started. So to me it continues to be a buy now and on dips.
