silver soon topssilver could top soon , it had made the top and fallen , so could the history repeat ? we could see gold and silver prices falling soon because nothing could go so up forever
SILVER trade ideas

Silver Spot Price Technical Analysis [28-09-2025] Buy on DipsAny Correction Buy on Dips - Silver Spot (XAG/USD) daily chart from (dated 2025.09.27), here’s a technical analysis: The chart indicates a continuation of an uptrend, with the price recently breaking out above a key resistance level around 45.013. This breakout is supported by a strong upward move, suggesting bullish momentum.

SILVER AT THE $50 "WIDOW MAKER ZONE": IS A CRASH IMMINENT?Silver has hit the wall. It's not just resistance—it's the exact price range $48.00–$50.00 that triggered the 70%+ market massacres of 1980 and 2011.
3 Reasons Why a Correction Is Locked In
The risk of a violent reversal is extreme. This zone is a perfect storm of selling pressure:
* The $50 Trap: It's a massive Technical Trap. Long-term sellers trapped from the 2011 peak are all waiting here to dump their bags and take profit.
* Psychological Trauma: Historical Precedent is terrifying. The memory of two prior crashes at this level creates panic-selling pressure that will compound any dip.
* Market Exhaustion: Retail Over-Exuberance is flashing red. Heavy positioning means the easy money is gone, and there's no fuel left to break the ceiling.
The Twist: Not a Total Bust (Yet)
While a crash is likely, a full 1980s-style wipeout is less certain. Why? Industrial Demand. Silver is fundamentally stronger now, backed by massive, non-negotiable demand from the Green Energy Transition (solar, EVs). This structural deficit offers a floor that past bubbles lacked.
The Bottom Line
The $48–$50 area is the "Widowmaker Zone." Expect carnage.
* The Line: If Silver fails to decisively close above $50.00, brace for a brutal correction—likely a fast drop back to the $35.00 range.
* Your Move: MAXIMUM CAUTION. Short-term profits must be protected. History doesn't just rhyme; at this price, it often repeats itself.
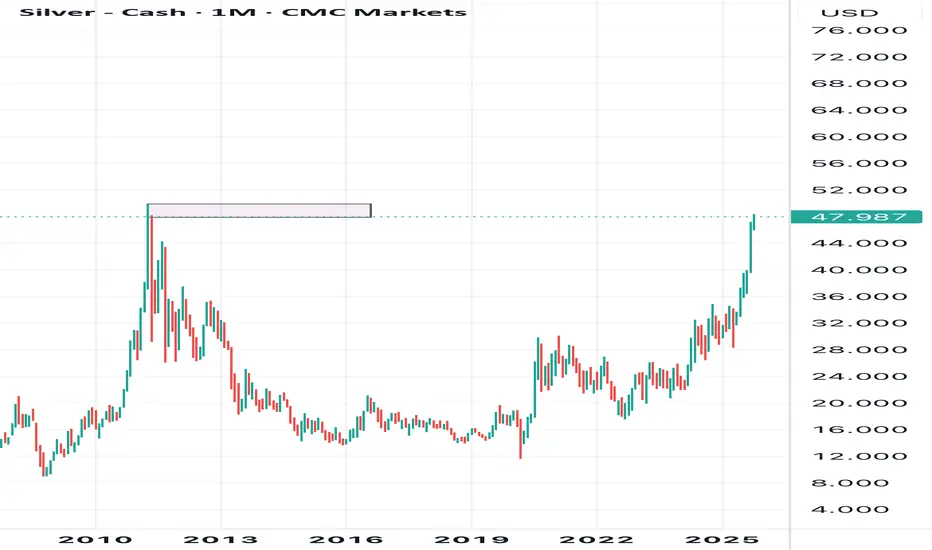
Silver at a crucial historical levelSilver reached the USD 48250+ level. It reached this level in 1980 and 2011. Both times it has experienced a sharp reversal.
According to the long-term Elliott wave, I believe it is the end of the 3rd impulsive wave.
Note: Not a buy/sell recommendation. For educational and paper trading purposes only.

Silver at a major resistanceSilver has reached a major resistance level. A breakout above this will see more rally. It will be very interesting to see what happens from here. Big Macro development if a breakout happens. The metal will continue to shine if it breaks out, otherwise it is a top and correction will follow.

Silver holding buy trade from 47.20 today yesterday also buySilver holding buy from 47.20 yesterday also bought at 46.30 and booked at 47.10
How My Harmonic pattern projection Indicator work is explained below :
Recent High or Low :
D-0% is our recent low or high
Profit booking zone ( Early / Risky entry) : D 12.3% -D 16.1 % is
range if break them profit booking start on uptrend or downtrend but only profit booking, trend not changed
SL reversal zone (Safe entry ) : SL 23.1% and SL 25.5% is reversal zone if break then trend reverse and we can take reverse trade
Target : T1, T2, T3, T4 and .
Are our Target zone
Any Upside or downside level will activate only if break 1st level then 2nd will be active if break 2nd then 3rd will be active.
Total we have 7 important level which are support and resistance area
Until , 16% not break uptrend will continue if break then profit booking will start.
If break 25% then fresh downtrend will start then T1, T2,T3 will activate
1,3,5,10,15,20 minutes are short term levels.
30 minutes 60 minutes , 2 hours,3 hours, ... 1 day and 1 week chart positional and long term levels

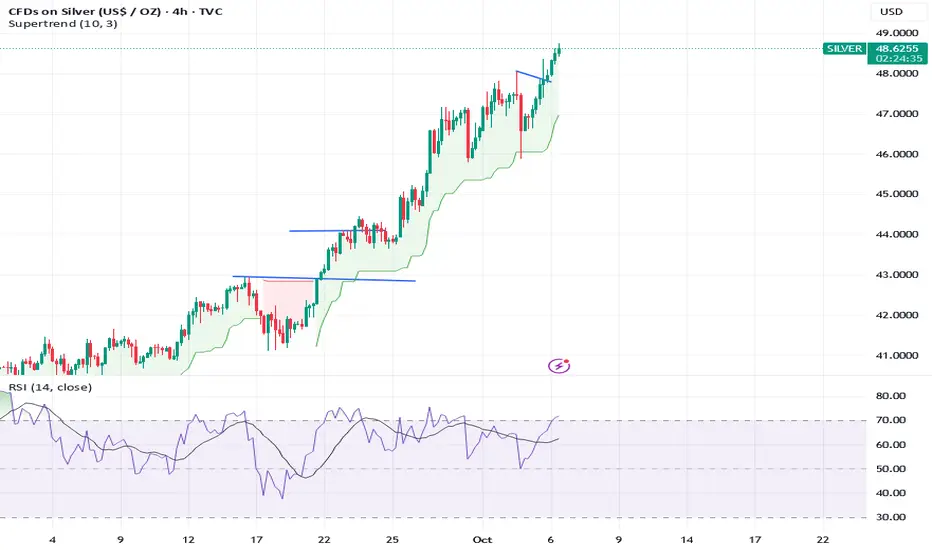
silver spot or mcx lvl update at higher lvlsilver spot looks beast mode due to higher high pastern with short correction and made huge gap with daily or 4th hrs chart.
technical lvl--support 47--46.80$ indicate as per chart only blw some down correction expect 46.20--46--45.90$ where hurdle 48.45--48.50$ if sustain abv than next touch 48.80--49--or last 49.80$++ may be touch over all looks boom mode only.
mcx silver--- till hold abv 146300 no worry for bulls soon 148--149++ ultimate 152k possible or if sustain abv 152 or close 2days than u will see 158--162 soon no if and but. yes be care full at higher lvl profit booking may be come but eyes on lvl .
usa shutdown boosting safe heaven demand
Silver’s Bullish Cycle: Zones to Buy, Levels to Aim ! Silver is running one of its strongest bullish phases in recent years, having broken through key ranges and now holding around the mid-43s with momentum still intact. The structure shows that 42.7 is the immediate support staying above this level keeps short-term bulls in control. Once pressure mounts, the wider zone between 40 and 41 is where the market is Trend to react with macro catalysts, whether it’s Fed commentary, shifts in the dollar, or changes in yields. This zone is less about weakness and more about price discovery, often a place where institutional demand re-enters. A deeper correction cannot be ruled out, and the 37 region stands out as the medium-term load-up zone, where longer-term players will rebuild exposure. On the upside, silver has scope to stretch toward 44.9, and once momentum extends further, the 47.8 handle comes into play. From a macro perspective, the trend is supported by a weakening dollar, softer yields, and the Fed’s slow shift toward deeper rate cuts, while silver’s dual role both as a safe-haven and an industrial metal tied to the energy transition gives the rally added structural strength. Taken together, the bias remains firmly higher, with dips into support zones offering opportunities rather than threats. Trade safe!
Key Levels to Watch:
Immediate support: 42.7
Reaction zone: 40.0 – 41.0
Medium-term load up zone: 37.0
Upside targets: 44.9 and 47.8

SILVERHello & welcome to this analysis
Silver in daily time frame appears to be in its 5th wave.
The larger impulse could end anywhere between $43.50 - 45 / INR 125000 - 129000. From there I expect it to retrace to $38 /INR 116000
MCX Silver will depend largely on $:INR movement.
Silver remains a strong commodity for medium to long term and all dips should be used to add.
All the best

Red Alert for Buyers as XAGUSD Nears $49 – Correction AheadSilver price (XAGUSD) faces strong resistance near $49. Neal Bhai Reports warns a “Red Alert for Buyers.” Check latest silver analysis with buy/sell targets, stop loss, and key support levels for traders.
Silver prices have shown a sharp rally, reaching near the $49–$50 zone — a strong resistance area. According to the chart, buyers should stay cautious now as the metal looks overextended. A short-term correction may hit the market soon.
The technical setup suggests that profit booking could start around current levels, pushing silver towards $44 or even $42 in the coming sessions.

Silver holding buy trade from 46.70 , upside target 48.40Silver holding buy trade from 46.70 upside target 48.40 then we will see new ATH
How My Harmonic pattern projection Indicator work is explained below :
Recent High or Low :
D-0% is our recent low or high
Profit booking zone ( Early / Risky entry) : D 12.3% -D 16.1 % is
range if break them profit booking start on uptrend or downtrend but only profit booking, trend not changed
SL reversal zone (Safe entry ) : SL 23.1% and SL 25.5% is reversal zone if break then trend reverse and we can take reverse trade
Target : T1, T2, T3, T4 and .
Are our Target zone
Any Upside or downside level will activate only if break 1st level then 2nd will be active if break 2nd then 3rd will be active.
Total we have 7 important level which are support and resistance area
Until , 16% not break uptrend will continue if break then profit booking will start.
If break 25% then fresh downtrend will start then T1, T2,T3 will activate
1,3,5,10,15,20 minutes are short term levels.
30 minutes 60 minutes , 2 hours,3 hours, ... 1 day and 1 week chart positional and long term levels

Silver Bullish Breakout on Monthly & Weekly CharPattern Formed: Symmetrical Triangle (Long-Term Consolidation)
Breakout Type: Bullish Breakout on Monthly & Weekly Chart
Volume Confirmation: Strength in breakout with price expansion
Measured Move Target: ~$44 (based on triangle height projection)
Immediate Resistance Zone: $44.11 (Historical supply zone)
Support Levels Post-Breakout:
Immediate Support: $34.78
Strong Support: $33.28

Silver comex updated levels silver ready for New ATHSilver comex updated levels given on chart,silver will try to break previous ATH and make fresh ATH buy on dip near support
How My Harmonic pattern projection Indicator work is explained below :
Recent High or Low :
D-0% is our recent low or high
Profit booking zone ( Early / Risky entry) : D 12.3% -D 16.1 % is
range if break them profit booking start on uptrend or downtrend but only profit booking, trend not changed
SL reversal zone (Safe entry ) : SL 23.1% and SL 25.5% is reversal zone if break then trend reverse and we can take reverse trade
Target : T1, T2, T3, T4 and .
Are our Target zone
Any Upside or downside level will activate only if break 1st level then 2nd will be active if break 2nd then 3rd will be active.
Total we have 7 important level which are support and resistance area
Until , 16% not break uptrend will continue if break then profit booking will start.
If break 25% then fresh downtrend will start then T1, T2,T3 will activate
1,3,5,10,15,20 minutes are short term levels.
30 minutes 60 minutes , 2 hours,3 hours, ... 1 day and 1 week chart positional and long term levels

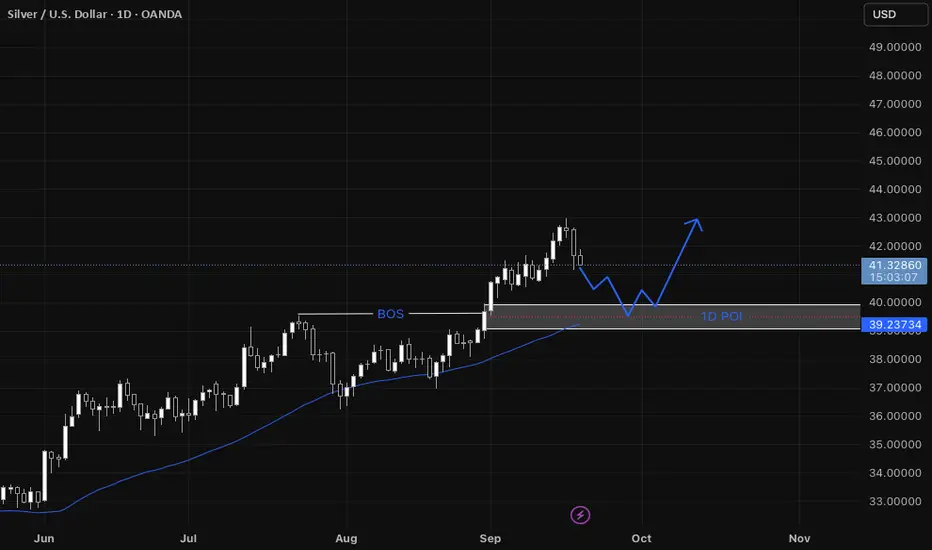
XAGUSD Step-by-step entry plan for XAGUSD
1. We have our Daily Point of Interest (POI)
- On the daily a zone that contains:
* a fair value gap (FVG),
* a break of structure (BOS) that previously acted as resistance and is now expected to act as support, and
* support from the 44 SMA.
2. Wait for price to return to the Daily POI
- Only consider the setup if price actually comes back into that daily POI zone.
3. Switch to the 1-hour timeframe to refine the entry
- Look for a shift in structure on the 1-hour (i.e., evidence that momentum is shifting bullish: BOS to the upside, higher highs/higher lows).
4. Confirm a 1-hour fair value gap forms
- The structure shift on 1-hour should create a 1-hour FVG (a short intraday imbalance).
5. Wait for the 1-hour FVG to be filled
- Let price fill that 1-hour FVG (price moves into/through the gap).
6. Look for a bullish confirmation on the filled 1-hour FVG
- After the fill, require a clear bullish formation on 1-hour (examples: bullish engulfing candle, strong demand candle, a higher-low + rejection wick).
7. Enter on the 1-hour bullish confirmation
- Enter when price breaks the confirmation level (e.g., breaks above the local 1-hour high formed by the bullish setup) or on a confirmed bullish candle close per your entry rules.
Bullish Silver is looking very very hot
Its bullish Flag making if silver sustain this week above 42.25$, then it comes to 49 superfast maybe next in two days only
There's no recommendations from my side
Only for learning purpose

XAGUSD / SILVER / SI ANALYSIS 01-SEP-2025LTP: 40.44x
Supports: 38.07/37.41/35.21
As long as the above supports levels hold, we will see 40.89-41.77-43.16 first.
Further Targets:
45.07
46.73-47.55-48.91 (Ultimate target)
52.50-53.37-55.95 (Extension)

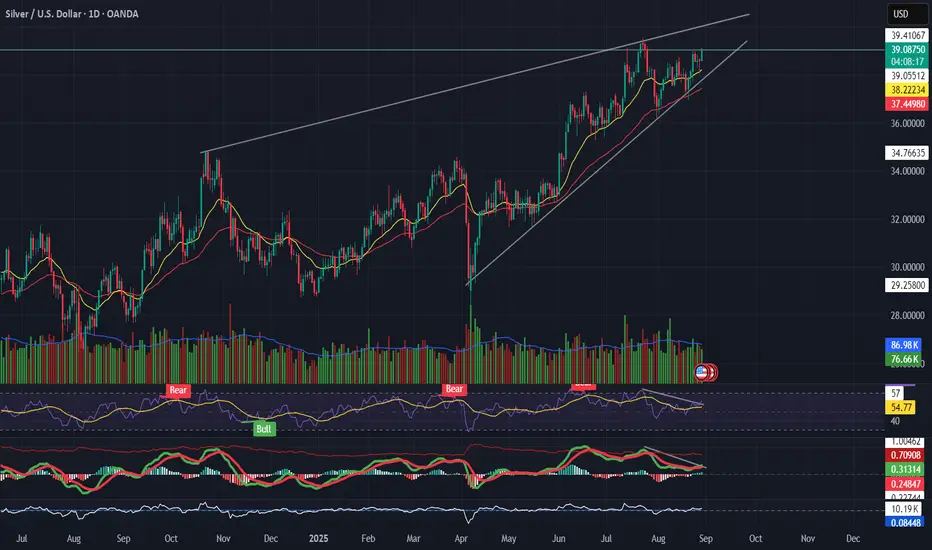
Silver (XAGUSD) Trading in a rising wedge Pattern📌 Silver (XAGUSD)
Trading in a rising wedge, pressing resistance near $39.
RSI divergence → price making higher highs, momentum not following.
MACD rolling over while price climbs = possible bearish divergence.
Support to watch: $37.3 → wedge breakdown if breached.
👉 Bullish only if $39.5 breaks with strong volume; otherwise, risk of pullback.
---
🎯 Takeaway
Silver = extended wedge → caution, momentum weak.
silver can be broughtsilver is at liquidity seweep level, silver can be brought sl below zone 3 mins candle closing target upper liquidity sweep


XAGUSD / SILVER / SI Analysis 12-Aug-2025: BULL or BEAR?LTP: 37.81x
Supports: 36.19/33.64
Base supports: 32.07/28.30
Resistance: 39.55
As long as the above supports hold, we can see 40.42 first.
Further 43.10/44.37, extension 47.47, 50.18

Silver sell given near 38.45 , better to book profit Silver sell recommended near 38.45 $ better to book profit,
Updated levels given on chart take trades intraday
Rate cuts geopolitical issues, tarrif will act both side move play safe , risk is high at current market scenario

Silver if break 37.55 then sell on on rise downside big target Silver if break 37.55 then sell on rise again downside target big mentioned on chart.
Avoid buying at current price

XAGUUSD/SILVER/SI ANALYSIS 05-AUG-2025: BULL or BEAR?LTP 37.41
Supports: 36.16/35.21
Resistance: 37.55/38.37/39.55
As long as 36.16/35.21 holds support, we can see new highs.
Targets: 39.55, 40.89, 41.77, 43.16, Extension 45.07
