here's my analysis for silverI have been trading silver since couple of years have accumulated mostly and I believe silver has still so much more to run pauses are important but don't panic if you are into a marathon.
Sprinters I don't know your game....
NFA
Trade ideas
Silver (XAGUSD) AnalysisSilver (XAGUSD) Analysis
Silver is trading near the top of its recent consolidation zone after rebounding from the 47.06–47.80 support area. Price is currently testing resistance at 48.90, aligned with a horizontal barrier and the upper Bollinger Band. While the short-term trend remains bullish, momentum is slowing near this resistance.
📌 Outlook • Upside: A sustained break above 48.90 could drive price toward 49.40. A breakout above 49.40 would confirm bullish continuation toward higher zones. • Downside: Initial support sits at 48.30–48.32 near the rising trendline. A break below could send price toward 47.83, then 47.06. A close under 47.06 turns the short-term bias bearish.
📈 Trend Short-term bullish, supported by higher lows and a rising trendline. Price action around 48.90–49.40 is key — rejection may trigger a corrective pullback.
🎯 Strategy • Buy-the-dip: Long entries near 48.30–47.80 with stops below 47.00, targeting 48.90 and 49.40.
• Aggressive shorts: Watch for rejection patterns near 48.90, targeting 48.30 and 47.80.
🔑 Key Levels • R2: 49.40
• R1: 48.90
• S1: 48.32
• S2: 47.83

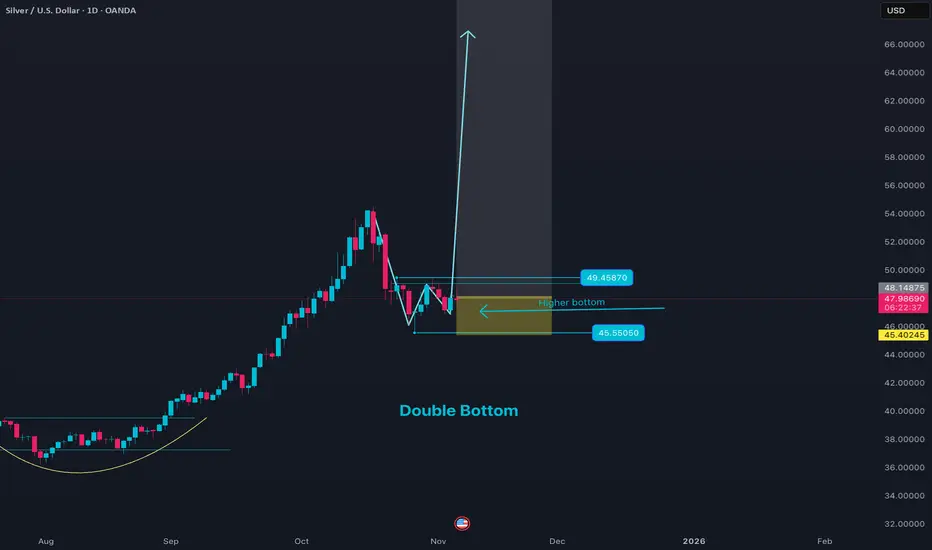
Silver Price Action set up with double bottomThe current price analysis for XAGUSD (Silver against US Dollar) in early November 2025 reveals a mixed but cautious outlook. Silver prices are moving within a corrective phase after exiting a bullish channel, trading approximately in the $47.50 range. Technical indicators such as moving averages currently suggest a bearish to neutral trend, with the price testing key resistance levels around $48.45.
Price momentum shows attempts to push higher, but resistance near $48.45 may lead to a price pullback or consolidation. If silver breaks above the critical resistance at $50.45, it could signal a renewed upward trend targeting levels around $52.35. Conversely, a failure to hold support near $46.75-47.00 may accelerate declines towards below $41.45, indicating a bearish phase.
Fundamentally, silver is influenced by the strength of the US dollar, industrial demand recovery (notably from solar energy and electronics sectors), and safe-haven buying amid global market uncertainty. The metal’s sensitivity to Federal Reserve policy and economic indicators continues to drive short-term volatility.
Traders should watch for sustained moves beyond the $48-$49 resistance or breakdown below $46.75 to gauge next directional trends. Overall, silver price dynamics suggest potential for both short-term rallies and corrections, dependent on macroeconomic cues and technical breakouts.
Silver Price Technical Analysis & Forecast November 2025 Get the latest Silver technical analysis and price forecast for November 2025. Discover critical support and resistance levels, bullish and bearish scenarios, and market momentum. Find out if Silver (XAG/USD) will break higher or see a pullback, with expert insights on trend direction and potential price targets.

XAG/USD (Silver vs USD) chart on the 2-hour timeframe...XAG/USD (Silver vs USD) chart on the 2-hour timeframe:
Price is moving within a descending channel, still below the Ichimoku cloud, indicating continued bearish pressure.
The recent candle is showing a rejection from the upper band of the channel / cloud resistance area (around 47.9–48.1).
My marked two target points on the chart — both aligning with the lower parts of the descending channel.
🎯 Target Zones (Bearish Outlook)
1. First target: around 46.00 – 46.20
→ This aligns with the mid-channel support and my first “target point” marking.
2. Final target: around 42.00 – 42.30
→ This corresponds to the lower channel boundary and my second, deeper target point on the chart.
🔹 Summary
Bias: Bearish below 48.10
Entry area: 47.8 – 48.0 rejection zone
Targets:
🎯 TP1 = 46.10
🎯 TP2 = 42.20
Invalidation: A sustained close above 48.20 would weaken this bearish structure and could trigger a cloud breakout.

Silver (XAGUSD) Technical Overview
Silver remains in consolidation after a recent pullback, holding support at 46.80. Price stays capped by a descending trendline, reflecting short-term selling pressure, though buyers continue to defend the lower boundary.
### Upside
A breakout above 48.22 would strengthen bullish momentum, targeting 49.30 and potentially 50.65 if sustained.
### Downside
A drop below 46.80 could extend losses toward 45.82. Sustained weakness below 45.80 may indicate a deeper correction.
### Trend
Short-term bias is bearish to neutral. Bulls need a clear move above 48.22 to regain control.
### Strategy
- Bullish: Buy only on a confirmed breakout above 48.22, aiming for 49.30 / 50.65, stops below 47.00.
- Bearish: Sell near 48.22–49.30 or on a breakdown below 46.80, targeting 45.82, stops above 48.30.
### Key Levels
- R2: 50.65
- R1: 49.30
- S1: 46.80
- S2: 45.82

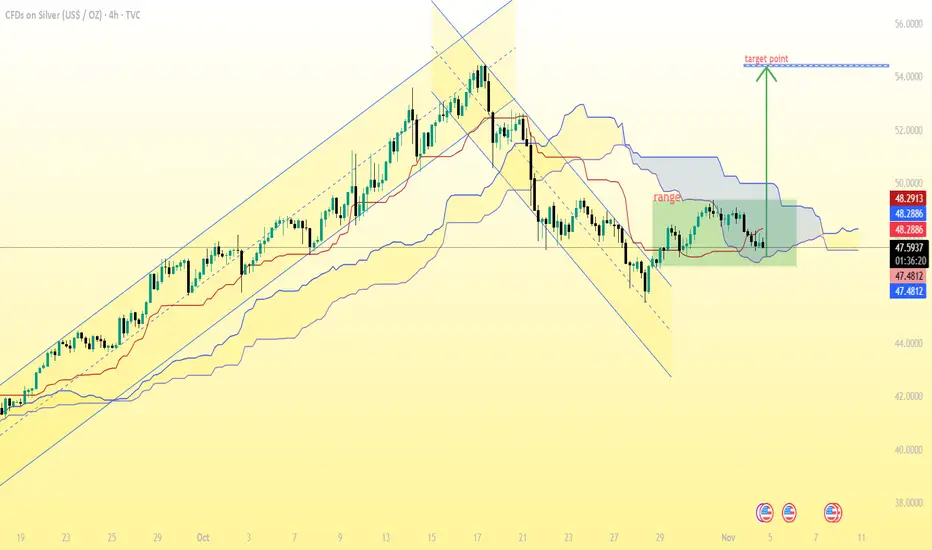
(Silver / USD, 4H timeframe)...(Silver / USD, 4H timeframe):
✅ Analysis Summary:
The price has broken out of a falling channel and is now moving inside a range, just below the Ichimoku cloud.
The projected move (marked on my chart) shows a bullish breakout from the range.
The measured move target from the breakout zone points upward to the $52.15–$52.50 area.
📈 Target Levels:
Immediate resistance: $48.30 – $48.70
Breakout confirmation: Above $49.00
Main bullish target: $52.10 – $52.50
Extended target (if strong momentum): $53.80 – $54.00
📉 Support levels:
$47.50 (near cloud base)
$47.00 (range bottom)
➡ Conclusion:
If Silver sustains above $49.00, the next target is $52.15 – $52.50 as shown in my chart.
If it fails to hold above $47.50, the bullish setup becomes invalid.
L
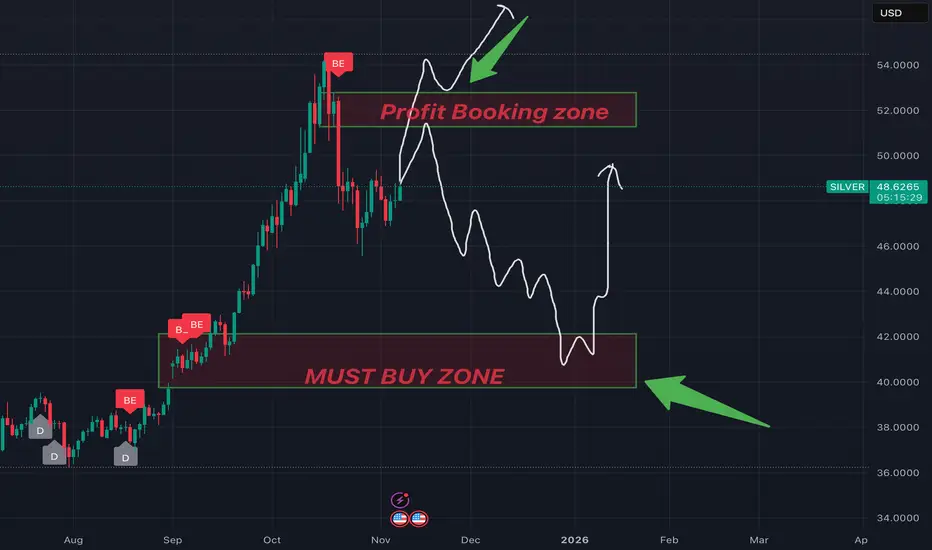
Silver sell on rise we can see 45.60 to 45$ re testSilver sell on rise recent low will be re tested 45.60 to 45 $
How My Harmonic pattern projection Indicator work is explained below :
Recent High or Low :
D-0% is our recent low or high
Profit booking zone ( Early / Risky entry) : D 13.2% -D 16.1 % is
range if break them profit booking start on uptrend or downtrend but only profit booking, trend not changed
SL reversal zone (Safe entry ) : SL 23.1% and SL 25.5% is reversal zone if break then trend reverse and we can take reverse trade
Target : T1, T2, T3, T4 and .
Are our Target zone
Any Upside or downside level will activate only if break 1st level then 2nd will be active if break 2nd then 3rd will be active.
Total we have 7 important level which are support and resistance area
Until , 16% not break uptrend will continue if break then profit booking will start.
If break 25% then fresh downtrend will start then T1, T2,T3 will activate
1,3,5,10,15,20 minutes are short term levels.
30 minutes 60 minutes , 2 hours,3 hours, ... 1 day and 1 week chart positional and long term levels

Silver Look good for long Key Technical Levels:
RESISTANCE:
Immediate: $48.82 (today's high)
Major: $49.00 psychological level
Strong: $51.00 area
SUPPORT:
Immediate: $48.44 (today's low)
Critical: $48.00 psychological level
Major: $46.00 area

XAGUSD – Technical Outlook
Trend Overview:
- Weekly: Overall bullish structure, though currently in a pullback phase after printing a new high at 49.35. Price is now trading within the discount zone (48.0–47.0).
- Daily: Market is undergoing a corrective move but continues to hold key demand at 48.0–47.6, where buyers remain active.
- 4H / 1H: Short-term sentiment leans bearish, with price rejecting the 49.2–49.4 resistance area.
Key Levels:
- Resistance: 48.95–49.05 → 49.20–49.40 → major cap at 50.30–51.00.
- Support: 48.00–47.60 → 47.20 → 46.80–46.40.
Trade Ideas:
- Short Setup:
- Entry: 48.95–49.05 (upon bearish confirmation)
- Stop Loss: 49.30
- Targets: TP1 48.50 → TP2 47.80 → TP3 47.20
- Long Setup:
- Entry: Only if price sweeps below 47.80 and shows a clear bullish reaction
- Stop Loss: 47.40
- Targets: TP1 48.50 → TP2 49.20
Invalidation Levels:
- Bullish shift: 4H close above 49.40
- Bearish continuation: Daily close below 47.50
Outlook:
Price may remain range-bound through the early session, with a potential dip toward 48.5–47.8 before the next significant directional move (likely during US hours).

Silver 45.60$ target hit then bounce , start buying on dip againHow My Harmonic pattern projection Indicator work is explained below :
Recent High or Low :
D-0% is our recent low or high
Profit booking zone ( Early / Risky entry) : D 13.2% -D 16.1 % is
range if break them profit booking start on uptrend or downtrend but only profit booking, trend not changed
SL reversal zone (Safe entry ) : SL 23.1% and SL 25.5% is reversal zone if break then trend reverse and we can take reverse trade
Target : T1, T2, T3, T4 and .
Are our Target zone
Any Upside or downside level will activate only if break 1st level then 2nd will be active if break 2nd then 3rd will be active.
Total we have 7 important level which are support and resistance area
Until , 16% not break uptrend will continue if break then profit booking will start.
If break 25% then fresh downtrend will start then T1, T2,T3 will activate
1,3,5,10,15,20 minutes are short term levels.
30 minutes 60 minutes , 2 hours,3 hours, ... 1 day and 1 week chart positional and long term levels

#Silver | Falling Wedge + Inverse H&S = Bullish Cocktail#XAGUSD | 4H Chart
Head & Shoulders completed its breakdown target ✅
Price found support at the demand zone, formed a falling wedge breakout, and built an Inverse H&S.
Now consolidating right below the neckline, watching Immediate Resistance @48.464 👀
Above this, potential retest of key resistance zone 49.459 – 50.475/50.897 (previous H&S breakdown area).
Bias: Bullish above 48.464; confirmation on 4H close 🔥
#Silver #XAGUSD #HeadnShoulders #FallingWedge #InverseHeadnShoulders #PriceAction
📌 Disclaimer: This analysis is shared for educational purposes only. It is not a buy/sell recommendation. Please do your own research before making any trading decisions.

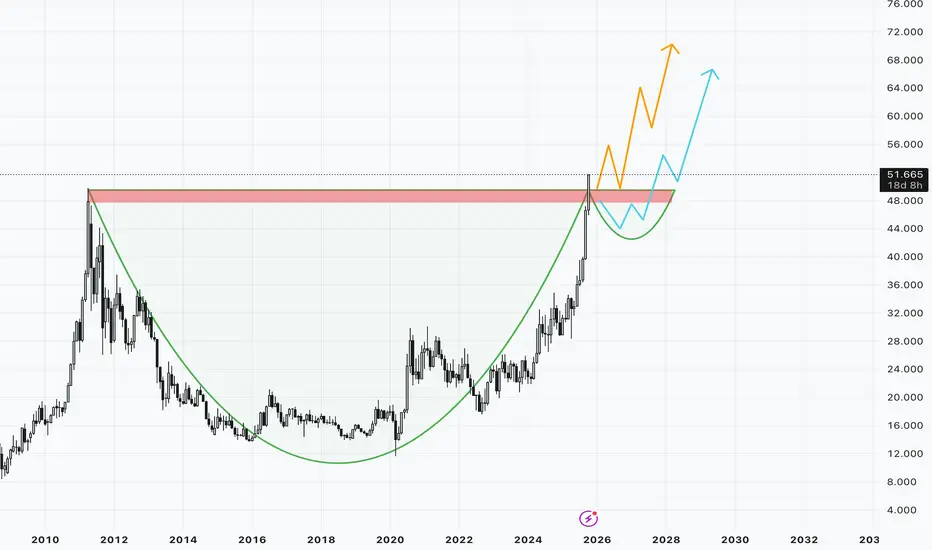
Silver breakout above ATH. What to expect next?Chart Analysis:
Silver gave a breakout above its all time high and major psychological level of 50$. All the technicals are very strong in the short run.
Looking at the monthly chart it looks like C recovery and breakout above major resistance without the H formation making the C&H pattern incomplete.
13 trading days still left for the monthly close and for the breakout to become valid if closes above 50$.
What next? :
Curently looks like a clean breakout on charts. Wait for the monthly close above 50$ which will then make the breakout valid. If the breakout is valid we will wait for a retest near the zone for fresh longs. If it doesn't close the the C&H pattern can come into play. Expecting some cooldown in the prices in the coming weeks but closing is most imp. Wait and watch is current scenario.
Key Levels :
Major Support : 50$/46$ Clbs
Minor Support zones : 48.5-48.6$/47.5-47.6$
Long Run View :
Buy on dips is the best strategy to play out in Silver making entries on crucial levels. Expecting Silver to outperform Gold in the long run.
Disclaimer :
I am not SEBI registered. This analysis is for educational purposes only and not investment advice. Please do your own research before trading or investing.
Silver as said on Friday until 50$ not break sell on rise only As said on Friday sell on rise until 50$ break , still sell on rise avoid buying at current price 45.50 to 44$ possible
How My Harmonic pattern projection Indicator work is explained below :
Recent High or Low :
D-0% is our recent low or high
Profit booking zone ( Early / Risky entry) : D 13.2% -D 16.1 % is
range if break them profit booking start on uptrend or downtrend but only profit booking, trend not changed
SL reversal zone (Safe entry ) : SL 23.1% and SL 25.5% is reversal zone if break then trend reverse and we can take reverse trade
Target : T1, T2, T3, T4 and .
Are our Target zone
Any Upside or downside level will activate only if break 1st level then 2nd will be active if break 2nd then 3rd will be active.
Total we have 7 important level which are support and resistance area
Until , 16% not break uptrend will continue if break then profit booking will start.
If break 25% then fresh downtrend will start then T1, T2,T3 will activate
1,3,5,10,15,20 minutes are short term levels.
30 minutes 60 minutes , 2 hours,3 hours, ... 1 day and 1 week chart positional and long term levels

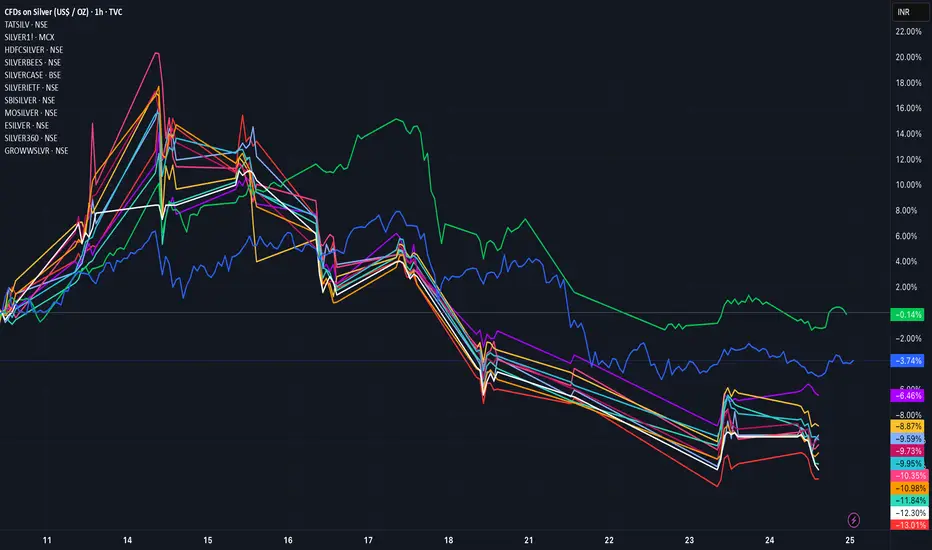
A General percentage scale between multiple Silver ETFsA General percentage scale between multiple Silver ETFs
Silver comex sell on rise until 50$ not break 45.50 to 44$ come How My Harmonic pattern projection Indicator work is explained below :
Recent High or Low :
D-0% is our recent low or high
Profit booking zone ( Early / Risky entry) : D 13.2% -D 16.1 % is
range if break them profit booking start on uptrend or downtrend but only profit booking, trend not changed
SL reversal zone (Safe entry ) : SL 23.1% and SL 25.5% is reversal zone if break then trend reverse and we can take reverse trade
Target : T1, T2, T3, T4 and .
Are our Target zone
Any Upside or downside level will activate only if break 1st level then 2nd will be active if break 2nd then 3rd will be active.
Total we have 7 important level which are support and resistance area
Until , 16% not break uptrend will continue if break then profit booking will start.
If break 25% then fresh downtrend will start then T1, T2,T3 will activate
1,3,5,10,15,20 minutes are short term levels.
30 minutes 60 minutes , 2 hours,3 hours, ... 1 day and 1 week chart positional and long term levels

XAGUSD Analysis | Silver at Critical Support📉 XAGUSD Analysis | Silver at Critical Support
Silver is holding near the $47.30 – $48.00 support zone, with current price around $48.08.
📊 Trend
Medium-term bias remains bearish after the sharp drop from ~$54.50. A downward trendline continues to act as dynamic resistance.
🔻 Support Levels
Maintaining $47.30 – $48.00 is crucial. A breakdown below could trigger another strong leg lower.
🔺 Resistance Levels
Key barrier sits at $50.00 – $50.49, aligned with:
• Downtrend line resistance
• Previous support turned resistance
A sustained break above may signal early reversal momentum.
📌 Outlook
Price is consolidating near support. The structure stays bearish unless bulls reclaim $50.00 – $50.49 and close above the trendline.

XAGUSD (Silver/USD) 1-hour chart...XAGUSD (Silver/USD) 1-hour chart, here’s what I can observe and infer about potential target levels:
---
🔍 Chart Summary:
My using Ichimoku Cloud and trendlines.
Price is currently around $49.10.
The chart shows two target points drawn:
1. First Target Point: Around $51.90 – $52.00
2. Second Target Point: Around $54.30 – $54.50
---
🎯 Target Levels Based on the Chart:
1. First Target (Short-Term):
Around $51.9 – $52.0
This coincides with resistance from the previous range and Ichimoku cloud top.
Represents a possible initial take-profit zone if price breaks above current consolidation.
2. Second Target (Extended):
Around $54.3 – $54.5
Aligns with the projected measured move from my trendline channel.
This would be the larger bullish target if price sustains above the $52 breakout zone.
---
📈 Trading Idea (Hypothetical Example):
Buy Zone: Above $49.5 – $49.8 (confirmation breakout)
Target 1: $51.9 – $52.0
Target 2: $54.3 – $54.5
Stop Loss: Below $48.5 support (near Ichimoku base)

XAGUSD (Silver vs USD) on the 1-hour timeframeXAGUSD (Silver vs USD) on the 1-hour timeframe, here’s what can be inferred:
The price has clearly broken below the ascending trendline.
It also broke down through the Ichimoku cloud, confirming a bearish signal.
There’s a sharp rejection candle followed by continuation below previous structure support (around $52.00–$51.80).
My marked a “target point” on your chart — roughly near $47.50, which seems to be aligned with the next major support zone from earlier price action (likely a demand area or Fibonacci retracement level).
🧭 Technical Breakdown:
Current Price: ~$51.81
Immediate Resistance: $52.30–$52.45 (bottom of the cloud)
Support/Target:
Short-term: $50.80
Medium-term: $49.50
Major target (as on your chart): $47.50
🎯 Expected Target:
If bearish momentum continues and the price stays below the $52.00 resistance, your target of $47.50 looks reasonable as a swing target.


Silver – Monthly RSI Hits 80: Historical Correction Zone Ahead?This is a Monthly chart analysis of Silver (XAG/USD). Historically, every time the Monthly RSI has reached the 80 level, it has signaled a significant price correction. Let’s look at the data:
Past RSI-80 Peaks and Subsequent Corrections:
Mar 2004 – 34% correction
Apr 2006 – 37% correction
Mar 2008 – 55% correction
Apr 2011 – 47% correction
Aug 2020 – 41% correction
Now in Oct 2025, the Monthly RSI has again touched 80, and we’ve already seen a correction of ~11% from the recent all-time high of $54, which puts the current move in context with past cycles.
Current Market Outlook & Strategy
Silver has corrected ~11% from its recent high of $54, now trading around $48. Price rejection seen from April 2011 (~$49.7), a historically key resistance / reversal zone.
The Sep 2025 monthly candle low is ~26% off the ATH, marking a significant drawdown. Given this setup, I’m adopting a cautious stance:
+ Booking partial profits below the October low of $45.82 (as of 22nd Oct )
+ Trailing the rest of my position using the previous month’s low as a dynamic stop
Re-entry Plan
I will consider adding back exposure on either
A clean breakout above the all-time high ($54) with volume and confirmation
OR
A pullback toward the Monthly 20 SMA, historically a reliable support zone
Summary
While the long-term trend remains bullish, historical RSI extremes suggest tactical caution is warranted at these levels. Corrections in the 34-55% range have followed similar RSI peaks in the past - and we may not be done yet.
Stay flexible. Protect gains. Let the market confirm the next move.

Buy Silver for 54 DollarSilver Daily Chart:
Triangle Breakout with Momentum :
any Retest will give a opportunity to add for long Term Portfoilo.
Fibo Trend Setup suggesting 54 Dollar is coming in some months

XAG/USD Technical Analysis (as of October 19, 2025)Current Market Snapshot
The spot price of silver (XAG/USD) stands at 51.91430 USD per ounce, reflecting a sharp decline of -2.3663 (-4.36%) from the previous close of 54.24 in daily time frame. This pullback follows recent record highs near 54.48, driven by safe-haven demand amid geopolitical tensions and inflation concerns, but now facing profit-taking and a stronger USD.
Support and Resistance Levels
Immediate support is at 51.44, with a critical level at 50.00 if breached.
Resistance looms at 54 to 57.02.
Chart for your reference
~~ Disclaimer ~~
Trading or investing in assets like crypto, equity, or commodities carries high risk and may not suit all investors.
Analysis on this channel uses recent technical data and market sentiment from web sources for informational and educational purposes only, not financial advice. Trading involves high risks, and past performance does not guarantee future results. Always conduct your own research or consult a SEBI-registered advisor before investing or trading.
This channel, Render With Me, is not responsible for any financial loss arising directly or indirectly from using or relying on this information.
