SOLUSD Trade Idea – Resistance Breakout Expected Solana (SOLUSD) is currently testing a key horizontal resistance zone around 163.2, marked by multiple rejections in the past. After consolidating beneath this level, the price has managed to reclaim the resistance zone, and now it appears to be retesting it as fresh support.
🔍 Technical Analysis Highlights:
Timeframe: 15-minute chart
Resistance Breakout Zone: ~163.2 (pink horizontal line)
Retest in Progress: Price is currently pulling back to the breakout zone, indicating a potential bullish continuation if the level holds.
Bullish Setup: The green box shows the expected upside zone (target area up to ~165.40), while the red box shows the downside risk zone (~160.80).
Risk-Reward Ratio: Favorable setup with tight invalidation just below the retest zone.
Trade ideas

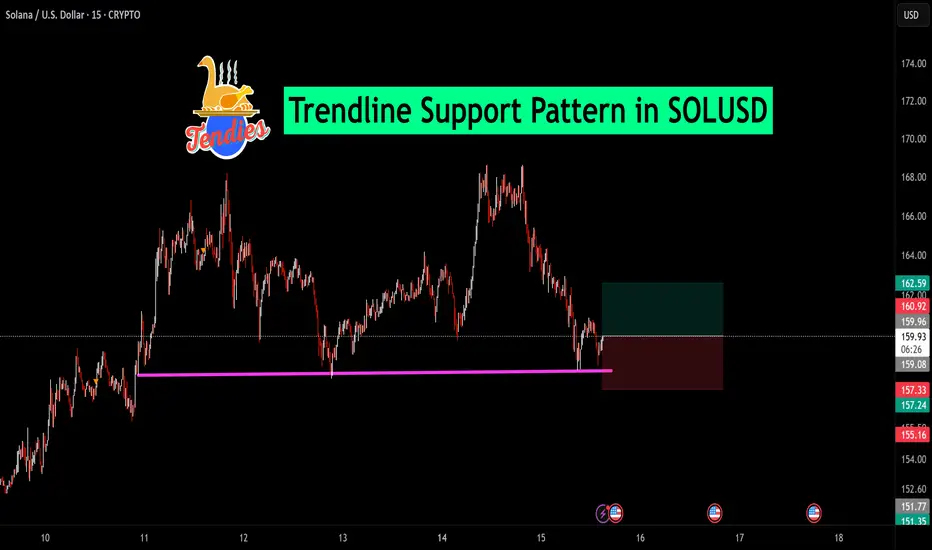
Trendline Support Pattern in SOLUSDSolana (SOLUSD) is currently holding a critical horizontal trendline support near the $157.20–$157.30 zone. Price has tested this level multiple times, confirming strong buyer interest around this area.
📈 Long Trade Setup:
Entry: Around $159.88
Stop Loss: Below $157.24
Target Zone: $162.59 and above
🟢 Chart Highlights:
Multiple rejections from the horizontal support zone marked in magenta, indicating strong base formation.
This level has acted as a springboard for bullish moves in previous sessions.
A successful bounce from here can initiate a short-term rally.
SOLUSD Trade Setup | 15-Min ChartSolana is currently respecting a strong intraday support zone (marked in pink), with multiple rejections seen at that level. After a sharp pullback, price has shown signs of base formation.
📌 Trade Idea:
Entered long position at support with a tight stop-loss just below the recent wick.
🎯 Target: 166.21
🛑 Stop-loss: 160.92
🧮 Risk-to-reward is favorable; waiting for a breakout follow-through.
Keep this setup on radar as it offers a clean bounce opportunity from a demand zone.

Solana (SOLUSD) - 15min Chart Update🔄 Price Action: Solana is currently retesting the support zone around the $157 level, which has held firm multiple times as shown by the repeated bounces (highlighted by arrows).
📊 Trade Setup:
Support Level: $157
Entry Zone: Near support after confirmation
Target Zone: $158.69 – $159.08
Stop Loss: Below $156.44
⚠️ Risk Management is Key.
The price structure suggests a bullish bias if support holds. Keep an eye on volume and momentum confirmation before entering.

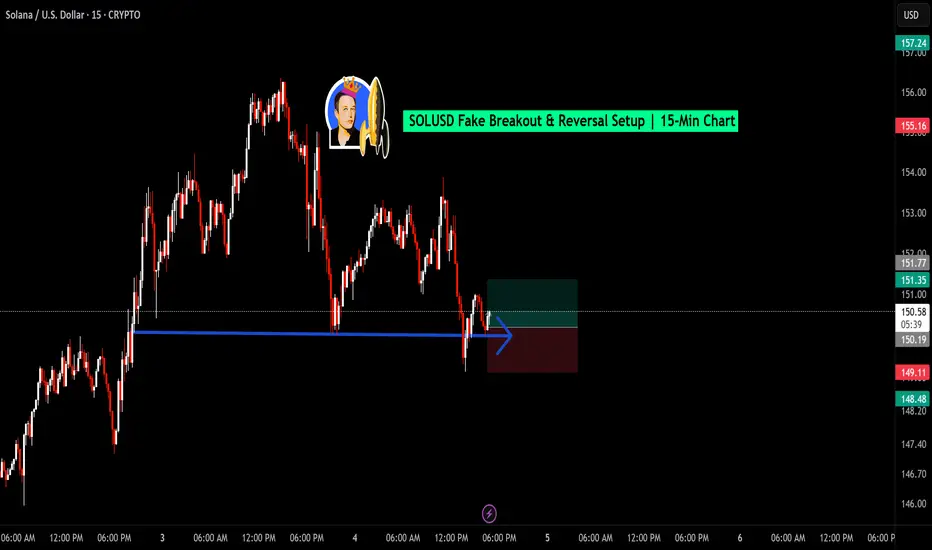
SOLUSD Fake Breakout & Reversal Setup | 15-Min ChartAfter a fake breakdown below the recent support, Solana (SOLUSD) is showing signs of reclaiming strength. Price has retested the $149.97 level, which acted as a key zone of liquidity, before resuming its upward march.
This move suggests that the earlier dip was a liquidity hunt, shaking out weak hands before a potential reversal.
📈 A bounce from $149.97 can trigger a bullish move toward the $151.35–$151.77 resistance zone.
Key Levels:
🔹 Retest Support: $149.97
🔹 Resistance Zone: $151.35–$151.77
🔹 Bullish Confirmation: Break and close above $151.77 with volume
Watch price action closely around $149.97 for confirmation of the reversal.
Bearish Outlook on SOLUSD – Breakdown Below Key SupportSolana (SOLUSD) is showing a clear bearish structure on the 15-minute chart. The price has decisively broken below a crucial horizontal support zone near $149.50, which previously acted as a strong demand area.
This breakdown is accompanied by consistent lower highs and lower lows, confirming bearish momentum. The price has now entered a potential supply zone retest (marked in red), which may act as a resistance if the pullback fails to regain the broken support.
If selling pressure continues and SOLUSD sustains below the $149–$150 zone, we can expect further downside toward the next support levels around $147.50 and $145.00.
🔻 Bearish Confirmation:
Breakdown of key support
Failure to hold above the demand zone
Trend continuation to the downside
📉 Levels to Watch:
Resistance: $149.50 – $150.00 (retest zone)
Support: $147.50 and $145.00 (next bearish targets)

Bearish View on SOLUSDSolana (SOLUSD) is showing signs of weakness after testing a strong resistance zone near $148.50–$149.00, where it previously faced selling pressure. The current 15-minute chart displays a sharp rejection from this resistance, followed by a bearish candle near the breakout level. This could indicate a potential fakeout or bull trap.
The price has returned below the marked horizontal resistance line (blue), and the wick rejections suggest that buyers are losing momentum. If the price sustains below $146.90, further downside toward the next support around $144.70 and potentially lower toward $142.50 is possible.
Key Bearish Signals:
Strong resistance rejection at $148.50–$149.00
Failure to sustain above breakout zone
Bearish risk-reward setup activated
Lower time frame exhaustion visible after a strong rally
Levels to Watch:
Resistance: $148.50 – $149.00
Support: $144.70 and $142.50
Breakdown confirmation: Below $146.50

Solana (SOLUSD) Update – 15M ChartPrice has perfectly retested the breakout zone near $131.80 (blue support level), showing a strong bounce from the previous resistance-turned-support. This retest confirms structure, and we may now expect a bullish continuation towards the $137.50–138.00 zone.
📌 Support Level: $131.80
🎯 Target: $137.50 – $138.00
📉 Stop-loss: Below $131.38
Bias: Bullish (as long as price holds above support)

Resistance Holding Strong in SOLUSD (15-min Chart)Solana is currently testing a descending trendline resistance on the 15-minute timeframe. Despite multiple attempts, the price is struggling to sustain above the trendline, indicating continued bearish pressure.
📉 Setup Overview:
Trendline: Clear descending resistance line
Price Action: Rejected after minor breakout attempt
Bias: Bearish below the trendline
Short Entry Zone: Near $159.78
Target: $157.94
Stop-loss: $161.62
🧠 Insight: A rejection at this level could signal continuation of the downtrend. If price fails to break out convincingly, a short opportunity remains valid with defined risk.

Solana Technical Commentary on Bullish Rally (SPOT ETF APPROVAL)- Solana is currently trading at 165$
- Solana can be the next Money Printer
- Solana could be the next one to rally because SOL Spot ETFs may get approved by the SEC next month according to Bloomberg
- Bloomberg has mostly been accurate on past SPOT ETF approval calls
- Solana has a higher transaction volume with minimal congestion and low fees.
- Technically, I see the 140-150$ range as an OTE and once Solana breaks above 180$ I will wait for a pullback before adding more size
- Betting Big on Solana looks highly rewarding from a structure perspective 250$ looks easy by the end of Q4

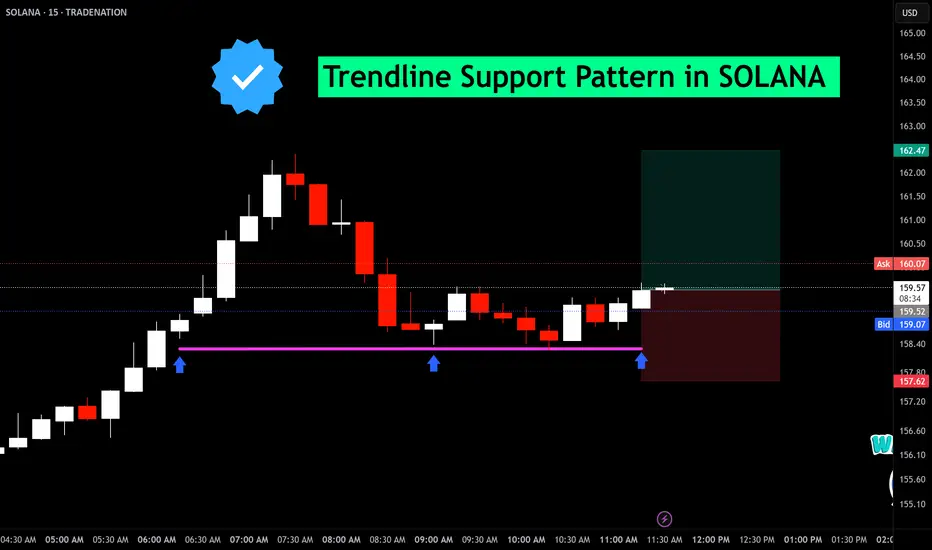
Trendline Support Pattern in SOLANA (15-min chart)SOLANA has formed a clean trendline support with multiple strong rejections near the $157.60–$157.80 zone, as highlighted by the blue arrows. After a brief consolidation and support confirmation, price is now attempting to reclaim upward momentum.
📌 Entry: Around $159.50
🎯 Target: $161.40
🛑 Stop Loss: Below $157.60
🔁 Risk-Reward Ratio: Favorable setup (approx. 2:1)
🧠 This setup is based on a bullish reversal at horizontal trendline support, often a reliable short-term bounce zone in volatile assets like SOL.
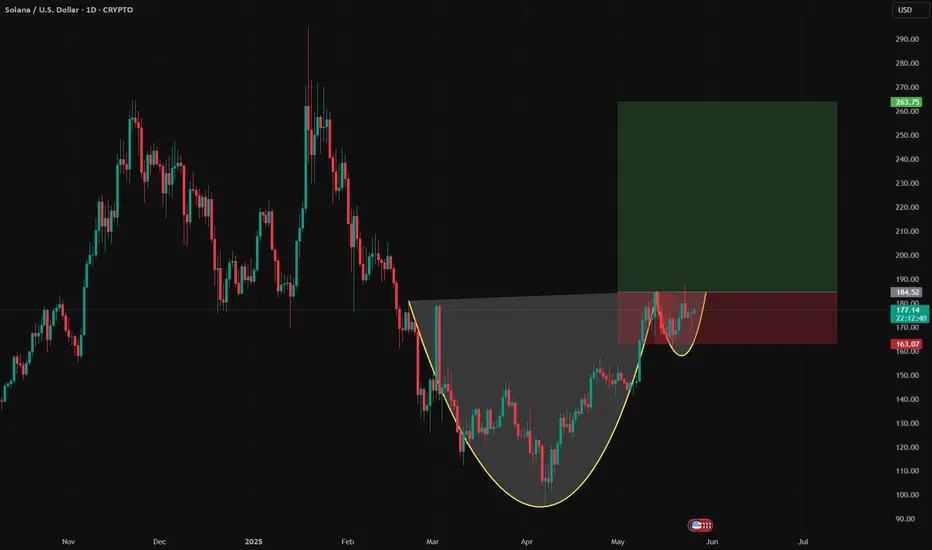
SOLUSD – Cup & Handle Structure - Near Breakout Confirmation ?Solana is currently presenting a high-conviction Cup and Handle formation on the daily chart, signaling the potential for a bullish breakout continuation if key technical levels are reclaimed with volume confirmation.
This pattern began developing after the March 2025 bottom, with price action curving up steadily over several weeks, forming a well-rounded base. The handle has recently developed as a shallow pullback on declining volatility — a favorable characteristic in this setup.
Consolidation Phase
Price moved sideways, indicating accumulation.
Breakout above 150-160 in early 2025 confirmed bullish shift.
Bullish Case:
If 185 holds, expect a retest of 200-220.
Break above 220 opens path to 265 (≈50% rally).
Bearish Risk:
Close below 165 invalidates bullish structure, targeting 150.
Solana Chart Analysisthis is Solana chart and in this ready to break this last range. if price break upside resistance as i showed in chart then we can see a upside move.
Solana (SOL) Analysis & Long Trade Plan – May 2025Solana ( CRYPTO:SOLUSD ) has re-emerged as one of the strongest Layer-1 blockchain plays, continuing its impressive recovery and adoption since the FTX fallout. With major ecosystem developments, lower fees, and blazing-fast throughput, SOL is now more than just an "Ethereum killer"—it’s a key pillar of the next wave of decentralized apps.
🔍 Current Technical & Fundamental Snapshot
Price: ~$151 (as of May 1, 2025)
Market Cap: ~$71B
24h Volume: ~$2.1B
Rank: Top 5
TVL: Over $4.2B
NFT & DeFi growth: Rapid expansion on platforms like Jupiter, Drift, and Tensor
Ecosystem Catalysts:
Firedancer validator client nearing launch (scaling & security upgrade)
Breakpoint 2025 announcements expected soon
Ongoing migration of dApps from Ethereum due to gas costs
📈 Chart Overview (Weekly Timeframe)
Trend: Bullish
Support Zones: $147, $145
Resistance Zones: $165, $195
Structure: Forming higher lows and higher highs since 9th April 2024
RSI: 63 – no signs of overbought yet
Volume: Healthy on green candles, strong accumulation
🎯 Long-Term Trade Plan (Q2–Q4 2025)
✅ Entry Zones:
DCA Zone: $150–$155
Aggressive Buy: $145 retest (if market pulls back)
🎯 Targets:
TP1: $165
TP2: $195
TP3: $260 (previous ATH zone)
TP4: $320 (expansion based on 1.618 Fibonacci)
❌ Stop-Loss:
Close daily candle below $138 with volume (invalidates structure)
🧠 Risk-Reward Outlook
R:R from $152 to $195 = 1:3
Macro Bull Scenario to $260 = >1:7.5
Probability Adjusted Expectation: High, due to strong ecosystem use and dev activity
📌 Final Thoughts
Solana has proven its resilience, fixing past outages and seeing revived interest from both developers and institutions. With token unlocks behind us, clean funding rounds, and real user activity, SOL remains a solid long-term crypto play for 2025.
⚠️ Not financial advice. Always DYOR and manage your position size properly.
Solana Might Rally Towards $220 Solana is currently forming a classic cup and handle pattern on the daily chart, which, when confirmed, is a strong bullish continuation setup.
The cup formed over several weeks with a rounded bottom and volume decreasing midway through the base, which aligns with traditional pattern behavior.
The current handle is consolidating as a downward-sloping bull flag. Volume is gradually tapering off during the handle — again, a textbook characteristic suggesting sellers are losing steam.
A daily candle close above ~$153.30 on solid volume would confirm the breakout.
That level also aligns with previous local highs, making it a key resistance zone.
Once confirmed, the pattern implies a measured move target near $220, derived from the depth of the cup.
Stop-loss could be a close below the previous local lows.
What do you think of this setup? Would you enter on the breakout or wait for a retest?

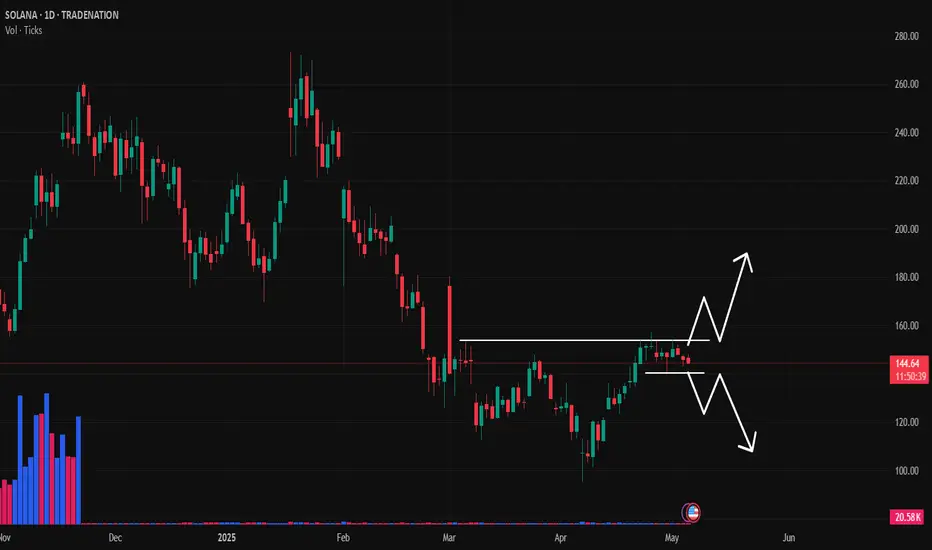
SOL - Getting ready for Big Breakout.Price has taken double bottom support. Price rejection from second resistance line is getting reduced. Any up move from BTC, SOL will give bigger breakout for sure. So trend will follow in whichever side price breaks the lines. I think not much downside can be seen in SOL since it has fallen from 250 levels to this low. SOL is next to BTC and ETH right now and its widely used. Price is at very attractive levels keeping ETF approvals in few weeks or 2 months this year. SOL is also one of the coins for strategic reserve.
Solana 4H Swing Long Entry Setup - Solana is currently trading at 128.8$
- Solana is trying to shift its market structure to bullish, and this will be confirmed once we see a flip above 136-139$
- Solana on a 4H TF is trying to build a consolidation base which should eventually lead to a larger expansion
- Solana and the whole crypto market is currently waiting for a bullish catalyst in order to move higher
- We have 4 central banks speaking this week all eyes on what Jerome Powell will comment and this will dictate the price action for the upcoming weeks.
- Manage risk properly and don't over risk

Support sustain 190 And up side move Bullish Trends Stick follow with stoploss and
190 Level Multiple time touch and sustainability that level and bounce so Upside move Confirmed

SOLUSD ANALYSISSolana (SOL/USD) is in a consolidation phase within a range on the H4 timeframe, repeatedly taking support from its 200 EMA. This suggests a potential breakout scenario. 🚀
Possible Trade Setups:
Breakout Above the Box (Bullish Scenario)
If SOL/USD breaks the resistance of the consolidation range with strong volume, it could trigger an upward momentum.
Targets: Measure the height of the box and project it upwards.
Confirmation: Look for a candle close above the range + increased volume.
Breakdown Below the Box (Bearish Scenario)
If SOL/USD breaks below the support of the box and the 200 EMA, it may lead to strong downward movement.
Targets: Similar to the bullish scenario, measure the box’s height and project it downward.
Confirmation: A candle close below the range with strong volume.
Key Things to Watch:
✅ Volume increase on breakout.
✅ Retest of the breakout level (flip of support/resistance).
✅ Market sentiment and BTC movement (as SOL is correlated).

I just spot bough 100% SOLBanana Zone commence?
Interest rates will lower next year.
I just could not be in stables right now. It just did not seem right.
I don't have the time to be day trading, although I have recognized set ups that I may take the time to trade during trending days. Pullbacks end with small bodied candles which provide tight SL scalp opportunities. Impulsive days may have 3 or 4 pullbacks and breakout setups before the price action does wide shakeout, double bottom patterns. Solana in the intraday also tends to end trends with diagonals, up or down. Break out and retests are very common especially at the beginning of trends. I have noticed I also tend to have a bearish bias at all times, and my eyes have been trained more for bearish setups. The bullish retests tend to be more volatile, I have noticed.
Perhaps I will spot sell at a future date. In a couple weeks even. I do not expect the next month to see parabolic action. I anticipate consolidation, but that is my bearish mindset talking. I am not bullish enough?
The boxes set context to the chart. Its a copy paste of the current pullback.

SolanaTarget
290 to315
It not feeling Deep analysis (I'mean it sol ecosystem very strong reachable)
.
Goodluck holders

Solana Next Target is 202, 251 USD.. Triangle Pattern BreakoutSolana has formed a Triangle Pattern and Breakout, with the Next Target at 202 USD and a Final Target of 251 USD. Take advantage of this Great Opportunity to Earn a Potential Profit of +45% ROI and Overall +74%ROI. Check my Previous Analysis below, already reached the first Target at 174 USD with (+20% Profit).
This is a Long-Term Analysis, it's important to follow Trend continuation techniques.
I want to help People Make Profit all over the World.
PREVIOUS ANALYSIS : Before & After,

Solana Next Target is 174 USD, Gain +20% ProfitIn Solana, Triangle Pattern formed and Expecting Breakout. So Next Target is Top of the Triangle Pattern, Target price is around 174 USD. Potential to Achieve a +20% percentage Profit.
I want to help people to Make Profit all over the "World".
