Trade ideas

$SOL — Neckline Rejection Playing Out Exactly as Expected CRYPTOCAP:SOL — Neckline Rejection Playing Out Exactly as Expected
Price tapped the neckline zone at 144–146 and got rejected cleanly — exactly the reaction we anticipated from this double-bottom structure.
The rejection has already pushed price back toward the 138–136 zone, which is the first support area we marked in advance.
✔️ What this means
Neckline rejection = pattern not confirmed yet
Price is now retracing into the expected pullback zone
Structure remains neutral until the neckline is broken with strength
🔍 Levels to Watch
Support: 138 - 136
Bullish only if:
#Solana breaks above 146 with momentum → opens 152 → 158.
Bearish only if:
136 fails → price can revisit 132–128.

Part 2 Candle Stick PatternsOption Expiry Types
Options expire on:
Weekly expiry (popular for indices like NIFTY)
Monthly expiry
Quarterly expiry
As expiry nears:
Premium decay accelerates
Volatility spikes
Price movements become sharper

Managing Trading Risk: Foundation of Long-Term Market SuccessUnderstanding Trading Risk
Trading risk refers to the possibility of losing capital due to unfavorable market movements, poor decisions, or unexpected events. Every trade carries risk, whether in stocks, derivatives, forex, or crypto markets. Market volatility, news events, economic data, and geopolitical factors can cause sudden price fluctuations. A trader’s goal is not to eliminate risk—because that is impossible—but to control and manage it effectively.
Risk management begins with accepting that losses are inevitable. Many beginners enter the market focusing only on profits, ignoring the downside. This mindset often leads to emotional trading, oversized positions, and account blow-ups. Professional traders, on the other hand, think first about how much they can lose before considering how much they can gain.
Capital Preservation Comes First
The primary objective of risk management is capital preservation. Without capital, there is no opportunity to trade. A trader who loses 50% of their account needs a 100% return just to break even. This mathematical reality highlights why controlling losses is more important than chasing big gains.
Successful traders usually risk only a small percentage of their total capital on a single trade, commonly between 1% and 2%. This approach ensures that even a series of losing trades does not significantly damage the trading account. Preserving capital provides the psychological confidence to continue trading rationally rather than emotionally.
Position Sizing and Risk Per Trade
Position sizing is one of the most powerful risk management tools. It determines how many shares, contracts, or lots to trade based on account size and risk tolerance. Proper position sizing aligns the potential loss of a trade with predefined risk limits.
For example, if a trader has a capital of ₹10,00,000 and decides to risk 1% per trade, the maximum loss allowed per trade is ₹10,000. Based on the stop-loss distance, the trader calculates the appropriate position size. This systematic approach removes guesswork and emotional bias from trading decisions.
Ignoring position sizing often leads to overtrading and excessive exposure. Even a high-probability setup can fail, and oversized positions can turn small mistakes into catastrophic losses.
The Role of Stop-Loss Orders
A stop-loss is a predefined price level at which a losing trade is exited automatically. It acts as a safety net, limiting losses and protecting capital. Using stop-loss orders is not a sign of weakness but a mark of discipline and professionalism.
Effective stop-loss placement is based on market structure, volatility, and technical levels rather than arbitrary values. Stops placed too tight may result in frequent premature exits, while stops placed too wide may expose the trader to unnecessary losses. A well-planned stop-loss balances risk control with market behavior.
More importantly, traders must respect their stop-losses. Moving or removing a stop-loss due to hope or fear often leads to larger losses. Discipline in executing stop-losses is essential for consistent performance.
Risk-to-Reward Ratio
The risk-to-reward ratio compares the potential loss of a trade to its potential profit. A favorable risk-to-reward ratio ensures that even if a trader is right only a portion of the time, they can still be profitable.
For instance, a 1:2 risk-to-reward ratio means risking ₹1 to make ₹2. With this ratio, a trader can be profitable even with a win rate below 50%. Focusing on high-quality setups with positive risk-to-reward characteristics helps traders avoid overtrading and low-probability opportunities.
However, risk-to-reward should not be viewed in isolation. It must align with the trader’s strategy, market conditions, and realistic profit targets.
Emotional and Psychological Risk Management
Risk management is not only technical but also psychological. Fear, greed, overconfidence, and revenge trading are major contributors to trading losses. Emotional decisions often lead to breaking rules, increasing position sizes impulsively, and holding losing trades for too long.
Developing a trading plan and strictly following it reduces emotional interference. A clear plan defines entry rules, exit rules, risk limits, and trade management guidelines. Journaling trades and reviewing mistakes also helps traders identify emotional patterns and improve discipline over time.
Maintaining realistic expectations is another key aspect of psychological risk management. Markets do not provide consistent profits every day. Accepting drawdowns as part of the process helps traders stay calm and focused.
Diversification and Exposure Control
Diversification reduces risk by spreading exposure across different instruments, sectors, or strategies. Relying heavily on a single stock, asset class, or market condition increases vulnerability to unexpected events.
However, diversification should be meaningful. Holding multiple positions that are highly correlated does not significantly reduce risk. Traders must monitor overall exposure, especially during volatile periods, to avoid excessive concentration.
Adapting Risk to Market Conditions
Market conditions are dynamic. Volatility levels, liquidity, and trend strength change over time. Effective risk management requires flexibility. During high-volatility periods, reducing position size or tightening risk limits can protect capital. In stable market environments, traders may cautiously increase exposure within predefined limits.
Ignoring changing conditions and applying the same risk approach blindly can lead to unnecessary losses. Adaptability is a hallmark of experienced traders.
Conclusion
Managing trading risk is the backbone of sustainable success in financial markets. It is not about avoiding losses but about controlling them intelligently. Through capital preservation, proper position sizing, disciplined stop-loss usage, favorable risk-to-reward ratios, emotional control, and adaptability, traders can survive market uncertainty and grow steadily over time.
In the long run, consistent risk management matters more than finding the perfect strategy. Markets reward discipline, patience, and respect for risk. Traders who master risk management build resilience, confidence, and the foundation for lasting profitability.

Part 4 institutional Trading Why Traders Use Options
Option trading serves multiple purposes:
Speculation: Leveraged bets on price direction.
Hedging: Protecting portfolios against adverse price movements.
Income Generation: Earning premiums through option selling.
Risk Management: Structuring trades with defined risk and reward.
Because options can be combined in various ways, traders can design strategies suited for bullish, bearish, or sideways markets.

SOL downward target $112 and till $89Weekly Charts are still in downtrend
and Daily couldnt break above yet to form bullish structure.

Algo Trading & Backtesting1. What Is Algorithmic Trading?
Algorithmic trading (algo trading or automated trading) uses computer programs to execute buy and sell orders based on predefined rules. These rules are written using logic, mathematics, technical indicators, statistical models, or machine learning.
Key characteristics:
Speed: Algorithms execute trades in milliseconds.
Accuracy: Orders are placed exactly as coded, without emotional interference.
Consistency: Strategies run the same way every time.
Scalability: Algorithms can scan hundreds of stocks simultaneously.
Automation: Removes manual effort and human error.
Examples of algo rules:
Buy when the 50-day moving average crosses above the 200-day moving average.
Enter long if RSI < 30 and exit if RSI > 60.
Execute mean reversion when prices deviate from their statistical average.
Place a market-making order when bid-ask spread widens beyond a threshold.
Algo trading is used widely in equities, commodities, forex, crypto, futures, and options markets.
2. Why Algo Trading Matters
Algo trading is not just for institutions anymore. Retail traders now have access to powerful tools like NinjaTrader, TradingView Pine Script, Amibroker AFL, Python (Pandas, NumPy), Zerodha Streak, AlgoBulls, etc.
There are several advantages:
1. Eliminates emotions
Fear, greed, hesitation, revenge trading—algos remove them completely.
2. Enhances speed & efficiency
A computer can process multiple charts at once—no possibility for manual delays.
3. Reduces costs
Efficient execution reduces slippage, spreads, and missed opportunities.
4. Backtesting improves confidence
You know how your strategy performed historically before risking real capital.
5. Suitable for all market styles
Trending, scalping, intraday, swing trading, options strategies—algos cover everything.
3. Core Components of Algo Trading
1. Strategy Logic
The brain of the algorithm. Types include:
Trend-following strategies
Mean reversion models
Breakout systems
Arbitrage models
Options premium-selling/hedging algorithms
Machine learning predictive models
2. Data
The quality of the data determines the quality of your strategy.
Historical data (OHLC, volumes)
Real-time data (market feed)
Fundamental data
Tick/Orderbook data (advanced)
3. Programming Environment
Most common:
Python
TradingView Pine Script
Amibroker AFL
C++ (HFT level)
MetaTrader MQL
Proprietary platforms
4. Execution Engine
A platform that sends orders to the exchange via API.
5. Risk Management Module
Includes:
Stop-loss
Target
Position sizing (fixed lot, % of capital)
Max daily loss
Drawdown limits
Volatility filters
6. Monitoring & Optimization
Live dashboards help track:
Real-time P&L
Slippage
Latency
Execution errors
4. Backtesting – The Heart of Algo Trading
You cannot run an algorithm blindly. You must test it on past data to understand how it behaves. This process is called backtesting.
What Is Backtesting?
Backtesting is the simulation of a trading strategy on historical price data to evaluate its performance. It answers questions like:
Would the strategy have made money?
How much drawdown would it suffer?
What is the risk-reward ratio?
How consistent are returns?
How often does it win?
How Backtesting Works?
Step 1: Define the rules
Example strategy:
Buy when price closes above 20 EMA
Sell when price closes below 20 EMA
Risk 1% of capital per trade
Stop-loss = 1.5%
Target = 3%
Step 2: Select historical data
A minimum of:
2–5 years for intraday
5–10 years for swing
10–15 years for trend models
Step 3: Run the simulation
The software applies your rules on every candle historically.
Step 4: Analyze metrics
Some essential backtesting metrics:
✔ CAGR (Annual Return)
Measures yearly profit.
✔ Win Rate %
How many trades were profitable vs total bets.
✔ Profit Factor
Total gross profit ÷ total gross loss.
PF > 1.5 = Good; PF > 2 = Strong.
✔ Drawdown %
The maximum fall from peak equity.
Lower drawdown = safer strategy.
✔ Sharpe Ratio
Reward/risk ratio based on volatility.
✔ Average trade return
Shows how much each trade earns.
✔ Expectancy
Average win × win rate − average loss × loss rate.
Step 5: Optimize (carefully!)
Adjust parameters to improve performance, but avoid overfitting.
5. Types of Backtesting
1. Historical Backtesting
Runs strategy on past OHLC data.
2. Walk-Forward Testing
Split data into in-sample (training) and out-of-sample (testing).
3. Monte Carlo Simulation
Tests strategy performance across random variations.
4. Paper Trading / Forward Testing
Real-time simulation in live markets without real money.
6. Why Backtesting Can Mislead (Pitfalls)
Backtesting is powerful but dangerous if not done correctly.
1. Overfitting
Your strategy may perform well on history but fail in real markets.
2. Look-Ahead Bias
Using future data unknowingly, giving unrealistic results.
3. Survivorship Bias
Testing only stocks that survived, ignoring delisted ones.
4. Slippage & Transaction Costs
Real-world execution is worse than simulated execution.
5. Market Regime Changes
A strategy profitable during trending phases may fail during sideways markets.
Professional algo traders spend more time fixing biases than writing strategies.
7. Algo Trading Strategies Common in India
1. Trend-Following on NIFTY Futures
EMA crossover, Supertrend, Donchian breakout.
2. Options Selling Strategies
Short Straddle
Short Strangle
Iron Condor
Delta-neutral hedged selling
3. Mean Reversion in Bank Nifty
Price touches lower Bollinger Band → Buy.
4. Intraday Momentum
Breakout of previous day high/low.
5. Arbitrage Models
Cash–futures arbitrage, index arbitrage.
8. Tools & Platforms to Start Algo Trading
Beginner-Friendly
Zerodha Streak
Dhan Options Trader
Angel Algo
TradingView (Pine Script)
Intermediate
Python (using broker APIs)
Amibroker AFL
MetaTrader MQL
Advanced / Professional
QuantConnect
AlgoQuant
C++ HFT engines
Custom low-latency systems
9. Steps to Build a Profitable Algo Trading System
Step 1: Identify a market inefficiency
Find behaviors that occur consistently:
Monday gap filling
Tuesday volatility
Post-2:30 p.m. breakouts
Overnight momentum
Step 2: Create rules
Clear, unambiguous logic.
Step 3: Backtest
Use extensive and high-quality data.
Step 4: Evaluate metrics
Cut poor strategies early.
Step 5: Forward test
Test in real time without money.
Step 6: Deploy small capital
Scale only after long-term stability.
Step 7: Monitor & refine
Markets change → algos must evolve.
Conclusion
Algo trading and backtesting together form a powerful framework for systematic, disciplined, and scalable trading. Instead of relying on emotions or random decisions, traders build clear rules, test them against history, validate them in real-time, and automate execution to gain precision and consistency. With proper design, risk control, and continuous improvement, algorithmic trading can significantly enhance performance in equities, commodities, forex, indices, and options.
$SOL defended the 122–124 Double Bottom zone CRYPTOCAP:SOL defended the 122–124 Double Bottom zone and shot up from Bottom 2 to hit the neckline resistance at 143–144! The bounce came with improving volume, confirming buyers were positioned exactly at the base of the structure.
Now the chart is pressing against the same neckline that has capped every breakout attempt over the past two weeks. This is the key decision point: momentum either carries #Solana through 144 with strength, or we get another reaction that forces price back into the mid-range.
From here, partial take-profit into the neckline is a sensible approach, and the rest can trail only if we see a clean, strong close above 144. If price rejects again, the next high-probability area sits around 136–138.

$SOL is currently sitting right on top of its Double Bottom CRYPTOCAP:SOL is currently sitting right on top of its Double Bottom support zone (122–124) — a critical level that has acted as the base for every major bounce in the past two weeks.
Right now, the chart hasn’t broken down… but it’s sitting at the edge.
This makes the next move extremely important.
🔍 What We’re Seeing Now
Price is hovering above Bottom 2 support.
Consolidation is ongoing → market waiting for direction.
Volume decreasing → sign of compression before expansion.
Trendline resistance from 144 still intact.
This keeps CRYPTOCAP:SOL in a neutral but vulnerable state.
📉 If Support Breaks (Bearish Scenario)
If CRYPTOCAP:SOL loses 122, the entire double-bottom structure collapses.
Potential downside levels:
➡️ 118
➡️ 112
➡️ 105–108 (major liquidity zone)
A breakdown would confirm continuation of the current downtrend.
📈 If Support Holds (Bullish Scenario)
If buyers defend 122–124 again, CRYPTOCAP:SOL can build a strong reversal base.
Bullish confirmation triggers only after:
✔️ reclaiming 136
✔️ breaking above 144 (neckline of the pattern)
If these levels flip:
➡️ 151
➡️ 158–160
➡️ 172 (major bullish target)
📌 Summary
#SOLANA is in neutral territory, sitting at a critical decision point.
Hold 122 = bounce potential
Break 122 = bearish continuation
This is the key zone that will define the next major move. Stay sharp — volatility is loading. 🚦

SOLUSDT is in very crucial and discount price currently.. SOLUSDT is in very crucial and discount price currently..
it's supply is about to end and also coming to grab lliquidities.. then it may be fly

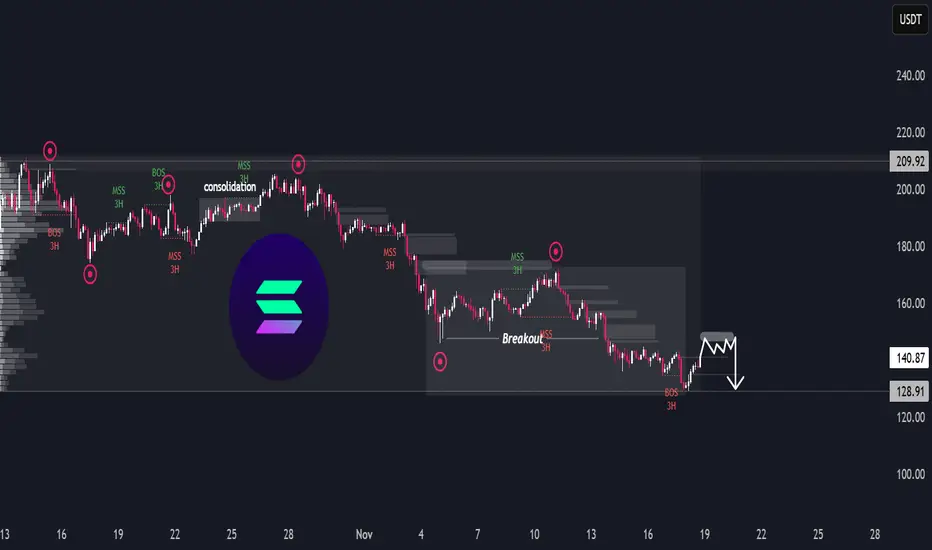
SOL/USDT – Downside LoadingSOL/USDT – Downside Loading
The chart shows a prolonged distribution phase followed by a steady macro decline, with multiple structure breaks confirming a persistent bearish flow. After the earlier consolidation in the upper range, each attempt to reclaim previous highs has been met with a shift in momentum, leading to progressive downside sequences.
The recent breakout from the lower range transitioned into continued weakness, indicating sellers remain in firm control. Despite short-term rebounds, the overall behaviour reflects a market that is unwinding previous demand zones rather than building new ones.
At the current level, SOL is forming a tight corrective pattern, suggesting price is building liquidity before the next directional move. Given the broader trend context, this type of compression typically precedes continuation rather than full reversal. The chart’s projection implies a potential liquidity sweep on the minor rally, followed by renewed downside pressure once short-term buyers are exhausted.
Overall, the environment still favours the bearish continuation scenario unless the market shows a decisive shift in character backed by sustained strength — something not yet present.
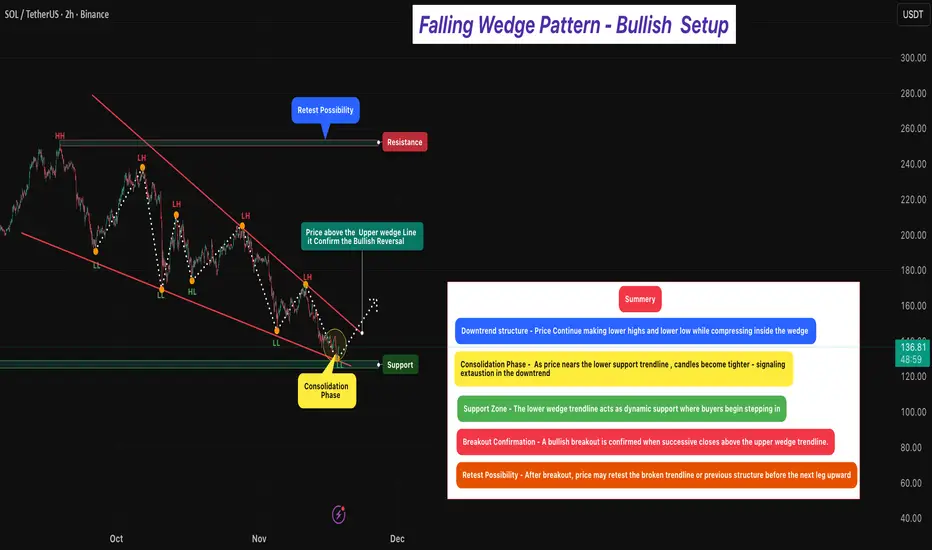
Falling Wedge Pattern - Bullish Setup 🔎 Overview [ /b]
The Falling Wedge Pattern is a bullish reversal setup that forms when price trades inside a narrowing downward channel — creating lower highs and lower lows that converge toward the bottom.
It typically appears after a downtrend, signaling that selling pressure is weakening and buyers may soon regain control.
As price descends within the wedge, the slope begins to reduce and volatility tightens, indicating seller exhaustion and early buyer accumulation near support.
Momentum shifts once price breaks and closes above the upper wedge trendline, confirming a potential bullish reversal.
⸻⸻⸻⸻⸻⸻⸻⸻⸻⸻⸻
📊 Chart Explanation
1️⃣ Downtrend Structure
Price continues forming Lower Highs and Lower Lows within the wedge.
This compression reflects weakening bearish momentum.
2️⃣ Consolidation Phase
As price approaches the wedge’s lower line, candles narrow — indicating reduced volatility, seller fatigue, and early buying activity.
This is often the early reversal zone.
3️⃣ Support Zone
The lower wedge boundary overlaps with a strong structural support area — where buyers repeatedly defend the lows, forming a demand zone.
4️⃣ Breakout Confirmation
A bullish reversal is confirmed when price breaks and closes above the upper wedge line.
This signals a clear momentum shift from sellers → buyers.
5️⃣ Retest Possibility
Post-breakout, price may retest the broken wedge or prior resistance area.
A successful retest adds conviction to the continuation move.
⸻⸻⸻⸻⸻ ⸻⸻⸻⸻⸻⸻
🟩 Summary
• Pattern Type → Falling Wedge (Bullish Reversal)
A narrowing downward structure that signals seller exhaustion and early buyer accumulation.
• Bias → Bullish After Breakout Confirmation
Momentum shifts only when successive candles close firmly above the upper trendline, confirming a true breakout.
• Trend Context → Formed After a Downtrend
Makes the reversal stronger and increases the probability of upside continuation.
• Market Psychology → Sellers Losing Strength
Lower highs are losing momentum, and buyers are defending lows aggressively.
⸻⸻⸻⸻⸻⸻⸻⸻⸻⸻⸻
⚠️ Disclaimer
📘 For educational purposes only.
🙅 Not SEBI registered.
❌ Not a buy/sell recommendation.
🧠 Purely a learning resource.
📊 Not Financial Advice.
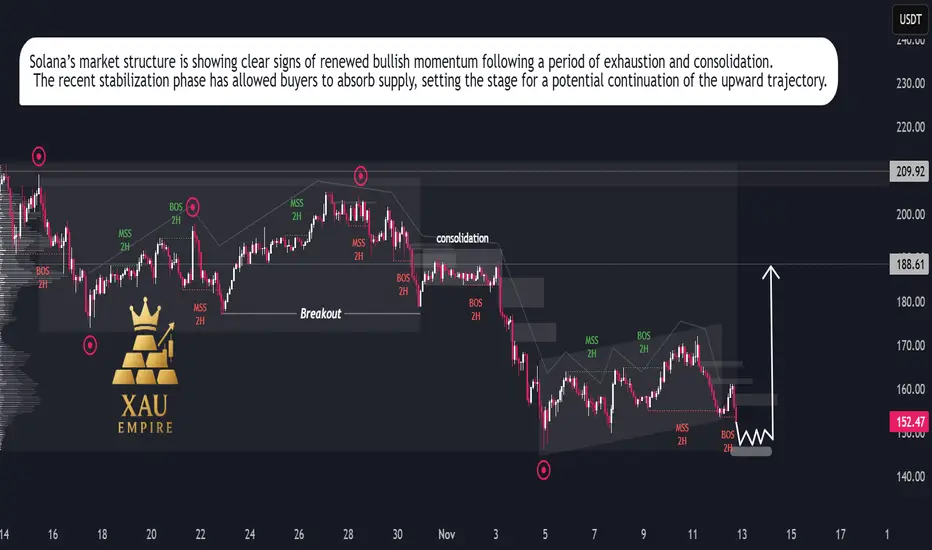
SOL/USDT – Bullish Momentum Rising, Rally Setup in ProgressSolana is showing renewed strength after an extended corrective phase, suggesting that the recent slowdown was a temporary reaccumulation rather than the start of a new downtrend. Price action has begun to stabilize, reflecting growing investor confidence and increasing participation from buyers at discounted levels.
Market flow indicates that selling pressure is fading, while buying volume has started to build up gradually. The recent structure reflects a healthy market rotation, where weaker hands are being replaced by strategic buyers positioning for the next expansion phase.
Momentum appears to be shifting in favor of the bulls, supported by consistent higher reactions after each dip and a clear compression pattern that often precedes strong directional movement. This behavior points toward a potential continuation of the broader uptrend, with expectations for renewed growth as market sentiment strengthens.
Overall, Solana’s current price behavior suggests the market is preparing for another bullish leg. As volatility contracts, the probability of an impulsive upside expansion increases, signaling that the next significant move is likely to unfold in favor of buyers.
Intraday Scalping Tips: Mastering the Art of Fast Profits1. What Is Intraday Scalping?
Scalping is a subset of intraday trading, but with a much shorter time frame. Instead of holding trades for hours, scalpers enter and exit positions within seconds or minutes. The goal is to capture tiny price movements, often ranging from 0.1% to 0.5%, multiple times a day.
For example, if a stock moves from ₹500 to ₹501, a scalper may book a quick profit and repeat the process across different stocks or price levels. Over the course of the day, these small gains can accumulate into substantial profits if managed properly.
However, because scalping involves high trading frequency, transaction costs, timing, and execution speed become critical factors.
2. The Psychology of a Scalper
Scalping is not just about strategy—it’s about mindset. A successful scalper must be calm under pressure, quick in decision-making, and emotionally detached from wins or losses.
Unlike swing traders, scalpers can’t afford to wait for a market to “come back.” They must accept small losses quickly and move on to the next trade. Emotional control and discipline are therefore more important than technical knowledge alone.
Key psychological traits include:
Speed and decisiveness – No hesitation when an entry or exit signal appears.
Emotional neutrality – Avoid greed after profits or frustration after losses.
Discipline – Follow your plan and respect stop-loss limits, no matter what.
3. Essential Tools for Scalping
To succeed as a scalper, you need a professional setup that allows for precision and speed:
Fast Internet Connection: Delays of even a few seconds can affect profits.
Reliable Trading Platform: Choose brokers and platforms with low latency and fast execution (like Zerodha, Angel One, or Upstox for Indian markets).
Direct Market Access (DMA): Helps execute orders directly without delays.
High-Quality Charting Software: For real-time technical analysis (e.g., TradingView).
Level 2 Data / Market Depth: To understand bid-ask spreads and liquidity levels.
Having these tools in place ensures your decisions are based on real-time data and executed without technical lag.
4. Choosing the Right Stocks for Scalping
Not every stock is suitable for scalping. The best scalping stocks share certain characteristics:
High Liquidity: The stock should have high trading volume so you can enter and exit quickly.
Tight Spreads: A small bid-ask spread ensures that transaction costs remain low.
Volatility: Moderate price movement ensures enough opportunities without erratic swings.
Popular Stocks: Large-cap or index-based stocks like Reliance Industries, HDFC Bank, or Infosys are often good choices due to consistent volume.
Scalpers usually stick to 3–5 familiar stocks daily, mastering their price behavior instead of chasing every trending name.
5. Technical Indicators That Work for Scalping
Scalping relies heavily on technical indicators for quick decision-making. Some of the most effective tools include:
Moving Averages (MA): Short-term MAs like 5-EMA and 9-EMA help identify quick trends and crossovers.
VWAP (Volume Weighted Average Price): Acts as a dynamic support and resistance level; many institutional traders use it for intraday benchmarks.
Relative Strength Index (RSI): Helps identify overbought or oversold conditions (ideal range for scalpers: 5–15 RSI periods).
Bollinger Bands: Indicate volatility and possible breakout zones.
Volume Analysis: Volume spikes often precede major price movements—critical for timing entries.
The best scalpers combine 2–3 of these tools rather than cluttering charts with too many indicators.
6. Entry and Exit Strategies
Scalping thrives on timing and precision. Here are a few commonly used strategies:
a. Breakout Scalping
Scalpers wait for the price to break above resistance or below support with strong volume confirmation. Entry happens immediately after the breakout, and exits occur once quick profit targets (0.3%–0.5%) are achieved.
b. Range Scalping
When markets move sideways, scalpers buy near the lower boundary of the range and sell near the upper boundary. Stop-losses are placed just beyond the range.
c. Momentum Scalping
In this method, traders ride short bursts of momentum caused by news, earnings releases, or large market orders. Scalpers jump in with the trend and exit at the first sign of weakness.
Regardless of the method, stop-losses must be placed immediately—typically 0.25%–0.5% below the entry price—to control risk.
7. The Importance of Risk Management
Scalping without risk management is gambling. Since gains are small, even a few large losses can wipe out profits. Effective risk control ensures survival and consistency.
Position Sizing: Don’t risk more than 1%–2% of total capital per trade.
Tight Stop-Loss: Always use stop-loss orders to cap losses quickly.
Avoid Overtrading: Set a limit on the number of trades per day. Quality over quantity.
Keep Costs in Check: Brokerage and taxes can eat into profits. Use low-cost brokers.
Successful scalpers often say: “Protect your capital first; profits will follow.”
8. Trading Discipline and Routine
Consistency is key in scalping. Having a structured trading routine ensures focus and control.
Morning Preparation:
Review pre-market news, global cues, and technical setups.
Identify your watchlist of 3–5 liquid stocks.
Mark key intraday support and resistance zones.
During Trading Hours:
Trade only within your strategy and avoid impulsive trades.
Monitor volume surges and price reactions near key levels.
Book profits quickly; don’t aim for large moves.
Post-Market Review:
Analyze your trades to identify mistakes or strengths.
Maintain a journal recording entry/exit points, emotions, and results.
This continuous improvement mindset separates professional scalpers from amateurs.
9. Avoid Common Scalping Mistakes
Even experienced traders can fall into common traps. Be aware of these:
Over-leveraging: Using too much margin increases the risk of large losses.
Ignoring News Events: Sudden announcements can cause unexpected volatility.
Chasing Trades: Don’t enter trades just because of missed opportunities.
Neglecting Transaction Costs: Frequent trading magnifies brokerage and taxes.
Lack of Patience: Waiting for the right setup is part of the discipline.
Remember, in scalping, one bad trade can ruin ten good ones.
10. Building a Winning Scalping Mindset
Success in scalping is not about winning every trade—it’s about consistency. A skilled scalper understands that small, steady gains compound over time.
Focus on process over profit:
Stick to your rules.
Accept small losses gracefully.
Never revenge-trade after a loss.
Stay humble—markets reward patience and discipline.
Professional scalpers often compare their work to that of a surgeon: precise, focused, and unemotional.
Conclusion
Intraday scalping is an art that blends speed, strategy, and discipline. It may not suit everyone—its fast pace and emotional intensity demand exceptional control and focus. However, for those who master it, scalping can be one of the most consistent and lucrative trading styles.
By understanding market micro-movements, managing risk, and following a structured trading plan, traders can turn tiny price fluctuations into meaningful daily income. In the world of scalping, success doesn’t come from predicting the market—it comes from reacting to it faster and smarter than everyone else.
Solana Price Action Turns BearishSolana’s market structure shows a gradual weakening of bullish momentum after an extended upward phase earlier in the month. The asset experienced a breakout that temporarily fueled optimism among traders, but recent sessions indicate a loss of strength as sellers began to dominate. The volume profile suggests that market participants are shifting focus from accumulation to potential distribution, reflecting caution ahead of broader market developments.
Price movements over the past few weeks show that Solana has transitioned from impulsive bullish waves into a corrective environment. This phase reflects uncertainty and potential repositioning by large holders. The consolidation seen mid-cycle indicates a period of balance before a directional move resumes. Current activity implies that short-term liquidity adjustments are occurring, and volatility may expand in the coming sessions.
Market sentiment remains sensitive, with investor confidence depending largely on macroeconomic flows and digital asset liquidity trends. Solana’s performance continues to mirror broader crypto risk appetite, where speculative behavior is being tempered by cautious profit-taking. If momentum continues to decline, extended corrective movement could unfold as participants await new catalysts.
Overall, the report indicates that Solana is entering a controlled phase of distribution where institutional participants may be preparing for another medium-term adjustment in valuation.

Part 1 Master Candle Stick PatternOption trading is a popular part of the financial market that allows investors to buy or sell the right—but not the obligation—to trade a stock or asset at a specific price within a certain time period. It’s a flexible and powerful tool used by traders to make profits, hedge risks, or plan future investments.
What is an Option?
An option is a contract between two parties — the buyer and the seller. It gives the buyer the right to buy or sell an asset (like a stock) at a fixed price, known as the strike price, before a set date called the expiry date. There are two main types of options:
Call Option – Gives the holder the right to buy an asset at the strike price.
Put Option – Gives the holder the right to sell an asset at the strike price.

SOL/USDT (1H timeframe)...SOL/USDT (1H timeframe):
Here’s a clear technical breakdown 👇
🧭 Chart Overview:
Current price: around $200.40
Trend: Uptrend, but showing short-term pullback
Support area: $190 – $195
Resistance area: $205 – $210
🔍 Key Observations:
The ascending trendline is acting as dynamic support.
Price recently rejected near the $210 resistance zone and is pulling back toward the trendline and Ichimoku cloud.
The target points marked on my chart suggest downside retracements if support breaks.
---
🎯 Target Levels:
If price stays above the trendline/support → bullish continuation:
Target 1: $207
Target 2: $212
Target 3: $220 (major breakout target)
If price breaks below the trendline/cloud support → bearish correction:
Target 1: $195 (short-term support / first target point)
Target 2: $188 (lower target zone marked on chart)
Target 3: $180 (major downside target if correction deepens)
---
⚠ Summary:
📈 Bullish scenario: Hold above $198 → move to $207–$212.
📉 Bearish scenario: Break below $198 → drop to $195 → $188.

$SOL is showing a classic Head & Shoulders formation on the 1HrCRYPTOCAP:SOL is showing a classic Head & Shoulders formation on the 1-hour chart, a potential early signal of a short-term trend reversal if neckline support gives way.
🔸Left Shoulder: around $198
🔹Head (Peak): near $205
🔸Right Shoulder: formed close to $202
🔹Neckline Support: currently at $192 – $193
Price is now hovering just above that neckline — a critical pivot area.
🔹 Support Zones
$191 (Neckline) → crucial short-term support.
$188 → next reaction zone if neckline fails.
$177 – $180 → full measured move target if breakdown confirms.
🔹 Resistance Zones
$198 – $200 → short-term recovery resistance.
$205 → pattern invalidation if price reclaims and holds above.
If #SOL breaks below $191 with volume confirmation, a quick drop toward $185–$180 looks likely.
If bulls defend the neckline and push back above $200, it could negate the pattern and retest $205+.
📉 Bearish bias short-term while below $193
📈 Bullish recovery only above $200
🎯 Breakdown target: $180 zone
Stay sharp — #Solana is at a make-or-break neckline, and volatility could pick up fast! 🎯

Part 7 Trading Master ClassOption Greeks: Measuring Sensitivity
Professional traders use “Greeks” to assess how option prices change with market variables:
Delta (Δ): Measures the rate of change in option price relative to the underlying asset’s price.
Gamma (Γ): Measures how Delta changes with price movement.
Theta (Θ): Represents time decay – how much value an option loses daily as expiry nears.
Vega (ν): Sensitivity to volatility changes.
Rho (ρ): Sensitivity to interest rate changes.
Understanding Greeks helps traders manage portfolio risks and design advanced strategies.

[SeoVereign] SOLANA BEARISH Outlook – October 27, 2025Hello everyone,
This idea presents a bearish (short) outlook on Solana as of October 27.
Currently, Solana has entered a short-term overheated zone,
and we are beginning to observe a gradual inflow of selling pressure.
First Basis — (DEEP) GARTLEY Pattern
Solana is currently located within the PRZ (Potential Reversal Zone) of a (DEEP) GARTLEY pattern.
This zone is typically recognized as the terminal phase of a short-term upward wave,
where a trend reversal to the downside often occurs due to overbought conditions.
Second Basis — WAVE.M = WAVE.N × 0.786
The ongoing M-wave has formed approximately 78.6% of the length of the previous N-wave,
which represents a classic reversal structure commonly observed within the GARTLEY pattern.
Therefore, entering a short position within this range is considered technically valid.
Accordingly, the average target price is set around 184.97 USDT.
Depending on future price developments,
I will provide further updates on refinements to this idea and position management strategies.
Thank you for reading.

SOLANA 27,560% CYCLE IS ABOUT TO REPEAT - $9,200 TARGET BY 2029 SOLANA 27,560% CYCLE IS ABOUT TO REPEAT - $9,200 TARGET BY 2029
Previous Bull Cycle Metrics:
1️⃣ Duration: 1,492 days
2️⃣ % Gain: 27,560%
3️⃣ Price: $1 → $295
Now here's where it gets CRAZY...
IF we get a healthy retracement to the golden pocket ($60-$35), and IF the fractal repeats:
1️⃣ Bottom: $60-$35
2️⃣ Same % gain: 27,560%
3️⃣ Same timeframe: 1492 days (Feb 2029)
This is Wyckoff accumulation into parabolic expansion.
The risk/reward is GENERATIONAL
Bookmark this. Screenshot this. Thank me in 2029.
This is just my math based on past fractals & returns. Not financial advice - DYOR

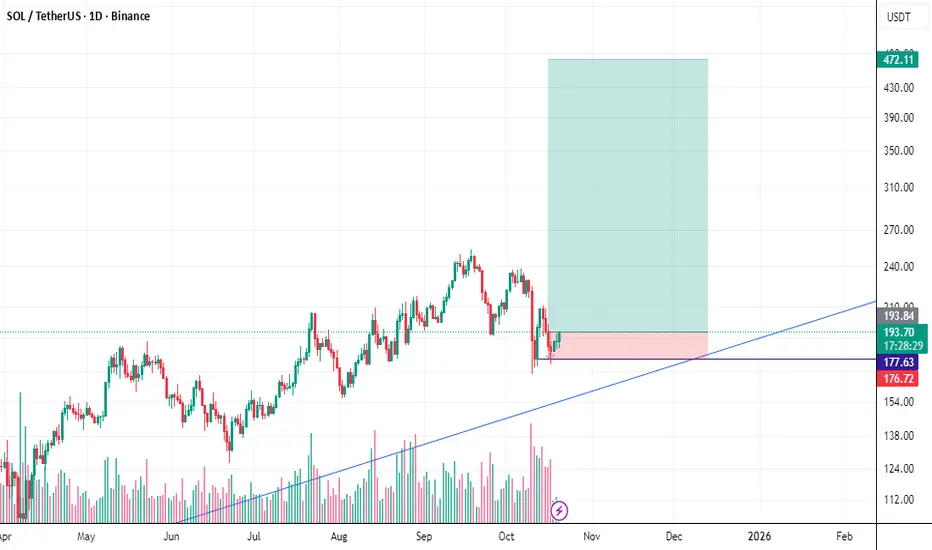
SOLANA make double from Here....?Consensus Outlook: Most forecasts point to $250–$400 by end-2025 (a 33–112% gain), with 2026 extending to $300–$500 (60–165% from now). This suggests a double is realistic by mid-2026, especially if Bitcoin's post-halving rally spills over. Bullish catalysts include:
ETF Approvals: Odds near 100% for spot SOL ETFs by late 2025, per analysts—could spark a 50–80% surge to $290–$345 on news.
Technical Setup: SOL is forming a multi-year ascending triangle and range breakout around $160–$200. A close above $230–$260 could target $290–$520 quickly. Recent double-bottom at $172 signals rebound potential to $220+.
Ecosystem Strength: DEX volumes surpassing Ethereum, plus DeFi/NFT growth, position SOL for outperformance.
Bearish Risks: If it fails to hold $180, a drop to $140–$160 is possible amid broader market corrections or network outages. Sentiment is mixed (Fear & Greed at 29), with only 40% green days recentl
SOLUSDT is for sell side in short termSOLUSDT if closed below 185.35 then only we can plan for sell side up to 182.35. We can book some qty at 184.35 as TGT 1 . After hitting TGT 1 we can trail SL to 185 and wait for 182.35
