Solana Ready for Bullish ContinuationSolana demonstrates a constructive market posture with evidence of renewed accumulation following its recent corrective phase.Price activity indicates that buying momentum is gradually strengthening as liquidity continues to shift from weak hands into strategic positioning.The market structure shows improving stability,with compression patterns hinting at an impending expansion cycle.Sustained absorption near recent lows underscores growing institutional participation,reinforcing the probability of continued upward repricing.Trading volume remains consistent,reflecting controlled demand rather than speculative inflow.The overall market tone supports a constructive bias,with expectations aligning toward a progressive recovery phase and potential continuation of the broader bullish trajectory.
Market insights

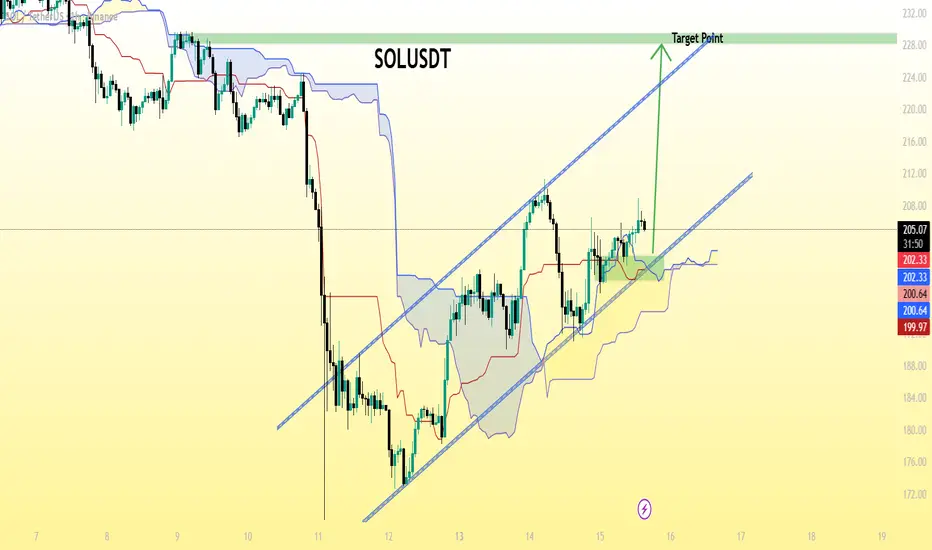
SOL/USDT chart pattern..SOL/USDT
The current price is around 205.5 USDT.
There’s a clear ascending trendline (blue line).
A breakout setup is indicated, with a marked “Target Point” near the top of the chart.
That target level appears to be around 230 USDT — the horizontal green line my labeled “Target Point.”
✅ Summary:
Current price: ≈ 205.5
Target price: ≈ 230 USDT
Upside potential: about +12% from the current level.
⚠ Note: Watch for support around 200–202 USDT (the Ichimoku cloud zone). If SOL holds that level, continuation toward 230 looks likely. A breakdown below the trendline could invalidate the move.
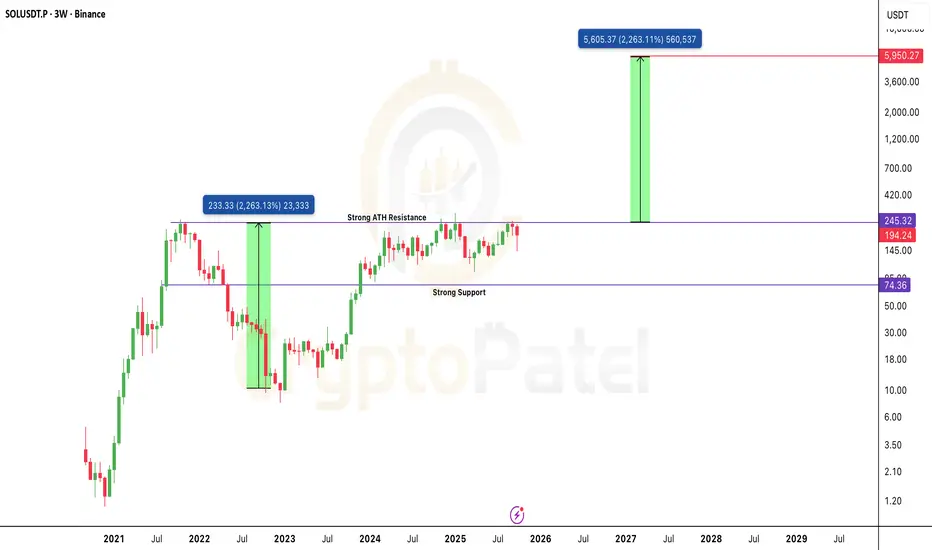
The Chart That Could Send $SOL to $6,000: Cup & Handle on 3W TFThe Chart That Could Send CRYPTOCAP:SOL to $6,000: Cup & Handle on 3W Timeframe
Solana is shaping one of the cleanest Cup & Handle patterns on the 3-Week chart, a formation that often signals the start of a massive long-term rally.
Technical Structure
🔹 Cup formed: $260 → $8 → back to $245 — a perfect rounded recovery base.
🔹 Handle forming: Price consolidating between $140–$245, building pressure before breakout.
🔹 Breakout trigger: Clean close above $245 (ATH zone) will confirm the move.
🔹 Targets:
– First target: $480–$500
– Extended target: $2,000–$6,000 if momentum mirrors the last 2200% run.
🔹 Major Support: $74–$90 zone.
What this really means: Solana is quietly preparing for its next macro expansion phase.
A confirmed breakout above ATH could kickstart one of the strongest alt rallies of this cycle.
Bias: Bullish on breakout confirmation
Timeframe: 3W / Long-Term Swing Setup
Plan: Watch $245 zone closely, breakout with volume = game on.
Note: NFA & DYOR
Part 1 Candle Stick PatternKey Terminology in Options
Before diving deeper, understanding these basic terms is essential:
Strike Price: The price at which the option can be exercised.
Premium: The price paid by the buyer to purchase the option.
Expiry Date: The date on which the option contract ends.
In the Money (ITM): When exercising the option gives a profit (e.g., a call option when the stock price is above the strike price).
Out of the Money (OTM): When exercising the option gives a loss (e.g., a call option when the stock price is below the strike price).
At the Money (ATM): When the stock price and strike price are almost the same.
Underlying Asset: The financial instrument (like a stock, index, or currency) on which the option is based.

SOL | Network Strength Meets Market MomentumSolana (SOLUSDT) continues to show resilience as both technical and fundamental factors align for potential upside. On the technical side, the market has completed a controlled correction phase, suggesting liquidity buildup below recent lows. The structure remains bullish, with increasing volume and price stability hinting that buyers are regaining control. Fundamentally, Solana’s network growth and strong developer activity have reinforced investor confidence, supported by rising on-chain activity and ecosystem expansion in DeFi and NFTs. This combination of solid fundamentals and technical structure indicates the possibility of another bullish leg, with SOL positioning itself for a gradual climb toward the $240–$250 range in the near term.

Part 1 Intraday Master ClassIntroduction to Option Trading
Option trading is one of the most fascinating and flexible areas in the financial markets. Unlike traditional stock trading — where you buy or sell shares directly — options give you the right but not the obligation to buy or sell an underlying asset (like a stock, index, or commodity) at a fixed price within a specified time.
Think of options as financial contracts that allow traders and investors to speculate on price movements, hedge existing positions, or earn income — all without actually owning the underlying asset.
For example, if you believe Reliance Industries’ stock will go up, instead of buying the shares directly, you can buy a call option — a cheaper contract that benefits if the stock price rises. Conversely, if you expect a fall, you can buy a put option.
The main advantage? Leverage. You control a large position with a relatively small investment. But this also means risk — because options lose value as time passes or if prices move against your expectation.

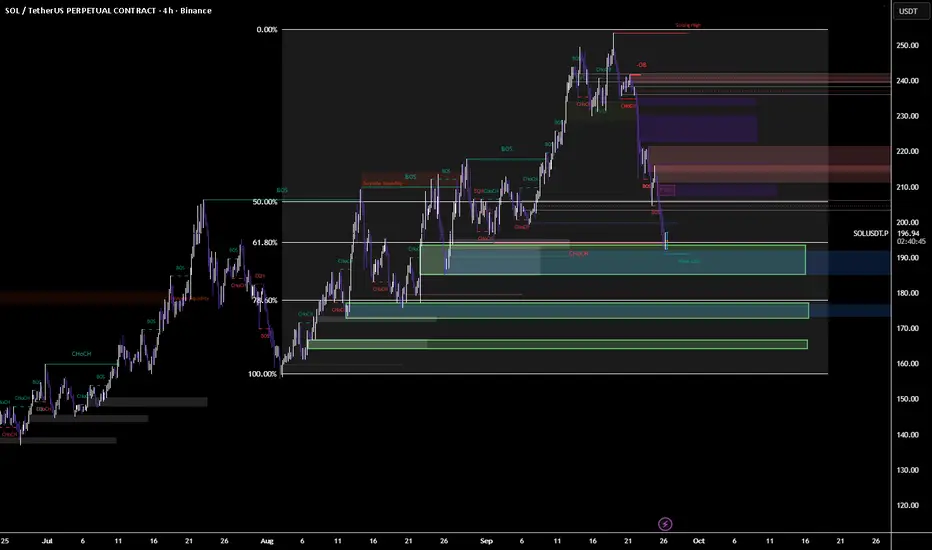
SOL Ready TO Ignite from Demand - Eyeing $240 Supply “SOL Ready to Ignite from Demand – Eyeing $240 Supply”
📌 Description:
Solana swept liquidity into the $192–195 demand zone and is showing signs of strength. As long as $185 holds, bulls may drive price into the $210–240 supply zones. First target sits at $210 (FVG close), with higher objectives at $225 and $240. If demand fails, watch for a rejection short from $210.
Long Setup (Buy Idea)
Entry Zone: $192 – $195 (current demand + weak low + 61.8 retracement support)
Stop Loss (SL): $185 (below demand zone + liquidity sweep area)
Take Profit (TP):
TP1: $210 (FVG imbalance zone)
TP2: $225 (OB resistance zone)
TP3: $240 (supply zone / strong high)
⚖️ Risk–Reward: Around 1:3 to 1:4 if TP2 or TP3 hits.
🔴 Short Setup (Sell Idea, only if rejection occurs)
Entry Zone: $210 – $215 (FVG imbalance / supply)
Stop Loss (SL): $222 (above imbalance zone)
Take Profit (TP):
TP1: $195 (back to current demand)
TP2: $180 (major demand below)
⚖️ Risk–Reward: Around 1:2 to 1:3.
📌 Bias: Currently, price tapped demand and bounced — so long setup looks stronger unless $185 breaks.
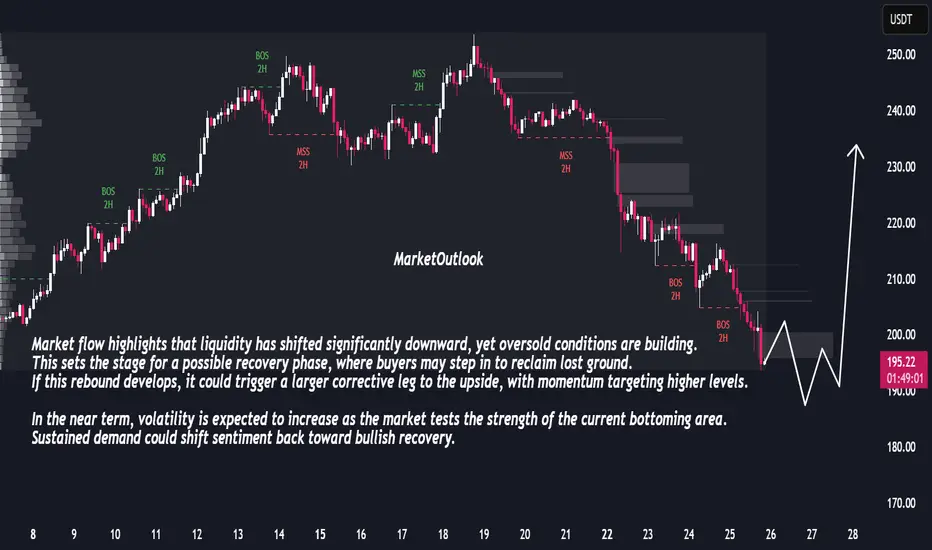
Bullish Reversal Ahead: Market Prepares for Sharp RecoveryThe market has been under consistent selling pressure, with a clear sequence of bearish breaks in structure confirming downside control. Price has now entered a zone where momentum shows signs of slowing, suggesting potential exhaustion in the recent decline. The sharp extension lower indicates that sellers may be reaching a short-term limit, creating conditions for a corrective rebound.
Market flow highlights that liquidity has shifted significantly downward, yet oversold conditions are building. This sets the stage for a possible recovery phase, where buyers may step in to reclaim lost ground. If this rebound develops, it could trigger a larger corrective leg to the upside, with momentum targeting higher levels.
In the near term, volatility is expected to increase as the market tests the strength of the current bottoming area. Sustained demand could shift sentiment back toward bullish recovery.
Solana Price Forecast | SOLUSDT Market OutlookSOLUSDT has completed a strong upward cycle and is now unwinding through a structured retracement. This phase is not showing disorderly selling but rather a controlled reset, where liquidity is being cleared to prepare for the next expansion.
The chart reflects a market that is cycling through accumulation, breakout, and pullback phases with consistency. Current downside movement is shaping a foundation zone that could serve as the springboard for renewed upward momentum.
Overall, the asset is displaying a constructive trajectory: corrections are functioning as fuel rather than weakness, pointing toward continuation of its broader growth path once this reset stabilizes.

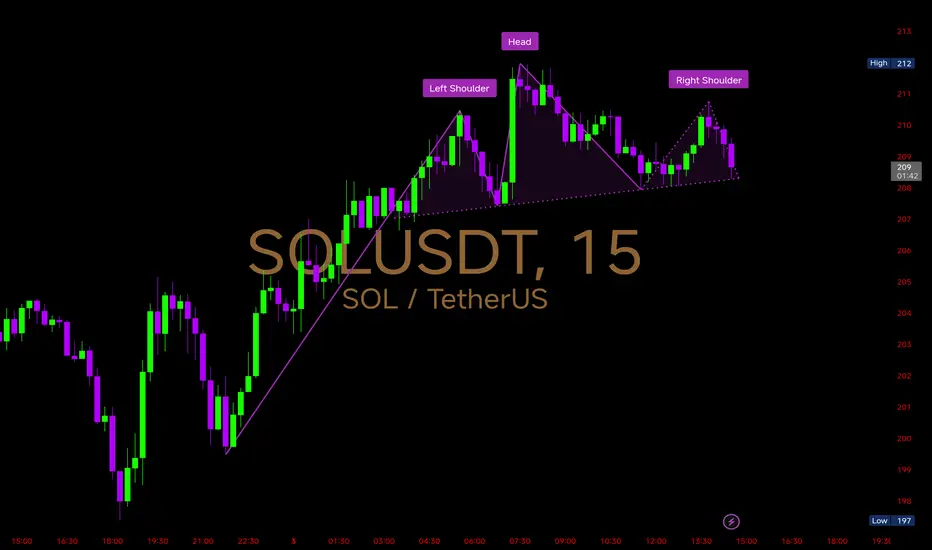
$SOL 15mins Chart Analysis CRYPTOCAP:SOL 15mins Chart Analysis
A Head & Shoulders pattern has formed with the left shoulder near 210, head at 212, and right shoulder around 211.
Key Technical Levels
Neckline Support: Around 208 – if this breaks decisively, we could see stronger bearish momentum.
Immediate Resistance: 210–212 (right shoulder + recent high). A breakout above invalidates the bearish pattern.
Downside Targets: If the neckline fails, price could test 205 → 202 → 197 support zones.
Bullish Case: Sustaining above 212 would flip the structure invalid, pushing price back into 215–220 zone.
Right now, #SOLANA is at a critical point – holding above the neckline keeps bulls alive, but losing it confirms a bearish breakdown.
Solana BUY nowSonala so good to buy
Fibonaci indicator
Top 10 coin crypto market cap has been sizeway a long time. And now run to pamp
Buy and wating 281$ to sell.
Good luck all!

Sol 1 Pending Market Crash so wait for thisSol 1 Pending Market Crash so wait for this
Sol 1 Pending Market Crash so wait for thisSol 1 Pending Market Crash so wait for thisSol 1 Pending Market Crash so wait for thisSol 1 Pending Market Crash so wait for thisSol 1 Pending Market Crash so wait for thisSol 1 Pending Market Crash so wait for thisSol 1 Pending Market Crash so wait for this
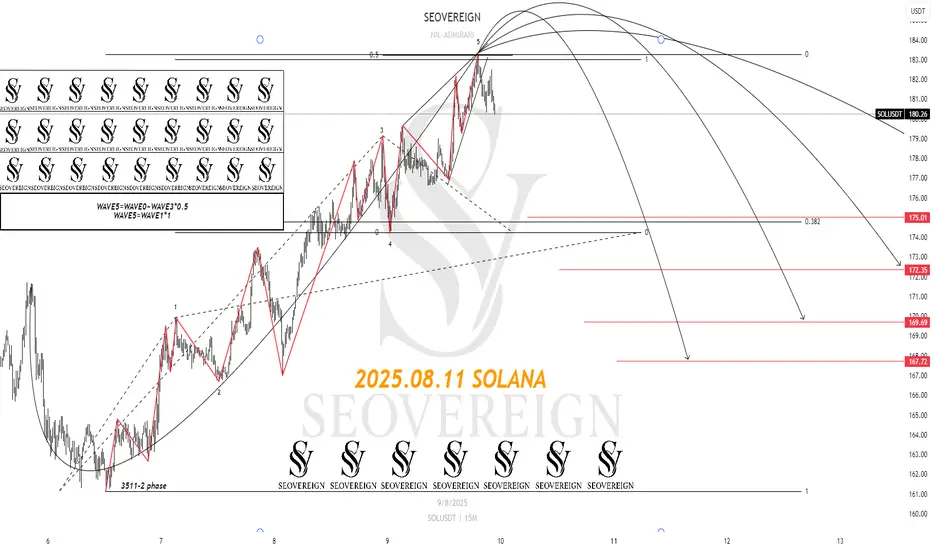
[SeoVereign] SOLANA BULLISH Outlook – August 11, 2025Recently, Solana’s price movement has been showing a very classic Elliott Wave pattern.
Based on this, I would like to present a bearish outlook this time.
The basis for this idea is as follows:
Wave 5 = 50% of the length of Waves 0–3
Wave 5 = equal length to Wave 1 (1:1 ratio)
In addition, the fact that Wave 5 is forming an ending diagonal pattern strongly suggests the possibility of a decline.
Please refer to the chart for more details.
Accordingly, the first target price has been set at 175 USDT.
I plan to continue updating this idea as the movement unfolds.
Thank you.
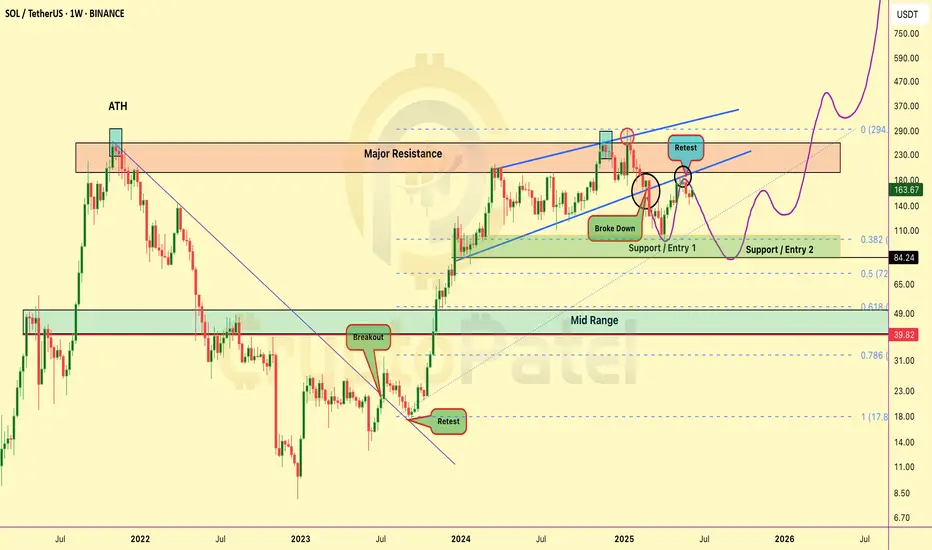
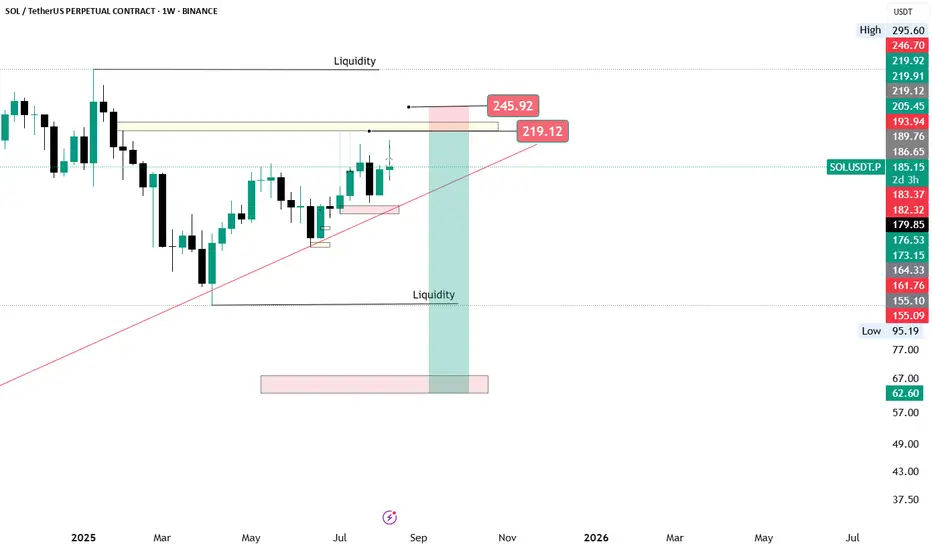
SOL/USDT weekly chart1. Price Structure & Break of Structure (BOS)
• The chart shows a clear break of structure:
• Price has broken above the previous lower high formed during the last downtrend (~$170–$175 zone).
• This suggests a shift from bearish to bullish market structure on the weekly timeframe.
• Current price: $178.97 — retesting the broken structure zone.
• Major resistance: ~$200 (historical rejection area).
• Major support: ~$150–$155 zone (recent higher low + strong buying interest).
⸻
2. Volume
• Volume appears relatively low compared to the large green bars seen during the late 2023–early 2024 rally.
• A breakout above $200 will require higher-than-average volume to confirm buyer commitment.
⸻
3. RSI (14 close)
• Currently around 55–60, which is in the neutral-to-bullish zone.
• RSI has been making higher lows, aligning with bullish momentum.
• No overbought conditions yet — room for upward movement.
⸻
4. MACD (12,26 close)
• MACD line crossed above signal line recently, signaling bullish momentum.
• Histogram turning positive, indicating increasing bullish pressure.
• Still in early stages of an uptrend cycle from a MACD perspective.
⸻
5. Key Takeaways
• Market Structure: Bullish shift confirmed on the weekly after BOS.
• Momentum: RSI & MACD both show strengthening bullish conditions.
• Caution: $200 remains a key psychological and technical resistance — could trigger profit-taking.
• Bullish Scenario: If $200 breaks with strong volume, next targets could be $240, then $260+.
• Bearish Scenario: If price fails at $200 and closes below $170, could retest $150 support.

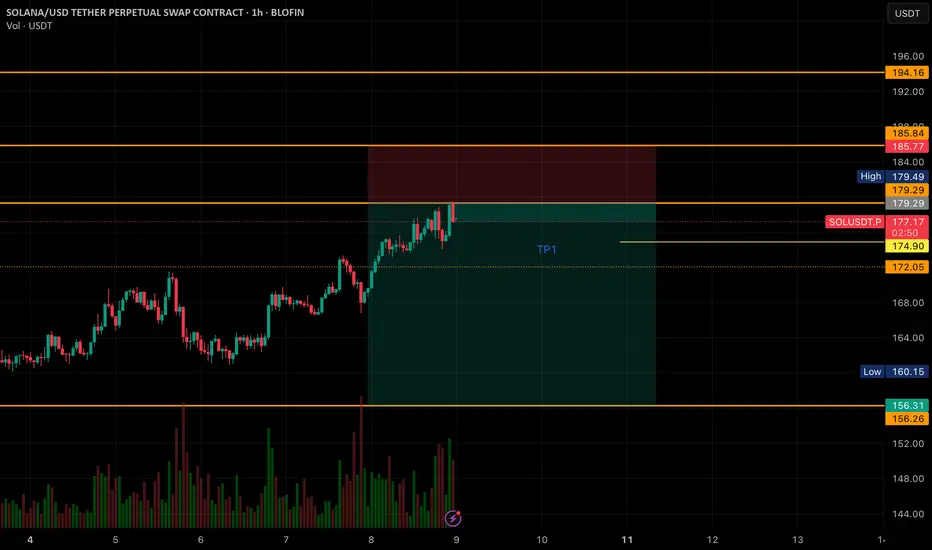
SOLANA CHART For shorts📉 SOL/USDT - Short Setup (1H TF)
Price has tapped into a significant resistance zone around $179–$185, where it faced immediate rejection. This zone aligns with multiple supply levels and previous price reaction areas. The current rejection hints at a possible short-term reversal or retracement.
🔻 Entry: $179.29 (resistance rejection)
🎯 Target 1 (TP1): $174.90
🛑 Stop Loss: $185.77
📊 Risk/Reward Ratio: Favorable (~1:2)
🔍 Technical Highlights:
• Strong bearish rejection from the resistance zone.
• Volume spike indicates potential exhaustion of buyers.
• Clean structure: potential lower high formation after a strong bullish leg.
• Break below $174.90 may open room for deeper retracement toward $172.05 or even $160.15.
⚠️ Notes:
• Monitor BTC for correlation.
• Watch price behavior near TP1 – if it consolidates or holds support, consider partial profit booking.
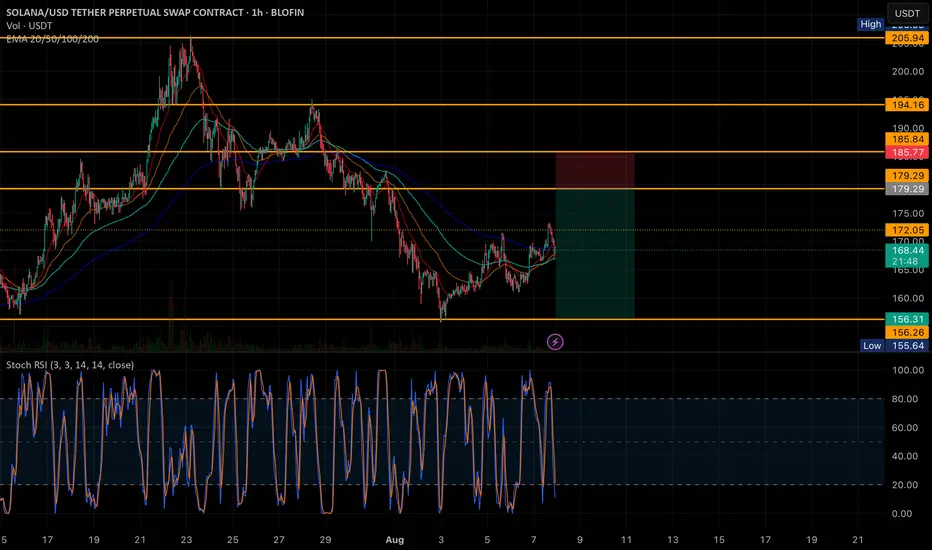
Sol short chartExpecting some upside move on Sol if holds this level.
But Sol need to break first 172 level
I will dca this trade from 172
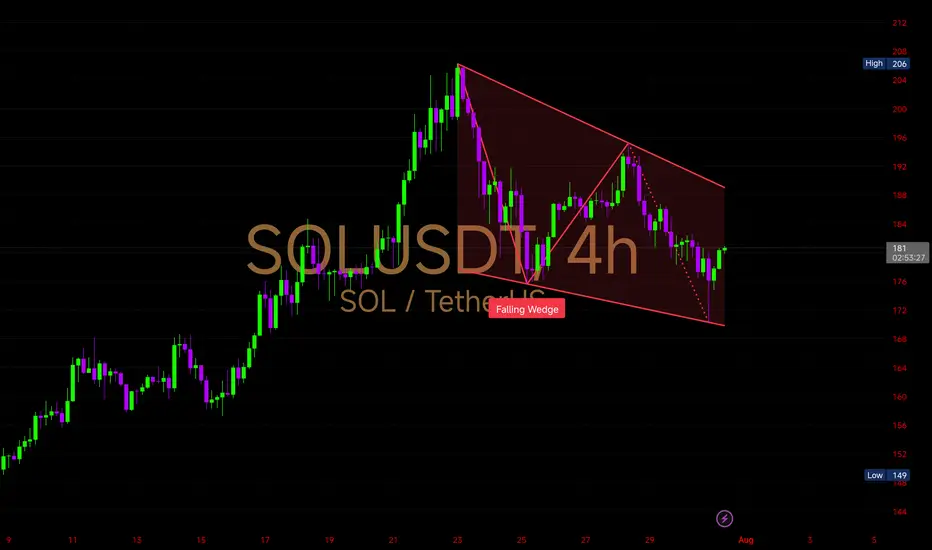
$SOL's 4-hour chart shows a Falling Wedge pattern
BINANCE:SOLUSDT
CRYPTOCAP:SOL 's 4-hour chart shows a Falling Wedge pattern—get ready for a bullish breakout! 🚀
• Falling Wedge, sloping downward with converging trendlines
• Price has respected both upper and lower bounds of the wedge with multiple touches
• SOLANA corrected from a high of $206 down to the wedge’s base near $174-$176
Latest candle shows buying pressure at the wedge support, hinting at a potential bounce
Support Zone: $174 → $176 (bottom of the wedge)
Resistance to Watch: $184 (upper wedge line), followed by breakout level at $188
Breakout Confirmation: Clean close above $188 on solid volume
📈 Probable Scenarios:
Bullish: Breakout from the wedge could lead to a move back toward $195-$200
Bearish: Rejection at upper wedge line could push price back to test $174 again
Wedge formations after extended rallies often act as bullish continuation patterns. If momentum picks up, CRYPTOCAP:SOL could trigger a short squeeze rally above the $190 mark.
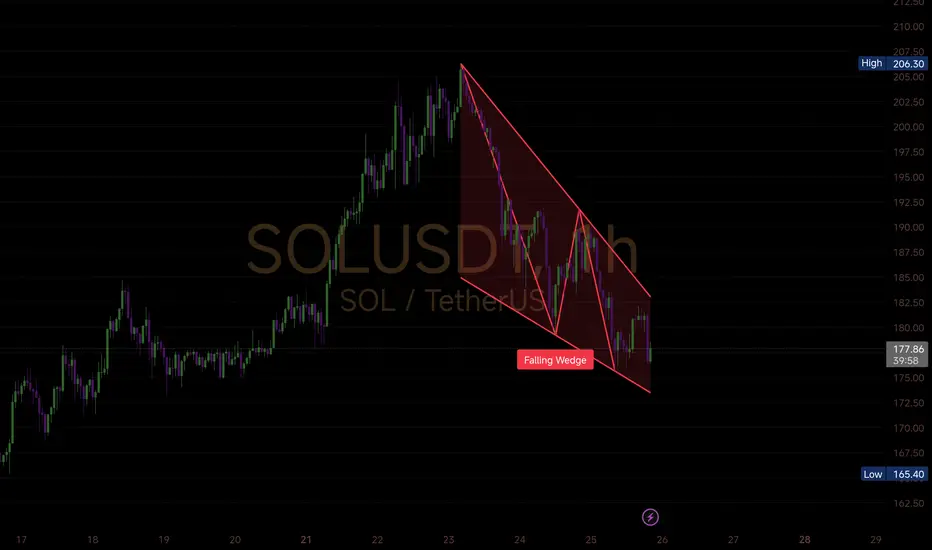
$SOL has printed a falling wedge, a classic bullish reversalBINANCE:SOLUSDT
CRYPTOCAP:SOL has printed a falling wedge, a classic bullish reversal setup, after correcting from the recent high near $206.
🔻 Price compressed inside descending resistance and support lines
🔄 Volume faded – typical in wedge ends
⚡ Breakout potential above $183–185 zone
🟢 Support Zone: $175 – $178
🔴 Resistance Zone: $184.5 – $188
🔼 Breakout Confirmation: Above $188 with volume spike
🎯 Targets ~ $192 – $198 – $204 - $220 - $250
🛑 Suggested SL (if entering on breakout): Below $170
Solana at a Critical Juncture!
BINANCE:SOLUSDT
CRYPTOCAP:SOL has rallied hard from $125 → $192 — a whopping +50% move in just 30 days! But here’s what’s cooking now:
🔺 Rising Wedge Pattern spotted — a structure that often signals trend exhaustion at the top.
Price is hugging the upper trendline
Historically, rising wedges near local highs often precede short-term corrections or fakeouts before breakout
🚨 Key Levels to Watch:
$200–$210 → Breakout zone
$180 → Mid-support, potential bounce zone
$165–$150 → Wedge base and strong demand
➡️ Break above $200 with volume = bullish continuation
⬇️ Breakdown from $180 = pullback toward $150–$165
A breakout from this wedge could catapult CRYPTOCAP:SOL into $230+ territory. But failure here could trigger a retest of lower support.

$BTC 45-min Chart Analysis
Bitcoin 💰 has just completed a clean 5-wave impulse move, peaking near $109K, and is now entering a short-term ABC correction phase.
Wave Count Overview🔎
(1)-(5) impulse wave completed
Wave (a) correction underway – already bounced off local support
Currently tracking Wave (b) relief rally
🔁 Wave B Retracement Key Level
0.618 Fib = $108,004
This level is a critical rejection zone. If CRYPTOCAP:BTC faces resistance here, expect continuation toward Wave C next.
🔻 Short-Term Scenarios
Bearish Case (ABC plays out)
🅰️ Wave (b) bounce may fade near $108K
🅱️ Wave (c) could drag price down toward $105.5K–$106K zone for completion
Bullish Case (Shallow Correction)
Holding above $107K and breaking $108K cleanly could invalidate Wave C
Price may resume impulsive structure if no deeper correction follows
⚠️ Key Observations
This is a standard post-rally correction, not a reversal
No panic unless $105K breaks
Next 12–24 hours crucial: will CRYPTOCAP:BTC reclaim $108K or head into deeper Wave C?
The trend is still bullish — this short-term ABC is a healthy cooldown. If bulls defend above $106K and reclaim $108K, momentum could quickly flip back in favor of a new rally.

SOL/USDT 1H Chart Analysis – Bullish Reversal Targeting Resistan🚀 SOL/USDT 1H Chart Analysis – Bullish Reversal Targeting Resistance Zone 🎯
📊 Pair: SOL/USDT
🕐 Timeframe: 1H
📈 Platform: Binance
🔍 Technical Overview:
🔵 Support Zone (145.00 – 147.50 USDT)
Price has bounced multiple times from this strong demand zone marked in light blue.
Recent price action shows buyers defending this level aggressively — potential accumulation area. ✅
🔴 Resistance Zone (159.50 – 162.00 USDT)
Marked in red, this zone has historically rejected price twice (confirmed by red & yellow arrows).
Currently, the market is expected to retest this supply area once again. ⚠️
📈 Bullish Pathway:
Current structure suggests a reversal from support, aiming for:
TP1: $150.46
TP2: $154.31
TP3 / Final Target: $160.89 (within resistance)
🔄 Trend Structure:
Price is forming higher lows, hinting at early reversal stages.
Break above $150.46 would confirm bullish momentum. 🟢
🧠 Conclusion:
SOL/USDT is setting up for a bullish reversal from a strong support zone, with targets aligned toward previous resistance. Traders should monitor the reaction at $150.46 and $154.31 — a clean break may propel price to $160.89.
📌 Watch for:
Confirmation candle at support zone
Break and retest patterns on intraday resistance levels
📉 Support: 145.00 – 147.50
📈 Resistance: 159.50 – 162.00
🎯 Bullish Targets: 150.46 → 154.31 → 160.89
🔔 Stay updated, manage risk, and trade wisely! 💹📈

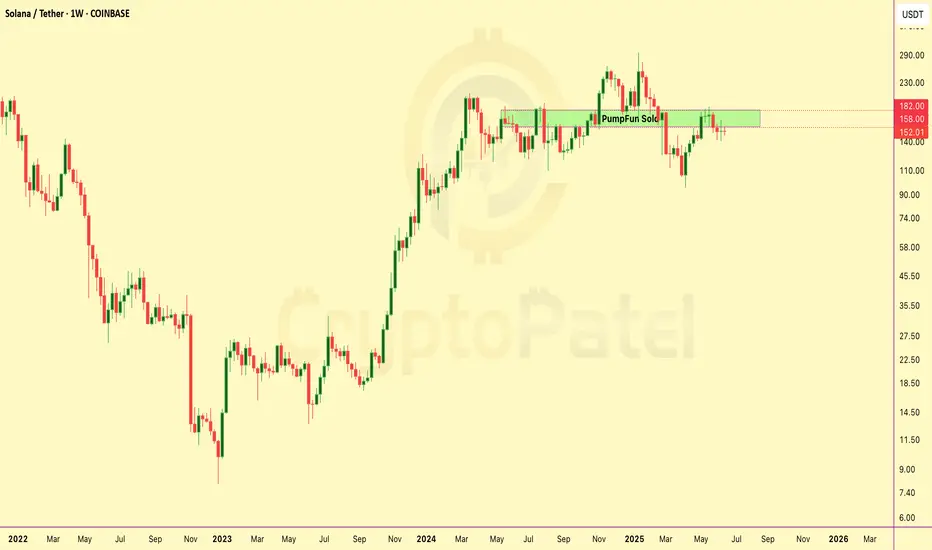
Pump.fun Sells $741M in SOL After X Suspension – What’s Really?Pump.fun Sells $741M in SOL After X Suspension – What’s Really Happening?
PumpFun (@pumpdotfun), a popular Solana-based meme token launch platform, was recently suspended from X — but they’ve been making major moves behind the scenes.
Since May 19, 2024, the platform has sold around 4.1 million SOL, worth nearly $741 million, at an average price of $180.
Here’s the full breakdown:
🔹 264,373 SOL sold for $41.64 million USDC at $158
🔹 3.84 million SOL, worth $699 million, sent to Kraken at $182
Why is Pump.fun selling so much?
Is this an exit strategy, or are they just managing risk?
Is $SOL about to DUMP… or set up a MASSIVE BUY ZONE?Is CRYPTOCAP:SOL about to DUMP… or set up a MASSIVE BUY ZONE?
Solana is now at a critical level on the higher timeframe chart:
✅ After a breakdown, SOL is now retesting the bearish retest zone
✅ Strong resistance seen at $170–$180
✅ If rejected → price could dip toward the $100 range
But here’s the key: A dip to $100 would be a massive long-term buying opportunity for many investors (including me).
Long-term targets? I’m still eyeing $500 → $1000 if the macro trend plays out.
👉 Keep a close eye — the next few weeks could set up the next big move for $SOL.
Are you ready? Will you be buying the dip? Comment below! 👇
NFA & DYOR