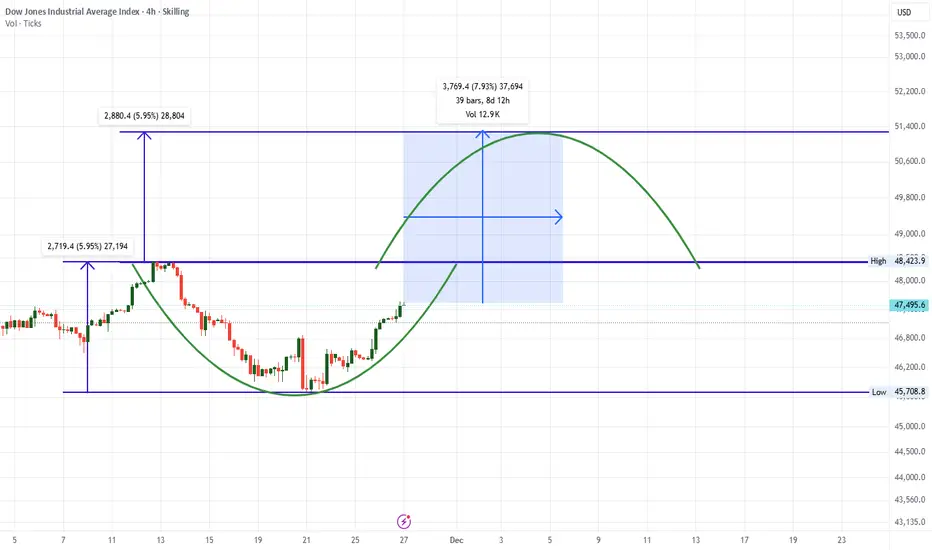
DOW Jones is having rounding bottom formation - 8% upside targetDOW Jones is having rounding bottom formation - 8% upside target Possible.
LTP - 47500
Targets - 51300+
Timeframe - Dec-25 End.
Charts are suggesting Bull market run of 8% in next few weeks on Dow Jones - Possibility of some Positive news flows across world to take markets on big upmove in Dec Month.
Happy investing..
Trade ideas
Higher highs and below SMA( Weekly high > 1 week ago high AND ( Latest Close < SMA(Latest Close, 50) OR Latest Close < SMA(Latest Close, 200) ) )


Dow Jones at resistance, should expect some down sideAs we see Dow is moving in a trend , breaking the trend on upper side is unlikely , expect some correction .
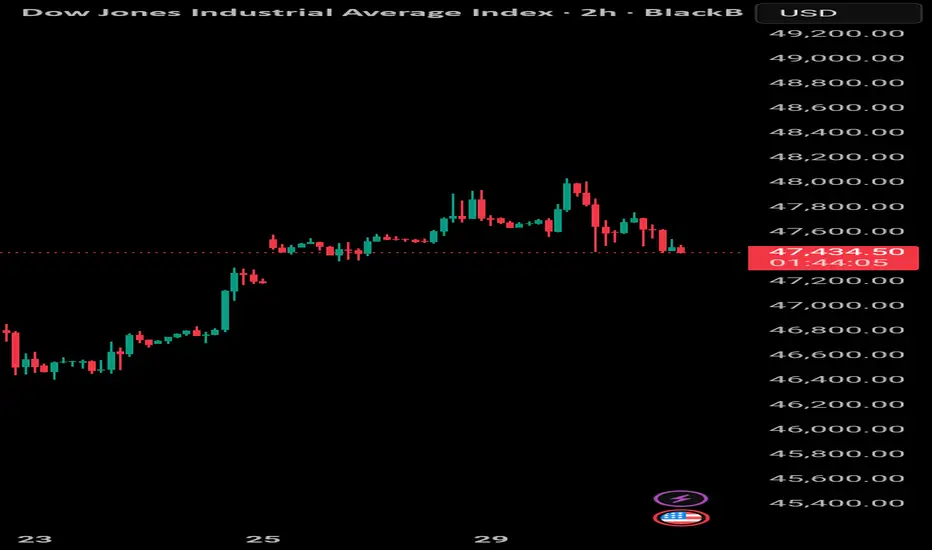
DJI 1HRSWING TRADE
- EARN WITH ME DAILY 10K-20K –
DJI Looking good for upside..
When it break level 47451 and sustain.. it will go upside...
BUY@ 47451
Target
1st 47700
2nd 48036
Enjoy trading traders.. Keep add this STOCK in your watch list..
Big Investor are welcome to join the ride ..
Like this Post??? Hit like button..!!!
Follow me for FREE Educational Post and Alert..

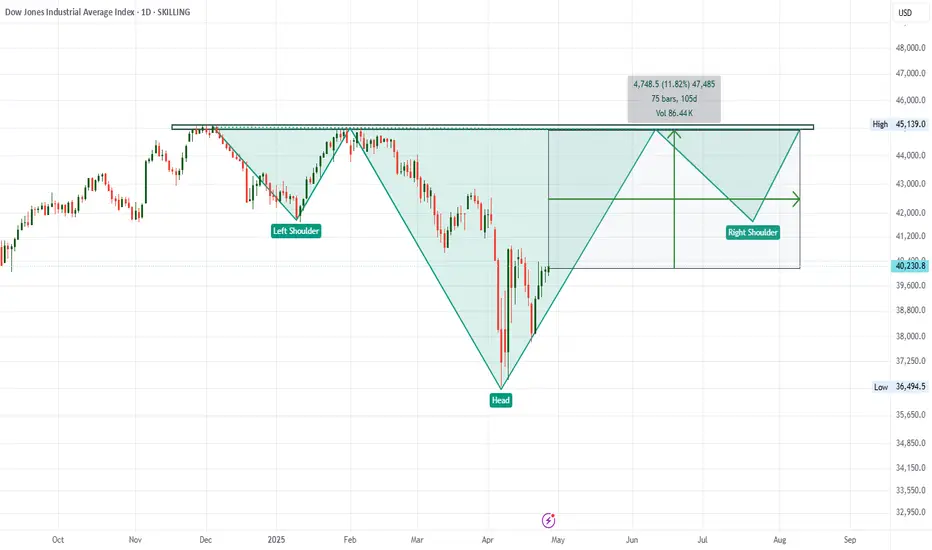
Dow Jones shows Inverse H&S Pattern getting developed.11% upsideDow Jones shows Inverse H&S Pattern getting developed.
11% upside possible in next 4-5 Months.
Happy Investing.
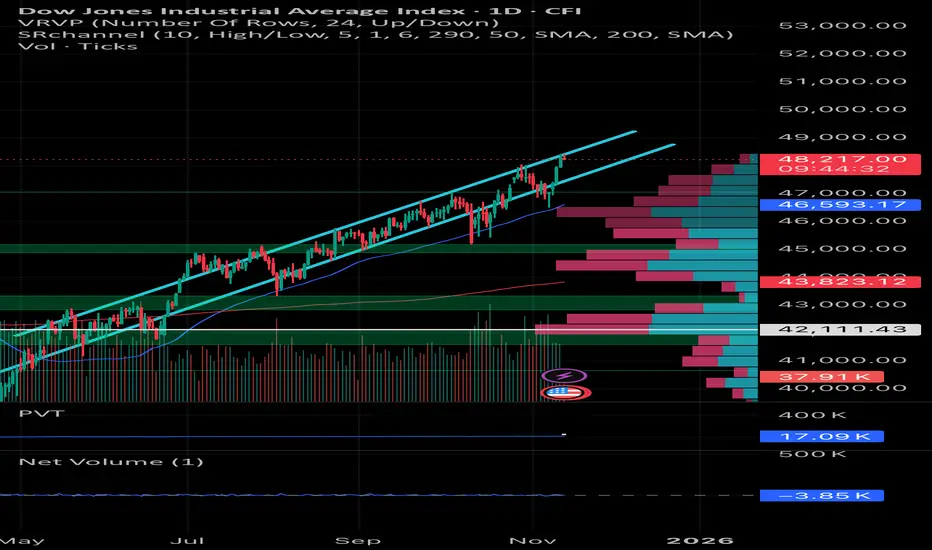
DOW JONES 30 on Weekly ATH Breakout ... Next 1 Year is BullishDOW JONES 30 on Weekly ATH Breakout ... Next 1 Year is going to be super Bullish.
All Good news will start flowing - Interests rate cuts / End of long ongoing Wars / Peace in World / GDP growth.
'Yahi samay hai, sahi samay hai...Bharat ka anmol samay hai': PM Modi recites thought-provoking poem on I-Day
Happy Investing.

NQ and US30 27.10.2025NQ and US30 are still bullish until we get a break below our trading range and we get a confirmation to the start of a bearish trend. Before that, just sit tight and continue the current bullish bias. Lastly, remember trading is all about risk management!

US 30 Quick setup US30 As it's been falling recently found this quick setup with small target as you can see small suppy zone , plus breakout gave confirmation for down side moment

Dow Jones gives Brakeout on monthly chart TVC:DJI
Dow jones give break out on monthly chart and next milestone is 56000

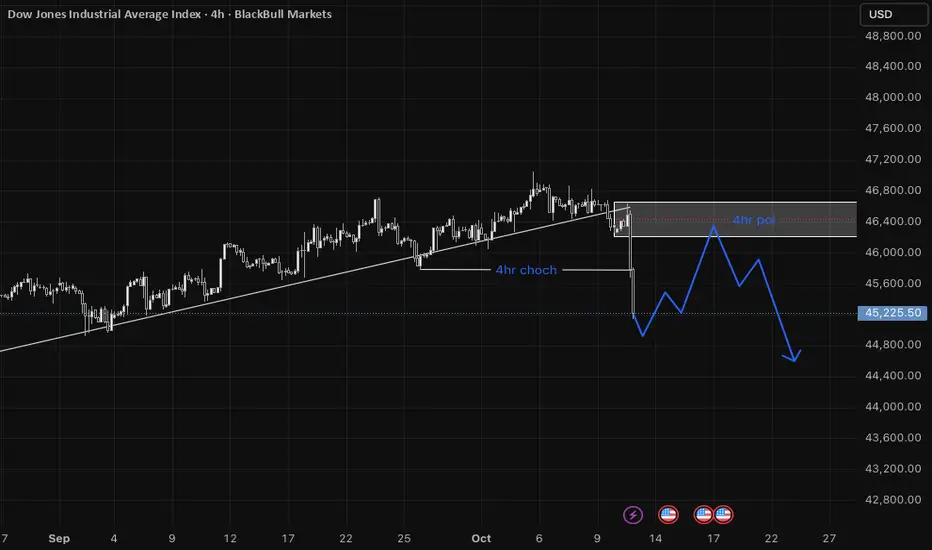
US30 | 4H–15M Bearish Confluence SetupPrice has displayed a Change of Character (ChoCH) on the 4-hour timeframe, breaking the existing bullish trendline and leaving behind a 4H imbalance. This shift indicates potential weakness in the prevailing bullish structure.
I’ll be waiting for price to retrace into the 4H imbalance zone and establish a bearish Change of Character on the 15-minute timeframe, ideally accompanied by the formation of a Fair Value Gap (FVG) or minor imbalance.
Once the 15M imbalance is retested and a bearish candlestick pattern confirms order flow alignment, a short position can be considered after a break below the low of that bearish pattern.
This setup aligns multiple timeframe confluences, reflecting a potential shift in market structure from bullish to bearish.
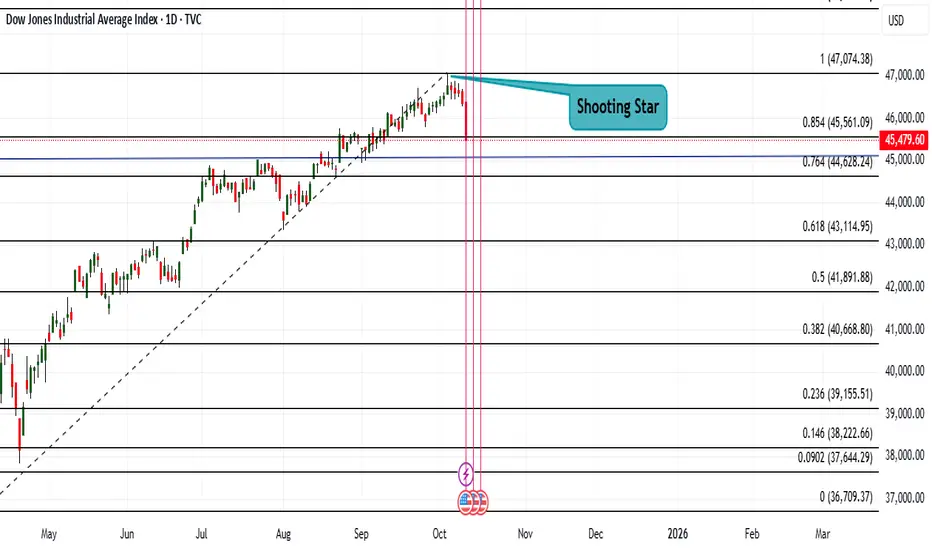
DJIA down by almost 900 points yesterdayDJIA fell down by 878points yesterday inspite of MCSI being above average.
Hint of the fall: Formation of Shooting Star Candle on 3rd Oct, and it facing hurdle at 47,074.
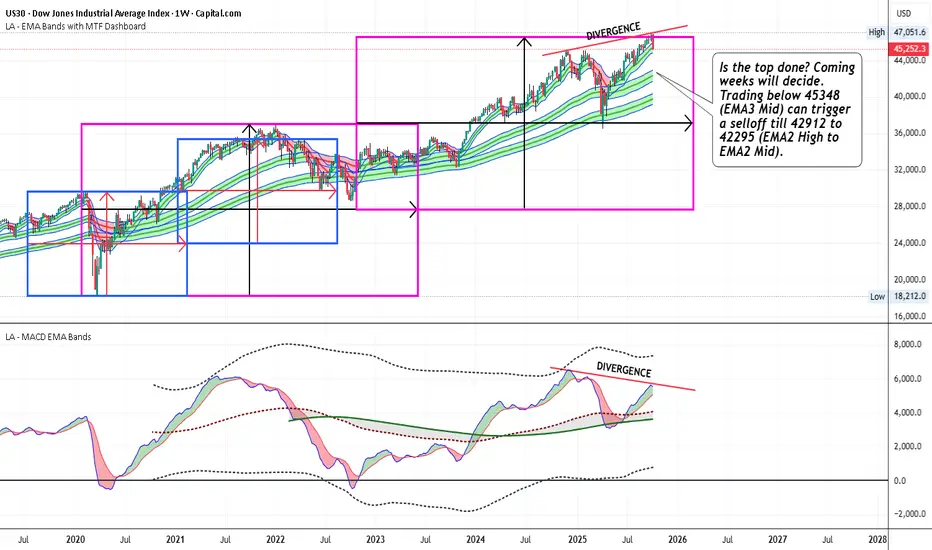
US30 - Trading below 45348 can trigger a selloff till 42912Is the top done? Coming weeks will decide. Trading below 45348 (EMA3 Mid) can trigger a selloff till 42912 to 42295 (EMA2 High to EMA2 Mid)
US30 SELL TRADE As we try to sell gold but due to miss opportunity
We dont, always strike when find opportunity
Also we see this london session
Better luck next time


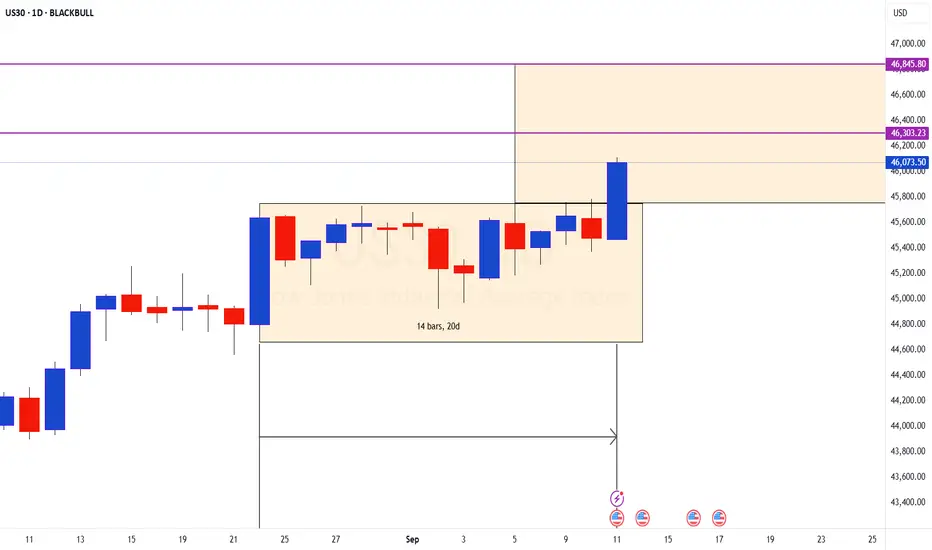
NR14 Breakout on DOW US30A perfect textbook trading set up on DOW.
Price has been trading sideways after the strength candle formed on the 22nd Aug.
Price has now broken out of the range after 14 days of consolidation.
Pattern range is 1100 points and the target is 46845
Disclaimer: I am not a SEBI registered Analyst and this is not a trading advise. Views are personal and for educational purpose only. Please consult your Financial Advisor for any investment decisions. Please consider my views only to get a different perspective (FOR or AGAINST your views). Please don't trade FNO based on my views. If you like my analysis and learnt something from it, please give a BOOST. Feel free to express your thoughts and questions in the comments section.
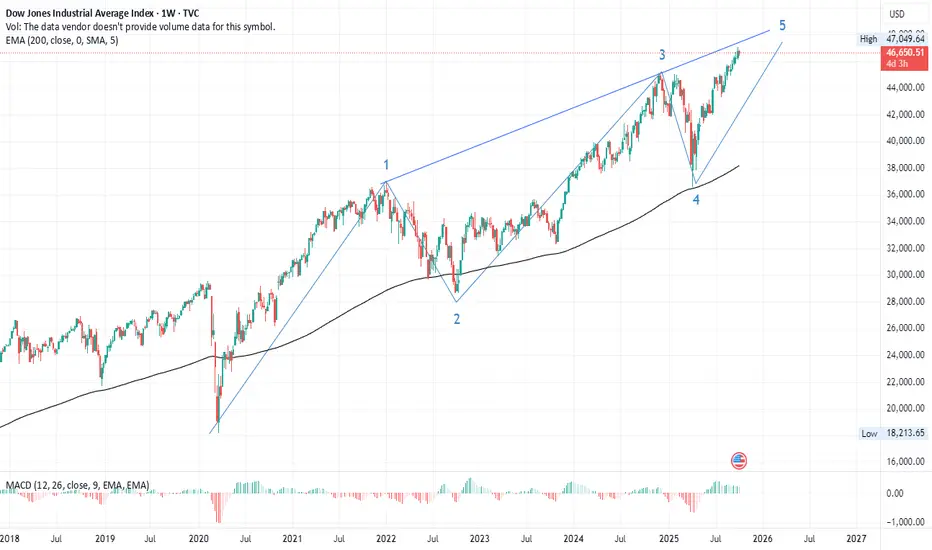
SELLDow Jones Industrial Average – Elliott Wave Cycle Analysis
Following the market crash of 2020, the DJI initiated a new long-term impulsive wave cycle:
- Wave 1: Began on 30 March 2020 and extended through 27 December 2021, marking a strong bullish recovery phase.
- Wave 2: A corrective zigzag pattern unfolded, bottoming out in October 2022.
- Wave 3: A powerful rally commenced post-correction, culminating on 2 December 2024, consistent with the characteristics of a third wave—typically the strongest in momentum.
- Wave 4: A complex elongated flat correction formed, concluding around 7 April 2025.
- Wave 5: The index has since resumed its upward trajectory, entering the final leg of the cycle.
🔺 Structural Implication:
Wave 1 remains the largest in magnitude, suggesting the development of an Ending Diagonal in Wave 5. This pattern typically occurs in the final wave of a motive sequence and is characterized by converging trendlines and weakening momentum.
📉 Key Technical Signal:
To validate the Ending Diagonal structure, the price must breach the 1–3 trendline, which is currently within close proximity. A breakdown below this trendline would signal the completion of the long-term bullish cycle and potentially usher in a broader corrective phase.
⚠ Investor Note:
The DJI appears to be approaching the terminal phase of a multi-year impulsive cycle. Traders and investors should exercise caution and monitor key structural levels closely, as the risk of a significant reversal increases upon completion of the Ending Diagonal.
---
Bearish Signal in Dow Jones: Will 45,000 Hold?Dow Jones Analysis – Bearish Signal Emerges
The Dow Jones Industrial Average (DJI) has shown signs of weakness over the past couple of sessions. On Tuesday, the index formed a shooting star candlestick pattern — a classic reversal signal that often indicates exhaustion in the uptrend.
Yesterday, the shooting star was confirmed by a follow-up bearish candle, which strengthens the case that a short-term top may be in place for the index. This suggests that buyers are losing control, and sellers are stepping in at higher levels.
Key Support Zone – 45,000
The immediate and crucial support for DJI is placed around 45,000, a level that has held strong in the past. However, the index is now testing this zone again, and the price action shows clear weakness.
Trend Breakdown Adds to Bearish Bias
Looking at the chart, the trendline support is also at risk of breaking. If the index fails to hold 45,000 decisively, this breakdown could open the door for deeper correction, leading to further downside targets in the short term.
Conclusion
Bearish pattern confirmed: Shooting star + follow-up candle.
45,000 is key support: A breakdown here confirms bearish momentum.
Short-term top likely: Weakness could extend further if supports fail.
📉 For now, traders should stay cautious on DJI until it either reclaims higher levels or establishes fresh support below.

US30 – Rising Wedge on Thin Ice ! The Dow has been pushing higher for weeks, but the structure it’s building isn’t the most comfortable for bulls. Right now, price is sitting inside a rising wedge — a pattern that often looks strong until momentum fades and it breaks lower.
What’s happening now?
Buyers are still trying to defend near the top of the wedge, but every new push looks weaker than the last.
The candles are tightening, which usually signals a volatility squeeze. Once it snaps, the move tends to be quick.
Momentum hasn’t kept pace with price. That mismatch is an early warning sign.
Levels I’m watching
Target 1: 45900–46000. First line of support. If this gives way, short-term weakness will expand.
Target 2: 45200. A deeper pullback zone where profit-taking could slow the drop.
Final zone: 44200–44300. If the wedge fully unwinds, this is where I expect the sell-off to stretch, followed by a bounce attempt.
Short-term view:
For bulls, the only way to flip sentiment is a clean breakout above the wedge resistance. Until then, upside looks limited while the downside risk is gradually opening up. Chasing longs here carries more risk than reward. A confirmed break below support would tilt momentum decisively bearish. Trade safe!

Dow Jones Update – Short Entry After Red Zone Rejection✅🎯💥Following my previous Dow Jones analysis, price retested the red supply zone near 46,076 and was rejected. It then moved back below the previous high at 46,026, triggering my short entry on the M5 timeframe.
Trade Outcome:
Entry: 46,026 (confirmation after rejection on M5)
Target: Reached Risk/Reward level R2 with price dropping to 45,925 area.
This move confirms the strength of the descending trendline resistance and sellers holding control. Watching for further downside if 45,900 is broken.
#DowJones #US30 #Indices #TechnicalAnalysis #PriceAction #ShortTrade #SupplyZone #TrendlineResistance #RiskReward #Scalping #M5 #DayTrading #ChartAnalysis #StockMarket #SellSignal
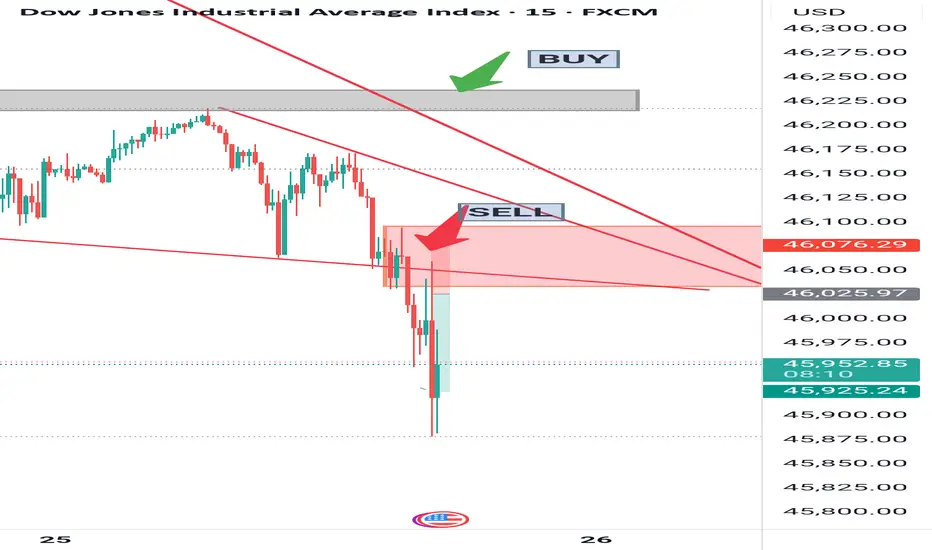
Dow Jones – Sell on Red Zone Rejection, Buy Above Gray Box✅✅If it confirms during the stock market session, we will trade the Dow Jones only during this time and as a scalper. According to the following scenario:
On the Dow Jones chart, my trading plan is based on two key zones:
Sell Scenario: If price retests the red zone (46,080–46,040) and gets rejected, I will enter a short position targeting 46,000 and lower levels. This setup is supported by the descending trendlines acting as resistance.
Buy Scenario: If price breaks above the gray box (46,240 zone) and confirms the breakout with a retest, I will enter a long position aiming for higher targets towards 46,280+.
Key Notes:
Trendlines indicate a bearish bias unless the upper box is broken.
Confirmation via candlestick rejection or breakout retest is essential before entry.

An idea on DJI (US30) #US30TRADE PLAN : US30 - DOW JONES INDEX
Based on a Trend analysis of US30, had a plan to short the index at the NYSE Open as the structure shifted to the downside.
*This is not financial Advise just an analysis for educational Purpose*
