Part 5 Best Trading Strategies Simple Example to Understand
Scenario
Nifty at 21500
You expect it to go to 21650.
Call Option Buy
Buy 21500 CE
If Nifty moves up → premium increases → profit
If Nifty falls → premium collapses → loss
Put Option Buy
Not useful in this scenario
Option Seller’s View
If seller expects market t
S&P 500 Index
No trades
About S&P 500 Index
Standard & Poor’s 500 is an American stock market index consisting of 500 large companies having common stock listed on the NYSE or NASDAQ and their market capitalizations. It captures approximately 80% coverage of available market capitalization. Because it includes both growth stocks and value stocks it is one of the most followed equity indices and is considered to be one of the best representations of the U.S. stock market and a trend indicator for the U.S. economy. S&P introduced its first index in 1923 and its present day form on March 4,1957. It was developed and continues to maintained by S&P Dow Jones Indices, a joint venture majority owned by McGraw Hill Financial.

Part 5 Advance Option Trading Option Seller (Short Option)
Advantages:
Benefits from time decay
Higher probability of profit
Works well in sideways markets
Disadvantages:
Unlimited or very high risk
Requires margin
Risk increases sharply during volatility spikes

Momentum Patterns in Cryptocurrency MarketsUnderstanding Momentum in Crypto Markets
Momentum refers to the speed and strength of price movement in a particular direction. In crypto markets, momentum is driven by a combination of factors such as liquidity inflows, news events, social media hype, whale activity, derivatives positioning, and m

Open Interest (OI) Analysis for Futures & Options TradersOpen Interest Analysis for Futures & Options Traders
Open Interest (OI) is one of the most powerful yet misunderstood tools in the derivatives market. While price and volume tell traders what is happening, open interest helps explain why it is happening and who is likely behind the move. For future

Part 1 Intraday Institutional Trading Types of Options- Call Option: Right to buy.
- Put Option: Right to sell.
Basic Strategies- Long Call: Bet on price ↑.
- Long Put: Bet on price ↓.
- Covered Call: Sell call on stock you own.
- Protective Put: Buy put on stock you own.

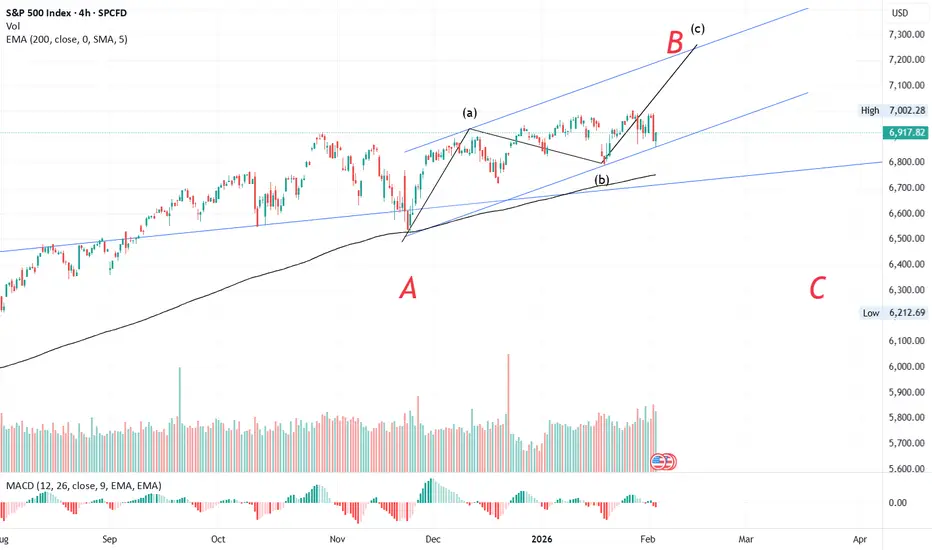
#S&P📊 S&P 500 Wave Analysis Update
The S&P began its corrective phase on 29 Oct 2025, forming its A wave by 21 Nov 2025. From there, the index rallied into its B wave, retracing more than 61.8%, which signals the development of a flat correction.
Breaking down the B wave:
- The a wave formed on
Part 1 Intraday Institutional Trading Moneyness of Options
ITM, ATM, OTM based on underlying price.
ATM options are most sensitive to price moves.
OTM options are cheap but decay fast.
Implied Volatility (IV)
Measures expected movement.
High IV = high premium.
IV crush happens after events (e.g., RBI meeting, Fed decision).

Commodity Trading: Energy, Metals & Agricultural MarketsCommodity trading involves buying and selling physical goods or their derivative contracts with the objective of profit, hedging risk, or portfolio diversification. Unlike equities (which represent ownership in companies), commodities are tangible assets such as crude oil, gold, wheat, or natural ga

Part 4 Institutional VS. Technical1. Delta
Measures how much the premium changes with a ₹1 move in the underlying.
Call delta: +0.0 to +1.0
Put delta: –0.0 to –1.0
High delta = faster premium movement.
2. Gamma
Measures how fast delta changes. Used to evaluate momentum and risk.
3. Theta
Measures time decay—how much premium

Equity Market Trends: An In-Depth Analysis1. Defining Equity Market Trends
At its core, an equity market trend refers to the general direction in which stock prices move over a period. These trends can be upward (bullish), downward (bearish), or sideways (neutral/consolidation). Bullish trends indicate sustained buying pressure, reflecting

See all ideas
Displays a symbol's value movements over previous years to identify recurring trends.
Frequently Asked Questions
S&P 500 Index reached its highest quote on Jan 28, 2026 — 7,013.7 USD. See more data on the S&P 500 Index chart.
The lowest ever quote of S&P 500 Index is 665.6 USD. It was reached on Mar 6, 2009. See more data on the S&P 500 Index chart.
S&P 500 Index is just a number that lets you track performance of the instruments comprising the index, so you can't invest in it directly. But you can buy S&P 500 Index futures or funds or invest in its components.