Advanced Option Trading StrategiesHedging and Portfolio Protection Strategies
Options are not just for speculation; they are powerful tools for hedging existing stock portfolios. Hedging means protecting against potential losses due to adverse price moves.
Popular Hedging Techniques:
Protective Put: Buy a put option against long
About S&P 500 Index
Standard & Poor’s 500 is an American stock market index consisting of 500 large companies having common stock listed on the NYSE or NASDAQ and their market capitalizations. It captures approximately 80% coverage of available market capitalization. Because it includes both growth stocks and value stocks it is one of the most followed equity indices and is considered to be one of the best representations of the U.S. stock market and a trend indicator for the U.S. economy. S&P introduced its first index in 1923 and its present day form on March 4,1957. It was developed and continues to maintained by S&P Dow Jones Indices, a joint venture majority owned by McGraw Hill Financial.

Understanding the Master Candle ConceptOption trading is one of the most exciting and flexible segments of the financial markets. It allows traders to profit not only when prices rise, but also when they fall — and even when they stay relatively stable. In simple terms, an option is a financial contract that gives the buyer the right, bu

S&P 500 – Elliott Wave Breakdown & Long Setup (15-Min Chart)The S&P 500 has completed a full five-wave impulsive decline and is now progressing through a corrective A–B–C structure, offering a potential long setup on the horizon.
🔍 Wave Structure Recap:
- Wave (1) began on Oct 29, 2025, from a top of 6,920.33, and ended on Oct 31 at 6,814.27.
- Wave (2) retr

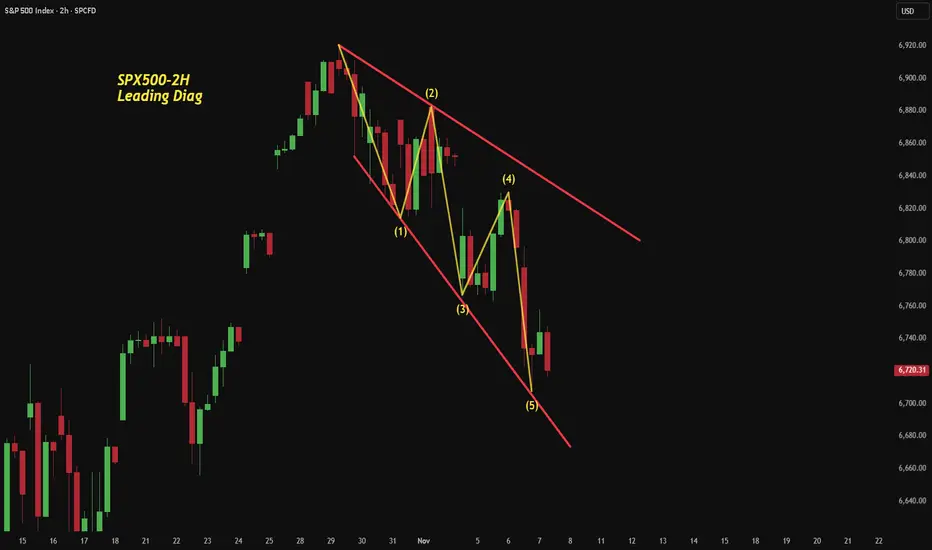
SPX500 – 2H: A Leading Diagonal from the Top?The S&P 500’s 2-hour chart may have just carved a leading diagonal right off the all-time high — a structure often seen at the start of a major new trend.
Each leg fits the contracting wedge geometry:
Wave (1) and (4) overlap, Wave (5) throws slightly under the boundary, and momentum stays fierce t
Knowledge of Candle Pattern What a candlestick shows (quick)
Body = open → close (filled/green = close>open bullish, filled/red = close

Option Trading: Basic UnderstandingHow Options Work
Each option represents a contract between a buyer and a seller. The buyer pays a premium to the seller (also called the writer) in exchange for certain rights:
The call option buyer has the right to buy the asset at the strike price.
The put option buyer has the right to sell the

A daily wrapGrowth worries and Valuation Fears
Two themes ran the show last week: America’s once-mighty growth showing signs of fatigue, and investors rediscovering their fear of heights when it comes to stock valuations—all against the backdrop of a record-breaking government shutdown that’s kept official dat

Risk in Option Trading: Segments of Financial Markets1. Introduction to Options and Risk
Options are derivative instruments that give traders the right but not the obligation to buy (call option) or sell (put option) an underlying asset at a specified price (strike price) within a set time frame. While this flexibility can amplify profits, it can als
The Hidden Potential of the Stock Market1. Beyond the Ticker: The Real Purpose of the Stock Market
At its core, the stock market was never just a gambling table for quick money. It was designed as a mechanism to raise capital for businesses and distribute ownership among the public. Every share you buy represents a slice of a real compan
A daily Market WrapMarket Mood: Mildly Moody
US equities hit a speed bump as the dollar tripped for the second day running. Treasury yields, which had shot up recently, cooled off slightly—though the 10-year looks like it’s eyeing another climb. Precious metals made a modest comeback, thanks to the softer dollar, but

See all ideas
Displays a symbol's price movements over previous years to identify recurring trends.
Frequently Asked Questions
S&P 500 Index reached its highest quote on Oct 30, 2025 — 6,921.9 USD. See more data on the S&P 500 Index chart.
The lowest ever quote of S&P 500 Index is 665.6 USD. It was reached on Mar 6, 2009. See more data on the S&P 500 Index chart.
S&P 500 Index is just a number that lets you track performance of the instruments comprising the index, so you can't invest in it directly. But you can buy S&P 500 Index futures or funds or invest in its components.