Is STXUSDT About to Explode or Collapse?Yello Paradisers! Could we be on the verge of a major breakout for STXUSDT, or are we staring down a potential breakdown? Let’s dive into the details so you don’t miss out on this crucial moment!
💎STXUSDT has formed a descending channel, and right now, the price is sitting near a key support zone. This combination significantly raises the odds of a bullish move.
💎What we’re looking for is a Change of Character (CHoCH) in the lower time frame from this support zone. If that happens, the probability of a rally increases further, as it suggests a potential double-bottom pattern could be forming.
💎If we see a rise from this level followed by a breakout and a candle closing above the resistance zone, that will confirm the bullish bias. After the formation of a W pattern or a consolidation phase, the odds of a stronger upward move become even higher.
💎However, stay alert. If the price breaks down and we get a candle closing below the support zone, it will invalidate this setup completely.
🎖 As always, discipline is key, Paradisers. Be patient and wait for confirmation. Trading smart and sticking to high-probability setups is how you make it long-term in this game. Stay focused, stay disciplined!
MyCryptoParadise
iFeel the success🌴
STXUST trade ideas

$STX Looks Strong: Could It Rally to $7?NASDAQ:STX Looks Strong: Could It Rally to $7?
➡️ Current Trend: Bullish on the higher time frame (HTF).
➡️ Key Support Level: $1.20
If $1.20 holds as support, it’s a very positive sign for STX holders.
➡️ Bull Flag Formation:
- Breakout zone: $1.60 - $1.70
- If STX breaks out of this zone, it could push the price toward $5 - $7.
➡️ Accumulation Zone:
- Above $1 is a good area to accumulate STX.
- Below $1 could be bearish.
Stay sharp and watch these levels.


STXUSDT.P 15m Long1. After taken liquidity.
2. Break out of the highest previous with volume
Wait confirmation on low tf and open long

head and shoulder patternfollow me for more successed trade and this market in under risk and so learn about trade visely

STX Ascending Triangle PatternFrom my point of view NASDAQ:STX makes a Ascending triangle and successfully breaks it and retested also.

STXUSDT IS LOOKING FOR TREND REVERSALConfirmation for trend reversal
1. Breakout of Trendline with good volume
2. Double bottom
3. Bullish divergence

STXUSDT is looking bearishlooking for downside
1. Bearish divergence
2. rising wedge formed at the top

STXUSDT Ready for 40-50% in Short termSTX USDT going to follow one of the two paths drawn in upcoming weeks .
Hoping to see it @ 1.10 $ .
Enjoy Free Profitable Signals
BINANCE:STXUSDT

STXUSDTPERP is about to breakoutSTXUSDT is about to break on the Futures contract on the 1hr time frame.

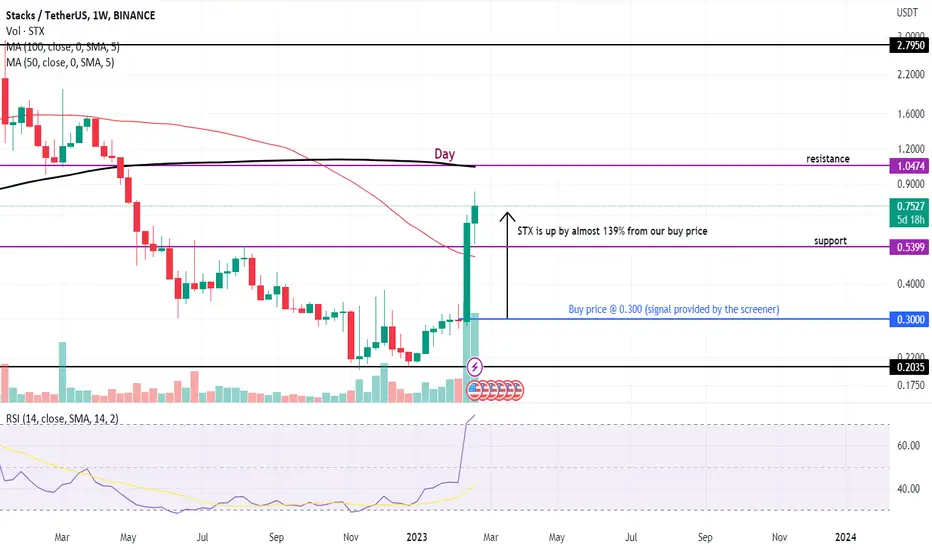
Will Stacks continue the rally?The token has seen almost 139% growth since we published our analysis on 7th Feb 2022 ().
The price is above the weekly 50-MA and RSI is above 70 showing upside momentum in the coin.
The coin is showing support @ 0.5399 and resistance @ 1.0474 . Entry can be made with appropriate stop loss.
Note:
Studies are for educational purposes only.
We will not be responsible for any kind of your Profits & Losses.
Follow us for more updates.
Daily Screener: STXUSDTFrom a pool of thousands of tokens, selecting the right token for trading becomes difficult. Retail investors often invest / trade when the tokens are already up by 60-70%.
To resolve this, we have designed a screener to screen tokens gaining momentum.
Today's screener token: STXUSDT
Screener Logic:
Price (close) > Parabolic SAR
AND
MACD > MACD signal
AND
Supertrend gives buy signal
Timeframe: 1d
Reward to Risk Ratio : 2
Note:
The token selection is based on various technical indicators and there is always the risk of losing money while trading. Please DYOR before trading/ investing.
Studies are for educational purposes only.
We will not be responsible for any kind of your Profits & Losses.
Follow us for more updates.

STXUSDT ReboundBINANCE:STXUSDT is looking for rebound from long time trendline at 2 hrs timeframe. You can expect for great returns.

💡Don't miss the great buy opportunity in STXUSD @StacksTrading suggestion:
". There is a possibility of temporary retracement to the suggested support line (1.295).
. if so, traders can set orders based on Price Action and expect to reach short-term targets."
Technical analysis:
. STXUSD is in a range bound, and the beginning of an uptrend is expected.
. The price is above the 21-Day WEMA, which acts as a dynamic support.
. The RSI is at 74.
Take Profits:
TP1= @ 1.595
TP2= @ 1.769
TP3= @ 1.988
TP4= @ 2.195
TP5= @ 2.465
SL= Break below S2
❤️ If you find this helpful and want more FREE forecasts in TradingView
. . . . . Please show your support back,
. . . . . . . . Hit the 👍 LIKE button,
. . . . . . . . . . Drop some feedback below in the comment!
❤️ Your support is very much 🙏 appreciated!❤️
💎 Want us to help you become a better Forex / Crypto trader?
Now, It's your turn!
Be sure to leave a comment; let us know how you see this opportunity and forecast.
Trade well, ❤️
ForecastCity English Support Team ❤️

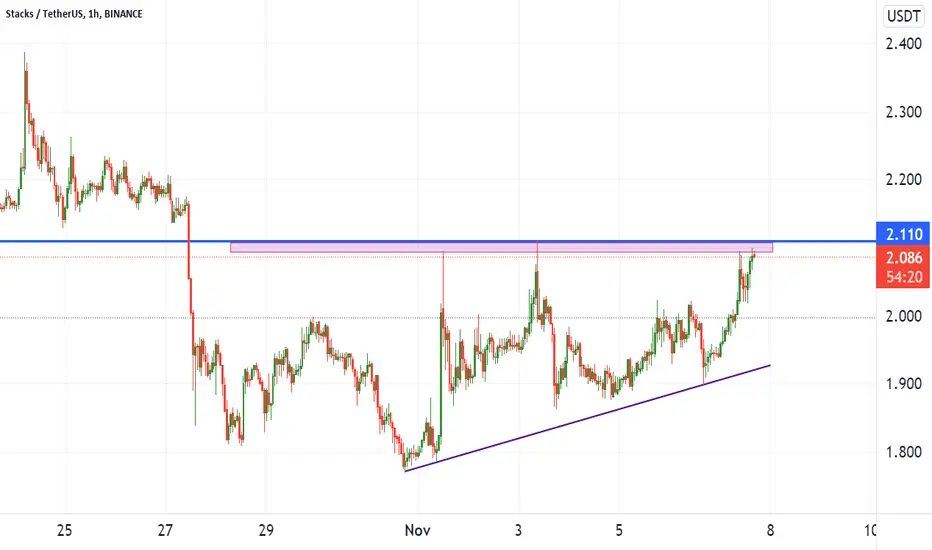
Watchout for Resistance breakoutThe script looks good above 2.11 level for 5-10% further upmove.
This is one of the trades shared with our subscribers today. We share live trades daily.
Learn & Earn,
Dr. Tanya Kumar
STXUSDT analysis After a rally of almost 130% Stacks forms a Double top pattern with it's neckline ( support ) near 1.1200, if it breaks the neckline we can expect a drop till 0.83.

Stx enters in a great buy trend right now. Alert: keep all your selling orders above 0.3500 USDT. Within a day you'd see it crossing 0.4000 usdt as per technical analysis done by former citi trader.
