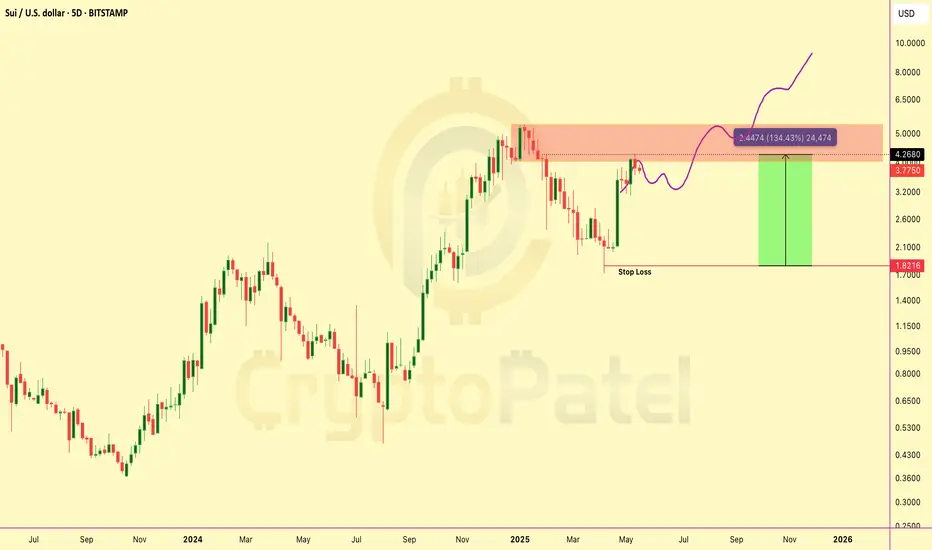
$SUI 130% up from our Entry and What Next?CRYPTOCAP:SUI pumped 130% from our entry around $2 — now hitting $4.29! Bottom perfectly caught.
Expecting a healthy pullback to ~$3 before next leg higher — that zone is ideal for fresh entries.
Long-term targets: $5/$10/$15/$20
#SUI #Altcoins
Trade ideas
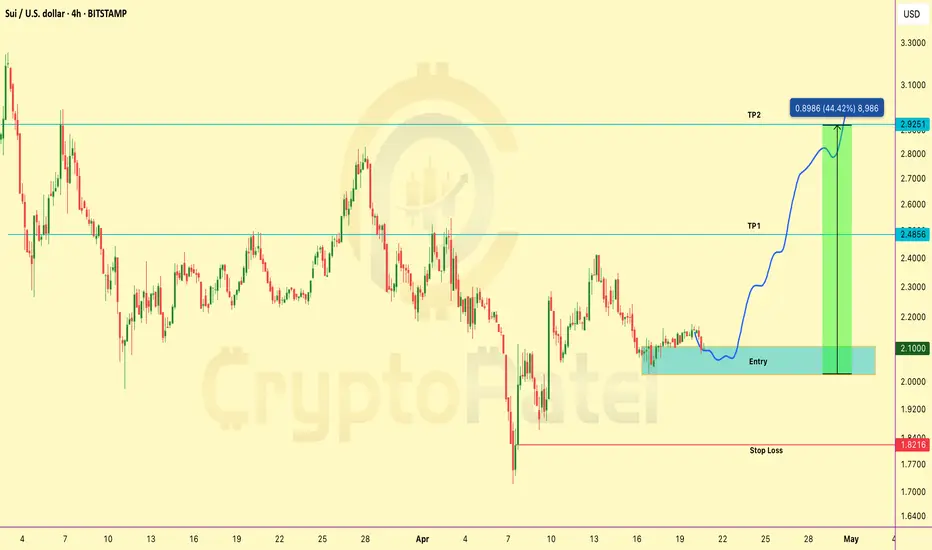
SUI/USDT Chart Analysis and Looking Long Setup for Good RRIf you're hunting clean setups with solid R:R — this CRYPTOCAP:SUI long looks 🔥
▶️ Entry: $2.10–$2.00
▶️ Targets: $2.48 / $2.92
▶️ SL: $1.82
Perfect for risk-managed apes. Don’t sleep on it.
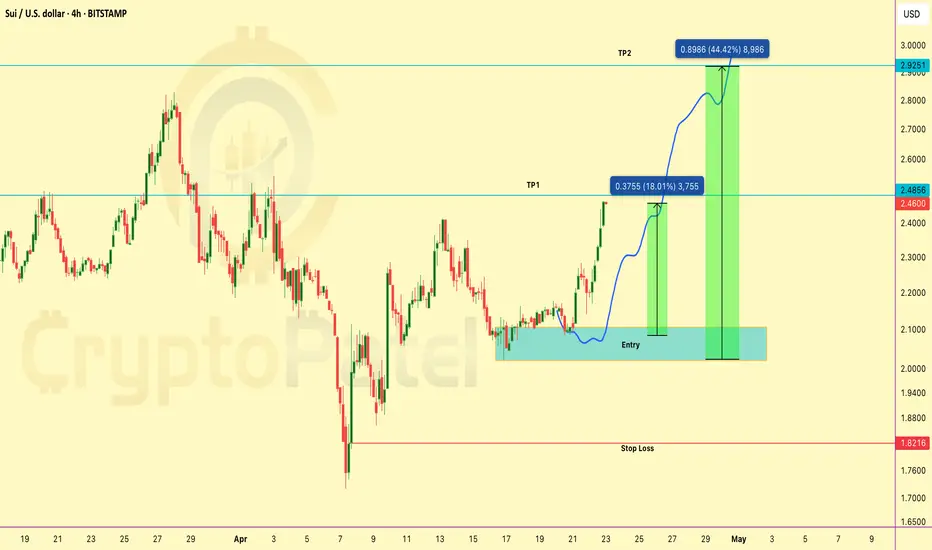
SUI/USDT Now 18% up in Spot from our Entry LevelCRYPTOCAP:SUI just hit +18% on spot and a massive +176% on 10x leverage from our shared trade setup! 🚀
➡️ Entry: $2.08
➡️ Current: $2.4660
Solid breakout play — hope you all caught the move!
Feel free to lock in profits anytime here for a safe exit. ✅
SUI’s proximity to this support level raises concerns about its As October came to a close, the crypto market experienced a sharp correction, driven by Bitcoin's fall below the $70,000 threshold. Most cryptocurrencies faced significant declines during this period.
SUI, the native token of the Sui Network, mirrored the broader market trend, initially rising with Bitcoin before following its downward trajectory. Many believe that as long as Bitcoin remains above $69,000, the overall outlook for the crypto market will remain bullish.
An analyst recently shared a 4-hour chart on X, identifying a flag and pole pattern, and asserted that a breakout above $2.05 could trigger a substantial rally toward the previous all-time high.
x.com
On the daily chart, SUI is currently trading just above its 20-day exponential moving average (EMA), which acts as critical support at $1.94. This EMA, representing the asset's average price over the last 20 trading days, typically indicates an uptrend when prices are above it.
However, SUI’s proximity to this support level raises concerns about its strength. A decisive drop below the 20-day EMA could signal a shift to short-term bearish momentum, suggesting the uptrend may be losing steam.
If the bulls cannot maintain support, the price could decline to $1.64, with further drops potentially bringing it down to $0.91. On the other hand, if the support at $1.94 holds, it could set the stage for SUI to reclaim its all-time high of $2.36.

if buying interest increases, a pullback could formOver the past three months, SUI's price surged by over 400%, climbing from a low of $0.4623 to $2.3661 by October 13, 2024. This rally began with a breakout from a falling wedge pattern in August, followed by a strong consolidation around the $1 mark. This set the stage for a significant upward move.
In October, SUI reached a new yearly all-time high (ATH). However, concerns for the unlock event caused market jitters about ten days before the event. Consequently, the price retraced nearly 30% from its new highs. On the day of the unlock event, October 23, 2024, further pessimism drove the price below the 20-day EMA band.
Currently, SUI is resting near the 50-day EMA, which serves as a dynamic support level. Despite the strong sell-off pressure, the decline has been relatively modest compared to the robust bull run in October.
The higher highs established over the past 90 days indicate that the bullish trend remains intact, despite the recent pullback.
However, this bullish trend could be compromised if SUI breaks below the 50-day EMA and $1.6009, followed by continued selling pressure.
On the other hand, if buying interest increases, a pullback could form, potentially retesting the recent ATH. Confidence in the bullish trend would be reinforced if the price surpasses the $2.3661 mark.

Can SUI Price Go Beyond $2?
SUI has had a robust Q3, with its price nearing $1.92 intraday. The momentum suggests it is poised for another push to break the $2 mark.
This seems achievable as both spot and derivatives markets show bullish indicators.
In the spot market, strong liquidity indicates high demand. While in the derivatives market, funding rates, open interest, and short liquidations all favor a bullish outlook.
The targets to watch are $1.95 and $2.18, which need to be surpassed for a more impressive rally.
However, if SUI fails to break through the $1.95-$2.00 zone, a sell-off could be triggered. Investors should conduct their own research (DYOR) and avoid fear of missing out (FOMO) at this stage.

Sui Price Rallies 60%: Should Investors Lock in Gains or Hold foSui Price Rallies 60%: Should Investors Lock in Gains or Hold for More?
Sui price noted a strong rally gaining 60% in the last couple of weeks.
The weighted sentiment curve fell towards the zero line suggesting the investors are willing to sell after short-term gains.
A strong rally of over 60% seems to be cooling now as Sui (SUI) investors are willing to lock in their profits. Over the past two weeks, SUI has been riding a bullish wave fueled by improved investor sentiments and further driven by the US Fed Interest rate cut.
Sui emerged as one of the top gainers over the past week outperforming the market leaders and several altcoins. The crypto has bagged over 60% returns to their investors over the last two weeks breaking out of a correction phase.
At the time of writing, the SUI price was exchanging hands close to $1.548, recording a negative development of 2.16% in intraday. However, after getting benefited with substantial gains in the very short term, the investors are now in a dilemma whether to secure their unrealized profits at the moment or to hold them for more gains.
Let's analyze it in a detailed way and try to find whether SUI investors need to lock in their profits or hold them for more.
Weighted Sentiment Curve Suggests Investors Willing To Sell
Earlier, Sui entered a correction phase in April 2024 and dropped nearly 62% from the highs by the end of August. However, the crypto reversed its trajectory to break out of correction phase and show some gains in the 4th quarter.
As per Santiment an on-chain analytics provider, Sui price has been headed higher for the last two weeks. However, the positive sentiment curve has dropped indicating a loss of momentum in the buying. The weighted sentiment curve has dropped towards the zero line.
The weighted sentiment curve reveals the current biasness of the traders and investors whether it is on the bullish side or bearish side. As per the data, the weighted sentiment curve dropped towards the zero line indicating the investors sentiment shifting towards neutral side from bullish.
Additionally, the volume analysis highlights an intraday growth of 78.3% indicating heightened demand, The intraday trading volume was $910.84 Million. It has a live market capitalization of $4.08 Billion and ranks 22nd in the crypto verse.
Sui Price Prediction: Profit Booking or Rally Ahhead?
From a price action point of view, Sui price has been rising a bullish wave for the last two weeks and is now approaching a resistance of $1.7 level. In the recent sessions, Sui has made straight move of 60% which suggests a pullback is pending in the crypto to proceed further.
Also, the investors who had made entry after the breakout are sitting at decent profits. Hence, it is likely that those investors may book their profits and Sui price may head for a pullback.
Moreover, the trend outlook has shifted to bullish side, after the recent breakout which means buyers may try to enter the market on a pullback.
Now, the if the price breaks below the $1.42 level, it may trigger profit booking and decline towards the recent supply of $1.03 level. Whereas, if the price breaks above the $1.7 level, it may continue its journey to the upwards.
At the time of writing, the RSI line was at 79.7 points and that of the 14 day SMA line was at 70.93 points. Both the RSI line as well as 14 day SMA line were placed in an overbought zone indicating a correction pending.

driving SUI out of its previous consolidationSUI's price has surged 13% intraday and over 80% this week, largely due to the influence of Bitcoin and the Federal Reserve's actions.
The past 72 hours have been particularly impactful, driving SUI out of its previous consolidation range from August to early September.
Currently, SUI is trading at $1.5550 with a market capitalization of $4.21 billion, significantly up from its monthly low of $2.14 billion, now ranking 22nd in market cap.
If this momentum continues, SUI could target $1.80 and $2.00 in the short term. Should it surpass these levels, the change of character (ChoCh) could propel it further towards $3.00 and $5.00.

a stronger rally towards the $2 mark may follow. At the end of the first quarter of 2024, SUI reached a peak of $2.18, marking an impressive gain of over 485% from the last quarter of 2023. This delighted its investors. However, under the change of circumstances, many investors took profits starting second quarter. The fall aligned with broader market sentiment, which led to increased bearishness and significant red candles on the daily chart.
In mid-April of the second quarter, the price attempted to rally and shift momentum but failed, resulting in a series of lower lows within a narrowing wedge. However, by August 5th, the momentum in the third quarter of 2024 succeeded in reversing the trend.
As of now, SUI is trading at $1.0375 and has formed a pullback. If it crosses the upper edge of the horizontal range, a change in character could boost confidence.
Key levels to watch include potential resistance around the $1.20 mark, which could challenge further gains. If the price breaks past this level, a stronger rally towards the $2 mark may follow.
On the downside, the $0.77 level is acting as support. A drop below this could signal a possible reversal to $0.63 or a consolidation phase.

Although the token resurged from lower levels with the liquidityWhy SUI Failed To Elevate Its Price Higher?
From the last quarter of 2023 to the first quarter of 2024, the price displayed magnificent gains of 490%. The run began from $0.3694 to $2.1851.
However, Since the end of March, and while entering the second quarter of 2024, the SUI token price violated the uptrend significantly. The lower-low spree reduced its gains by 80%, marked by consistent profit-taking by bears.
Over a further look, The sharp decline from a swing high of $2.1816 to its current traded price of $0.7669 spanned 161 days.
SUI Token Daily Price Chart | Source: TradingView
Although the token resurged from lower levels with the liquidity grab on August 5th, it struggled to maintain upward momentum. The price is in the final month of the third quarter of 2024, and yet the price stayed in bear grasp.
This price action behavior underscores the ongoing uncertainty and bears selling pressure within the market.
Despite the bearish scenario, there remains the probability of a bounce back. If SUI can break above the $1.0 level sustains, it could trigger some bullish candles.
However, the market remains cautious, and SUI needed to overcome key resistance levels or Change of character (CHoCH) above $1.0 to signal a more substantial recovery.

Can a $20 Million Influx Spark Optimism for Sui Cryptocurrency? Can a $20 Million Influx Spark Optimism for Sui Cryptocurrency?
Meta Description: Sui price initiated a recovery in the second week of August after noting a strong crash in the last week of July
The Open Interest contracts have surged by nearly 50% a day indicating a buyers comeback.
Sui price has surpassed the 200 day Exponential moving average indicating a bullish outlook.
The Bitcoin reclaimed above the $60K mark sparking an optimism in the altcoins. The global markets headed higher after the Fed Interest rate decision with the Bitcoin rising over 5% yesterday.
A strong surge in Bitcoin's price unlocked the higher levels for Sui cryptocurrency. In tandem with the broader markets rise, Sui price jumped over 20% yesterday beating many other altcoins.
At the time of writing, Sui was exchanging hands close to $1.01 recording a swift 0.02% positive development in intraday. Let's analyze whether Sui would continue to perform in the short term and emerge as a good pick for September.
Sui Crypto: Inflow Rises By 50% A Day
Along with the recent price surge, Sui has marked the end of a correction phase. The bulls have reclaimed the $1 level. Moreover, the price rise was followed by a significant inflow in the derivatives segment.
Along with the recent price surge, Sui has marked the end of a correction phase. The bulls have reclaimed the $1 level. Moreover, the price rise was followed by a significant inflow in the derivatives segment.
As per the data obtained by a financial website app.santiment.net, the Open interest contracts noted a growth of over 50% a day indicating a buyers comeback. The OI data surged from $40 Million yesterday to over $62 Million as of now.
Moreover, the transaction volume has noted a growth of over 145% to $450.8 Million indicating a heightened demand. The volume to market cap ratio at 17.05% suggests high volatility in the crypto.
Can Sui Continue To Rise Above $1 or Fail?
Earlier, Sui price initiated a recovery in the second week of August after noting a strong crash in the last week of July. However, the bulls faced a strong resistance near the psychological $1 level.
However, the bulls established their presence near the 50 day exponential moving average after which Sui managed to stabilize at the highs. A strong upward push on the higher side has validated a bullish reversal unlocking the price potential towards the next major $1.25 level.
At the time of writing, the RSI line was placed close to 63.9 points and that of the 14 day SMA line was placed at 57.54 points. Both the RSI and SMA line were placed above the mean line indicating the price hovering in a positive territory.
Bitcoin's rise above $60K has sparked optimism in altcoins, with Sui cryptocurrency jumping over 20%. Along with the recent surge, Sui has reclaimed the $1 level. Moreover, the recent surge marks the end of a correction phase, supported by significant inflows in the derivatives segment. Open interest contracts grew over 50%, indicating a buyer comeback.
Furthermore, After a recovery in mid-August, Sui faced resistance at $1 but stabilized above the 50-day EMA. The RSI and SMA lines were placed above the mean line, suggesting positive momentum. Sui's price potential now targets the $1.25 level.

Sui Price Takes A Strong Leap Amid Increased User EngagementSui Price Takes A Strong Leap Amid Increased User Engagement
Meta Description: Sui price took a strong leap in intraday today and reclaimed the psychological $1 level
The social Metrics have surged to three months high indicating an increased user engagement.
At the time of writing, Sui price was trading close to $1.02 indicating a strong rise of over 17% a day.
Sui price took a strong leap in intraday today and reclaimed the psychological $1 level. The bulls domination may be clearly observed in the recent sessions as the price has nearly doubled in just a matter of one week.
The recent sessions have seen unprecedented growth in the price of SUI, rising nearly 100% in a week. Moreover, few analysts are correlating this impressive price jump with two major factors: increased user engagement and Greyscale's launch of a new fund for Sui and Bittensor.
On top of all the reasons, Sui price has successfully made a breakout of a long three month correction phase. The price has surpassed the 200 day Exponential moving average indicating a bullish reversal on the charts.
Social Sentiment On the Rise
As per the data obtained from a financial website app.santiement.net, there has been a robust growth in the social metrics like social dominance and social volume indicating a strong user engagement.
Source: app.santiment.net
The social dominance as well as the social volume have surged to a three month high value indicating a significant growth. Also, the social metrics curve reflects the level of user engagement and shows how much the crypto is talked about, valued, and sought after by the community.
Furthermore, Few analysts also are correlating the recent price surge in SUI with Greayscale's announcement of an investment fund for SUI and Bittensor.
Grayscale recently announced new investment trusts for SUI and Bittensor (TAO). This announcement sparked a buying frenzy, significantly impacting SUI price by almost 100% a week. The price has surged all the way from $0.5 to CMP 1.04 in a week.
Sui Crypto Technical Analysis
From a technical standpoint Sui price has surpassed all the key exponential moving averages of 20, 50 and 200 days suggesting a bullish reversal on the charts. The key EMAs may now act as a dynamic support for the crypto. The daily chart marks a breakout of a three month long correction phase.
On the higher side, the price may look for more gains if it manages to surpass the $1.145 level which is acting as the recent supply zone. On a sustained breakout, the short term traders and investors may expect a 25 to 30% growth on the higher side.
At the time of writing, the Relative strength index line was placed at 68 points and that of the 14 day SMA line was placed close to 43.6 points. Both the lines were headed higher. Also, a bullish crossover between the RSI and SMA line indicates a trend continuation.
Sui price made a strong rebound from the lows reclaiming the $1 level and nearly doubling in a week. Social metrics like dominance and volume have hit a three-month high, indicating strong user engagement. Analysts link this surge to Grayscale's new investment fund for SUI and Bittensor.
From a technical point of view, Sui has surpassed the 20, 50, and 200-day EMAs, suggesting a bullish reversal. A breakout from a three-month correction phase was noted, with potential gains if it surpasses $1.145. The RSI was at 68, and the 14-day SMA was at 43.6 indicating a bullish trend continuation.

Sui (SUI)Sui (SUI)
Sui emerged as the top weekly gainer rising over 24% a week. Looking at the daily chart it was observed that the crypto started this week on a negative note and slumped in the first half. However, in the second half, the crypto made a strong rebound snapping off the losses.
From a technical standpoint, the price has surpassed the key EMAs of 20 and 50 days suggesting a positive outlook in the short term. At the time of writing, SUI was trading close to $0.846 with a swift intraday loss of 0.64%.
Sui is a layer 1 blockchain platform offering low latency transactions with stable transaction fees. It aims to empower the developers with powerful capabilities and tools to develop the next generation of Web3 applications.
It has a live market capitalization of $2.21 Billion and ranks 34th in the crypto space. Out of a 10 Billion tokens in the total supply, nearly 25.9% i.e. 2.59 Million SUI tokens are in circulation.

Will Grayscale Involvement Lead To A Rally In SUI?
The Grayscale news has ignited the SUI bulls, as they have created Grayscale SUI Trust (SUI). In the Intraday session, SUI, the 34th-ranked crypto, had attained nearly 31% gains after the news.
When writing, the bullish boost gave SUI price and market cap a thrust upwards of 6%. This amounted to $1.66 Billion.
The spot volume inflow was more than 51% higher at $386 Million, and the Market cap surged 31%, reaching an amount of $2.1 Billion.
At press time, the SUI has increased from the historically proven demand zone, where history has shown a multifold surge from the zone.
The price has pierced the 50-day EMA, and with continued Grayscale presence, the price could blast off for a further rally beyond the 200-day EMA, which could lead to a retest of the supply level.

Decoding the Benefit, SUI price Might get From Grayscale Involve
At press time, the SUI has advanced from the demand zone, where history has proof of a massive surge from the level. The indications are on the screen, as RSI has resurged from oversold territory, coinciding near the demand area; a catalyst could kick start a rally or a parabolic thrust ahead.
The ATH was $2.1790, and from that, it traded nearly 70% down, but from ATL, the price traded 70% higher, which was $0.3630.
Therefore, if the price surges, then the resistance would be present at $0.93, and $1.43, respectively. However, if the demand area breaks, then the support needed to be studied would be at $0.48, and $0.36, respectively.

SUI technical Analysis
Sui price chart surged and showcased a rally of more than 500%, from $0.35 on October 20th, 2023, to $2.18 by March 27th, 2024. But to proceed further, it failed to sustain, and the SUI's back door was opened, which led to a nearly 50% gains drop in the next 15 days.
Thereon, the price tried seamlessly to hold the $0.910 level but failed after June 15th, 2024, as BTC slipped its $65000 support. Now, the price seems like sustaining at a crucial level of $0.60, where an earlier rally popped out.
Looking at the indicators, they show nothing much that has not already been on the price chart. For the MACD below zero line, dynamic resistances of EMA pushed the price down, and RSI at 36.58, signifying the bull's presence.
Therefore, if looking at the broader picture, the sustenance on $0.60 gets followed by larger bulls' interest. The nearest resistance would be at $0.91, and $1.38, respectively.
However, if the SUI loses its traction on the $0.60 price level, the deterioration could stretch toward the $0.36 level.

ecently witnessed dips in BTCThe SUI has followed the decline of BTC on the daily chart, in the last seven days from June 11th price-performance was bearish. The BTC Declined by -5.85%, while SUI also followed the lead and degraded by -16.25 %.
At press time, SUI traded at $1.0130 with -a 1.98% dip, while, BTC at $67659 with an -2.65% intraday fall. BTC appears to be approaching the $66150 defense line, if it breaks, the SUI could also lose the $0.90 support level. As Bitcoin happens to be the number 1 crypto by market cap, it impacts the broader market sentiments as well.
Upon observing the SUI chart, it's evident that the price trend was upward until March 27th, experiencing a substantial increase. However, the trend reversed on March 28th, as the price entered a correction phase, forming what seems to be a falling wedge pattern. Since breaking out of the wedge, SUI has been consolidating within a range.
Analyst Jonathan Carter shared an optimistic tweet about a theory regarding the SUI price. He suggested that if the price broke out of the consolidation range, the short-term target could be $1.45, with additional targets at $1.72, $1.95, and $2.15.
However, recently witnessed dips in BTC (7-day performance), if BTC continues to fall, the SUI asset could drop to $0.90, potentially leading to further declines to $0.75, $0.60, and $0.50.
Overall, technical indicators are bearish due to the influence of BTC. The 50-day and 200-day EMAs are exerting downward pressure on the price.
Additionally, the MACD histogram is narrow and below the zero line, while the RSI flashed at 41.96, below the median line, and facing rejection from 14-SMA at 47.19.

the spike surges stronglyAn analyst, Crypto Tony, Tweeted with the bullish sentiment on the X platform that In SUI a spike has taken place out of a support level on the daily chart.
Correspondingly, based on the analyst tweet, the SUI asset daily chart displays bullish strength in the short term. Likewise, the MACD shows a bullish cross, with an increasing histogram in SUI at 0.0281, and the RSI flashed at 48.00. It displayed that the SUI crypto is not losing steam yet and could continue to jump higher in future sessions.
Therefore, if the spike surges strongly, the next target for the SUI price could be to reach the above levels, such as $1.40 and $2.10.
On the contrary, if the SUI crypto price fails to sustain above the $0.90 level, it could also decline further.

Sui Crypto Recovers From Oversold Zone: Can It Stage a Comeback?Sui Crypto Recovers From Oversold Zone: Can It Stage a Comeback?
The RSI and 14 day SMA line has rebounded from the oversold territory, suggesting a shift towards positive market sentiment.
SUI crypto seemed to be bouncing off support levels, gearing up to tackle the next resistance level.
SUI crypto appears to be rallying from its support levels, preparing to confront and potentially surpass the forthcoming resistance level. This movement indicates a growing bullish momentum among traders.
The overall market's rebound has propelled SUI cryptocurrency upwards, safeguarding it from hitting its annual lows. Since April, SUI has experienced a significant price drop, falling beneath the crucial 50-day and 200-day Exponential Moving Averages (EMAs).
The latest market downturn has sparked a revival, injecting optimism among investors. Yet, the cryptocurrency requires substantial gains to fully recuperate.
RSI Indicator Points A Recovery From An Oversold region!
At the moment of writing, the Relative Strength Index (RSI) was positioned at 41.51 points, while the 14-day Simple Moving Average (SMA) was near 32.18 points. Both indicators have ascended from the oversold territory, signaling the formation of a favorable market condition.
Additionally, a bullish crossover between the RSI and SMA lines has been noted, which could indicate the potential for the bullish trend to persist. Nonetheless, the 50-day and 200-day Exponential Moving Averages (EMAs) might serve as barriers, potentially restricting any further increases in price.
Will Bulls Hold the Line at $1, or a Further Downturn Looming?
From a price perspective, SUI crypto has been hovering around a critical and psychologically significant zone, the $1 mark, which also represents its lowest value for the year.
Despite a consistent decline from higher price points, SUI found support at this level and demonstrated an upward movement, suggesting active buying interest at these lower prices.
Nonetheless, buyers must enhance their purchasing volumes to effectively safeguard the $1 threshold. Currently, the short-term trend remains uncertain.
Should the bulls successfully maintain the $1 mark and the annual low, there's potential for SUI to pivot and recover previous losses. Conversely, if they are unable to sustain this level, the cryptocurrency could face a steep downturn, potentially falling beneath the $1 mark.
Conclusion.
SUI crypto has been showing signs of a bullish trend, rallying from support levels and aiming to break through resistance. The market's recovery has prevented it from reaching new lows, despite falling below key EMAs since April.
Furthermore, The RSI and SMA indicators suggest positive momentum, but the 50-day and 200-day EMAs may limit gains. SUI's fate hinges on maintaining the $1 level; success could lead to recovery, while failure might result in a significant correction below this crucial psychological threshold.
