$SUI JUST ENTERED ITS DO-OR-DIE ZONE CRYPTOCAP:SUI JUST ENTERED ITS DO-OR-DIE ZONE AND THE WEEKLY CHART IS SCREAMING A REVERSAL SETUP
Everyone is panicking at the dump…
But nobody is seeing what actually happened on the HTF:
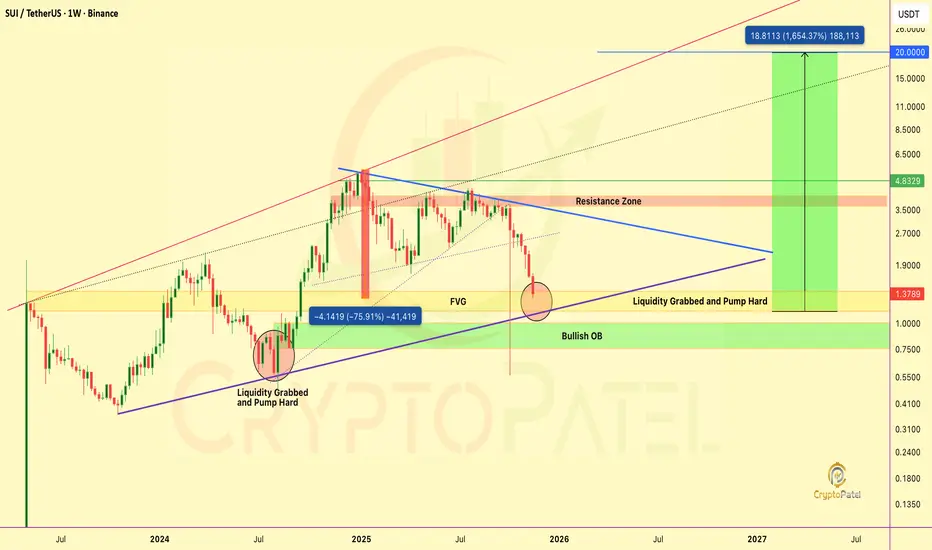
🔹 Massive Liquidity Grab Completed — identical to the 2024 bottom pattern.
🔹 Price nuked directly into FVG + Bullish Order Block.
🔹 Strong rejection wick = smart money accumulation confirmed.
🔹 Macro trendline STILL intact. Structure STILL bullish.
But let’s be Honest:
👉 Market condition is extremely worst right now.
👉 All altcoins dumped hard.
👉 CRYPTOCAP:SUI is –75% down from its Jan 2025 ATH… 10 months of pure bleeding.
Still, the chart is loading something big.
Here’s my IMO approach:
🔹 Accumulation Zone 1: $1.35 – $1.15
🔹 Accumulation Zone 2: $0.90 – $0.75
⭐ Don’t try to buy once.
⭐ No one knows the exact dip.
⭐ Smart way = accumulate slowly inside these zones.
Strong bounce potential sits exactly from the FVG → Bullish OB confluence.
If SUI breaks $4.8 resistance?
Targets: $5 → $10 → $20
IMO one day CRYPTOCAP:SUI will hit $20 easily.
But of course, Not financial advice. DYOR before investing.
Trade ideas
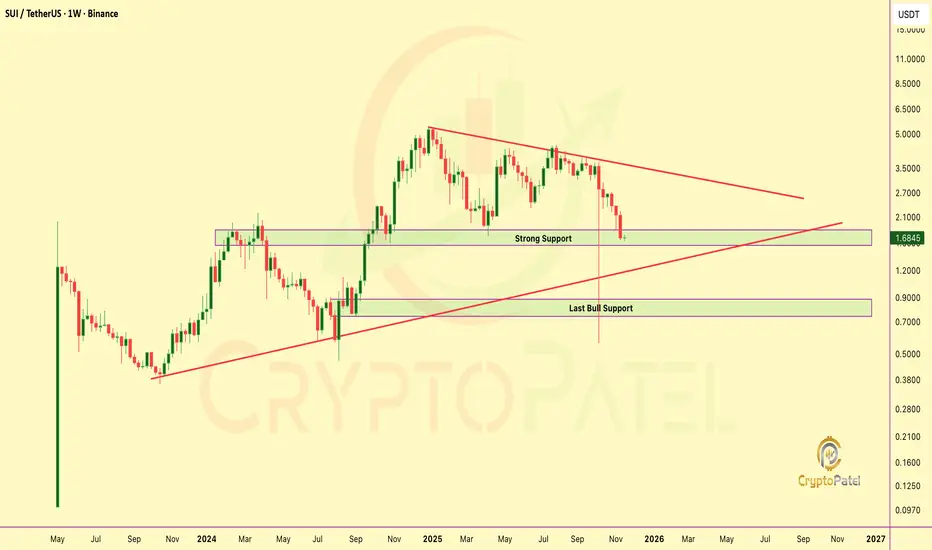
$SUI $1.66: The Liquidation Event That Just Printed the Next CycCRYPTOCAP:SUI Sharp ~70% Drawdown to the $1.66 zone has triggered broad Capitulation, with sentiment flipping decisively risk-off.
This is market structure: forced liquidity, weak-hand exits, and a reset in positioning after an overextended leg.
But historically, deep corrective sweeps often mark the final stage before trend re-acceleration. The $1.70–$1.00 range is emerging as a high-conviction accumulation pocket for investors with longer time horizons.
Should liquidity rotate back into high-beta assets later this cycle, a re-pricing toward the $10 region stays firmly on the Table.
In Crypto, Volatility Punishes Impatience and Rewards Discipline.
NFA & DYOR
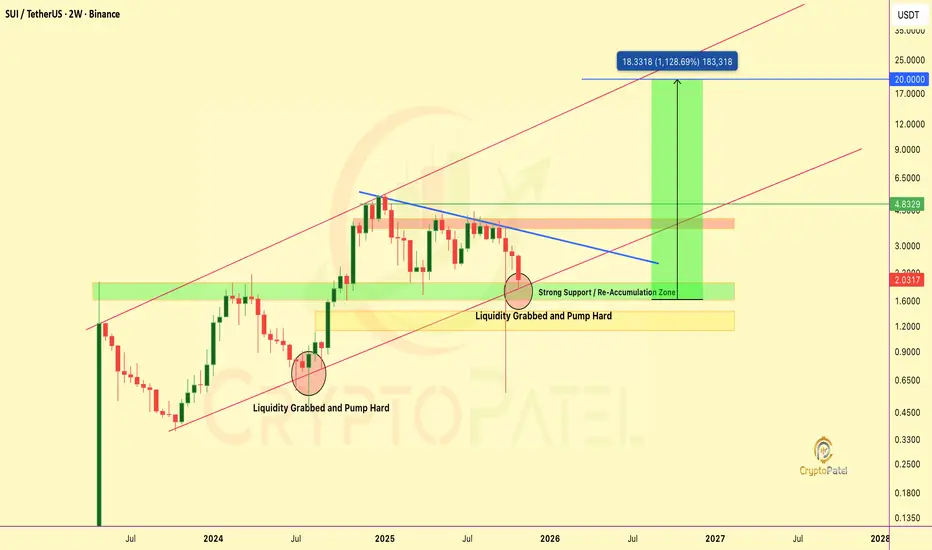
SUI– Breakout Setup Forming, Bulls Eyeing a Move Toward $20SUI/USDT – Breakout Setup Forming, Bulls Eyeing a Move Toward $20
SUI is building a strong re-accumulation base after months of correction. The $1.6–$2 demand zone continues to attract heavy buying interest, the same zone that triggered the last major rally.
Technical Highlights:
✅ Multiple liquidity grabs with strong rebounds
✅ $1.6–$2 zone acting as key accumulation area
✅ Descending trendline compression nearing breakout
✅ Structure remains bullish above $1.6
A confirmed breakout above the descending trendline could launch SUI into a high-momentum phase, targeting higher resistances.
Upside Levels: $4.8 / $10 / $20 – Macro channel target
Accumulation View:
Smart money is active below $2, positioning early before expansion. As long as $1.6 holds, the structure favors a bullish continuation.
High compression. Low noise. When this trendline breaks, volatility will speak loud. NFA & DYOR
Will SUI/USDT hit $20 in current bull market or future?SUI Testing Final Demand Zone: Reversal Imminent?
SUI is currently testing a major re-accumulation zone around $2.1 – $1.8, which previously acted as a strong demand area.
A liquidity grab below this level could trigger a sharp reversal, similar to the last time price swept lows before a massive rally.
The structure remains valid as long as this zone holds.
Once price reclaims the $2.7–$3.0 resistance, momentum could shift strongly bullish, targeting the $4.8 zone, and eventually the $20 macro target if the trend continues.
Support: $2.1 – $1.8
Resistance: $2.7 / $4.8
Macro Target: $20
Of course, NFA & Always DYOR

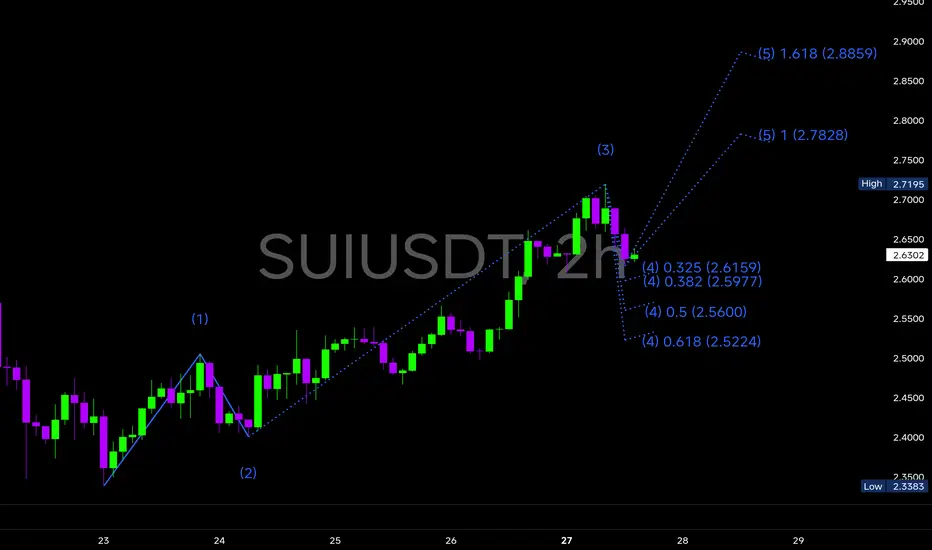
$SUI continues to follow our previously projected bullish pathCRYPTOCAP:SUI continues to follow our previously projected bullish path, showing impressive technical alignment across both Elliott Wave structure and MA confluences.
🔹We’re currently in Wave 4 correction after completing an impulsive Wave 3 rally that peaked around 2.71.
🔸Wave 4 retracement appears to be stabilizing between the 0.382 (2.59) and 0.5 (2.56) Fibonacci zones — a healthy correction zone before the next push.
🔹If the structure holds, Wave 5 could extend to 2.78 (1.0 Fib) and 2.89 (1.618 Fib), aligning perfectly with our previous resistance at 2.9–3.0.
This continuation pattern signals that bulls are still in control, consolidating before another potential breakout.
💡 Key Technical Levels
Support zones: 2.56 / 2.48
Resistance zones: 2.78 / 2.89 / 3.01
Short-term bias: Bullish
Trend structure: Higher highs and higher lows forming — early signs of trend continuation.
CRYPTOCAP:SUI is shaping up for a potential Wave 5 breakout.
If price holds above 2.55–2.60, the rally could extend toward 2.89–3.00, where both Elliott projection and MA200 converge.
However, if 2.48 breaks down, we may see a temporary pullback before resuming bullish structure.
Volume confirmation will be key — once momentum spikes, this could be the final impulsive leg of the short-term uptrend.
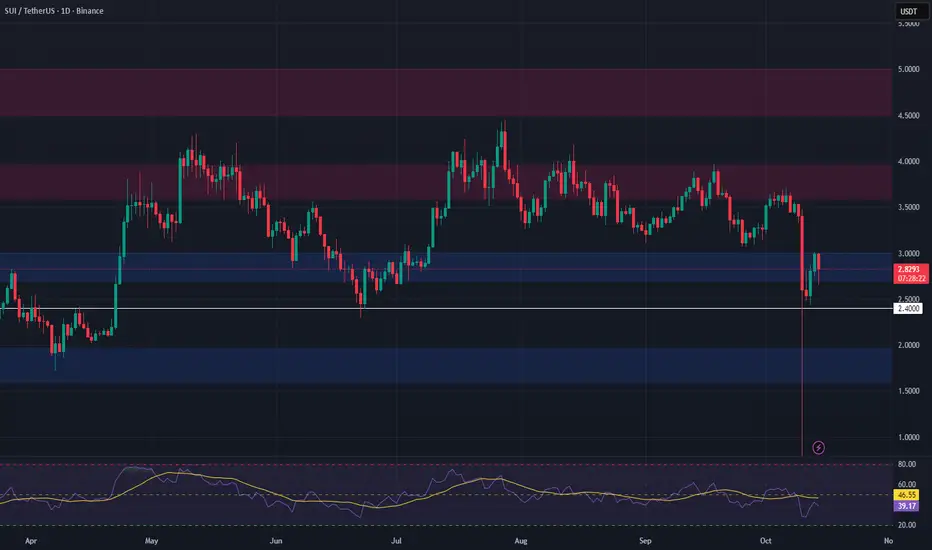
SUI – Swing Trade Setup from Key Support ZoneSUI is currently trading in a major support zone between $2.70 and $3.00, a level that has previously acted as a strong demand area. The price is consolidating here, and this could offer a high-probability long opportunity for swing traders watching for a potential bounce.
📈 Entry Zone: $2.70 – $3.00
🎯 Take Profit Targets:
• TP1: $3.60 – $3.95
• TP2: $4.50 – $5.45
🛑 Stop Loss: $2.40
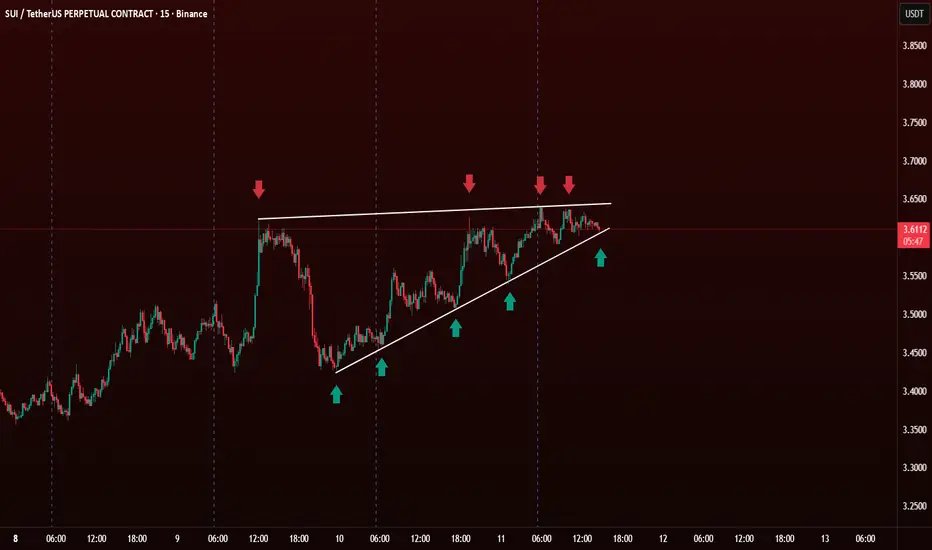
Ascending Triangle Pattern in Technical Analysis The Ascending Triangle is a bullish continuation pattern. It forms when the price creates higher lows (🔼) while facing consistent resistance at the same horizontal level (🔴).
🧐 How to Identify It
Flat Resistance Line 🔴
Price hits the same level multiple times and gets rejected.
This creates a horizontal line on top.
Rising Support Trendline 🔼
Each dip forms a higher low, indicating buying pressure.
Connect the swing lows with a rising trendline 📈.
📊 How to Trade It
Entry : Breakout Entry: Enter when price breaks and closes above the resistance line with high volume 💥.Conservative traders wait for a retest of the breakout zone (resistance becomes support).
Target : Measure the height of the triangle and project it upward from the breakout point.
Example: If triangle height = $0.30, add $0.30 above breakout.
Stop Loss : Below the last higher low 🔽 Or slightly below the triangle support trendline 📉
BINANCE:SUIUSDT.P
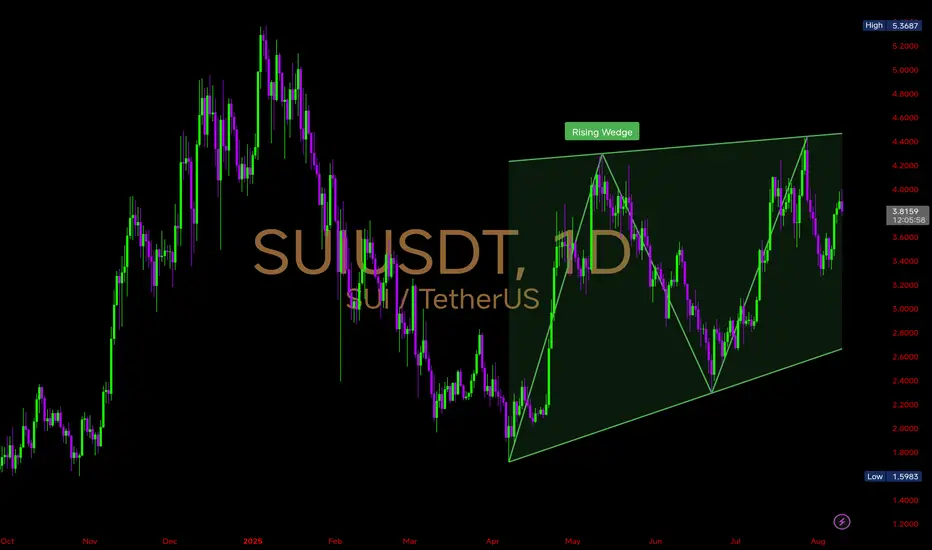
$SUI Daily Chart Analysis CRYPTOCAP:SUI Daily Chart Analysis
Price is currently trading inside a Rising Wedge pattern on the 1D timeframe — a structure that often signals potential trend exhaustion if broken to the downside, but can still extend higher within the channel before a breakout.
🔹Support: The lower wedge trendline has acted as a strong demand zone since April, with each test triggering a bounce.
🔸Resistance: The upper wedge trendline has repeatedly capped rallies near the $4.20–$4.40 zone.
🔹Current Price Action: #SUI Trading around $3.81, mid-range of the wedge, showing balanced buyer–seller pressure.
🔸Momentum: Higher lows are still intact, suggesting bullish structure until the lower wedge breaks.
POSSIBLE SCENARIOS
1️⃣ Bullish: Price pushes toward the $4.20–$4.40 resistance; a breakout above could target the $5+ zone.
2️⃣ Bearish: A breakdown below the lower wedge support (~$3.00) could trigger a deeper pullback toward $2.60–$2.40.
Watch for decisive daily candle closes near wedge boundaries — that will dictate the next major leg.
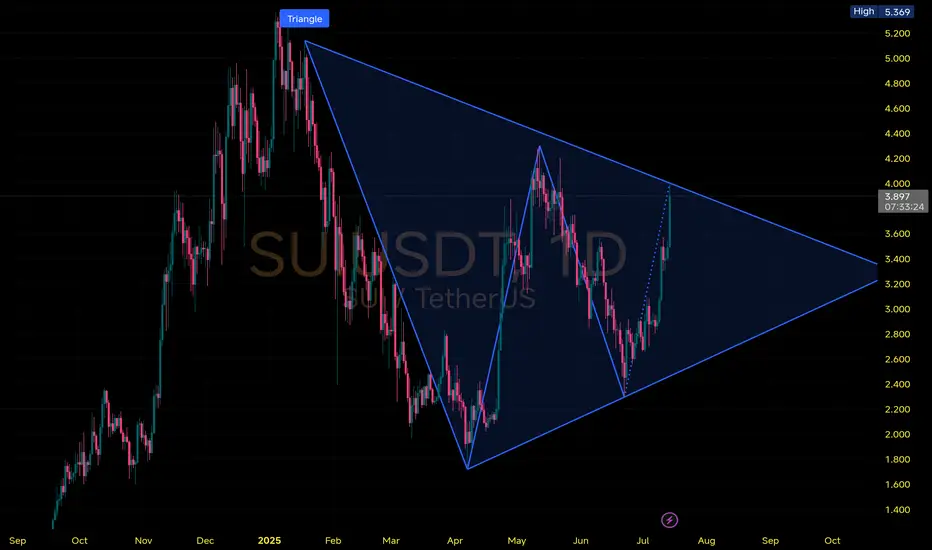
$SUI Daily Chart Analysis
Price is tightening within a large symmetrical triangle pattern on the 1D chart, signaling a major move brewing in the coming weeks.
🔹Price currently pushing toward upper trendline resistance near $4.00
🔸Upside Potential: Break above $4.20 could trigger a rally toward $5.00–$5.30+
🔹Pattern target (if breakout confirmed): roughly $6.00+ based on pole height
🔸Support at $3.20 is key triangle base
🔹Breakdown below = bearish continuation risk toward $2.50
#SUI is coiling within a triangle. A breakout is imminent — watch closely for a decisive move above or below structure.
BINANCE:SUIUSDT
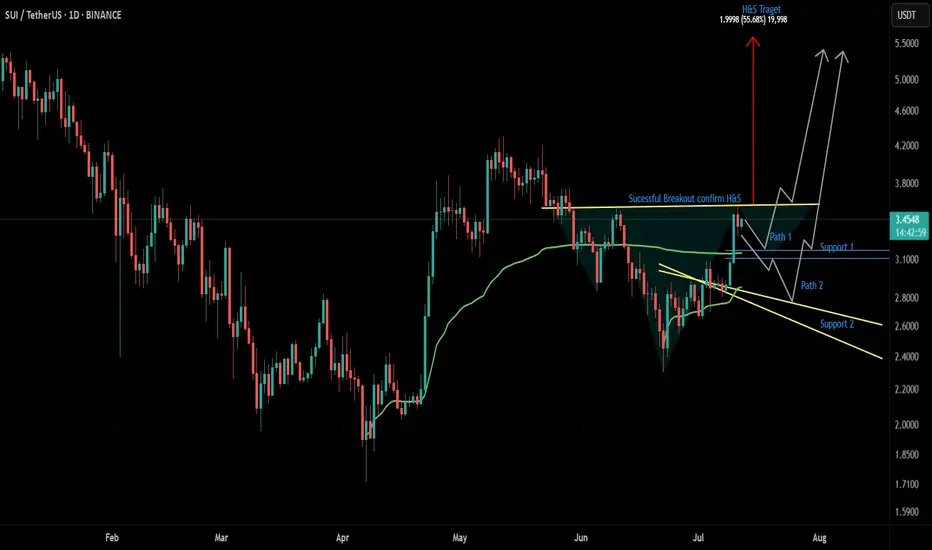
$SUI Inverse H&S FormingA large inverse Head & Shoulders pattern appears to be forming on $SUI. The $3.1758 zone looks like a solid area to long — potentially marking the bottom of the second shoulder. If a deeper correction occurs, I'm also watching the $2.7473 level for another possible long entry.
My plan is to pre-position by longing near the second shoulder. Once $3.5902 breaks and we get a successful retest, the pattern would be confirmed. From there, a 50% move up toward the neckline target of $5.6252 could follow.
This is not financial advice. Trade at your own risk.
Where do we go from here?SUI looks like it's on its on it's way up.
its either SUI or ME.
If Bitcoin reaches the 112,000 range, then we will see significant volumes flow into SUI.
It could easily go above 3.5.
This is just my opinion. Do your own research and drawings.
Feel free to leave a comment. I'd love to hear your analysis.

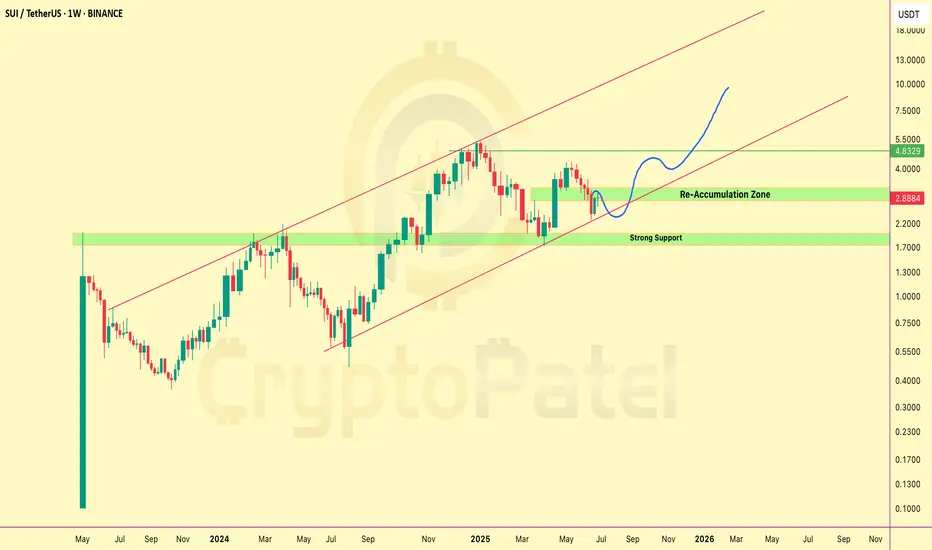
SUI to $10, $20.. Even $50? The Setup Looks Insane-Weekly ChartSUI is trading around $2.89, currently sitting in a key re-accumulation zone after a correction.
Trend: Still holding inside a long-term uptrend channel — structure remains bullish.
Support Zones:
🔹 $2.00–$2.50 is a strong demand area
🔹 $1.70 is a critical support — bullish above this,
but if price breaks below, we may enter major bearish mode
What to watch: If SUI holds this zone and continues upward:
🔹 Short-term target: $5/$10
🔹 Long-term potential: $20 → $50
I’m watching the $2.50 zone closely for possible long entries.
This could be a solid long-term opportunity if support holds.
NFA. DYOR.
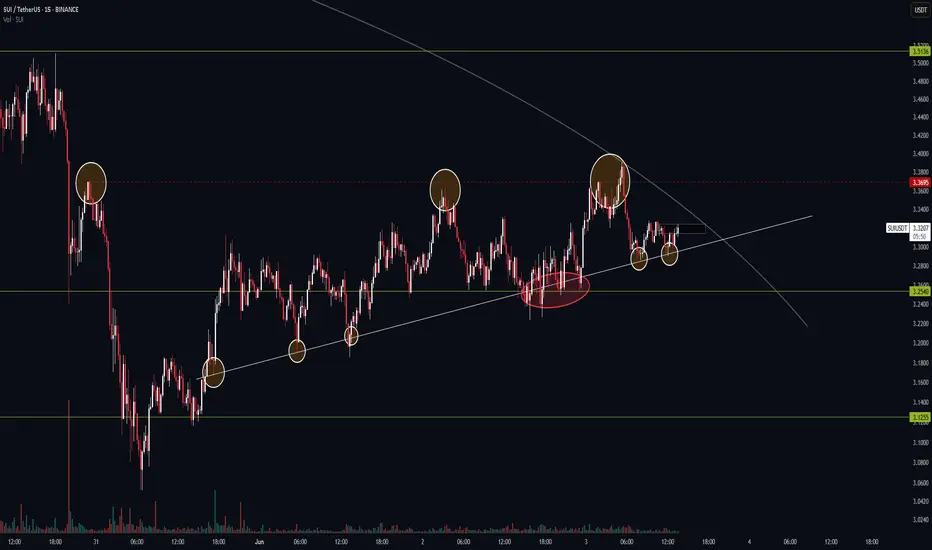
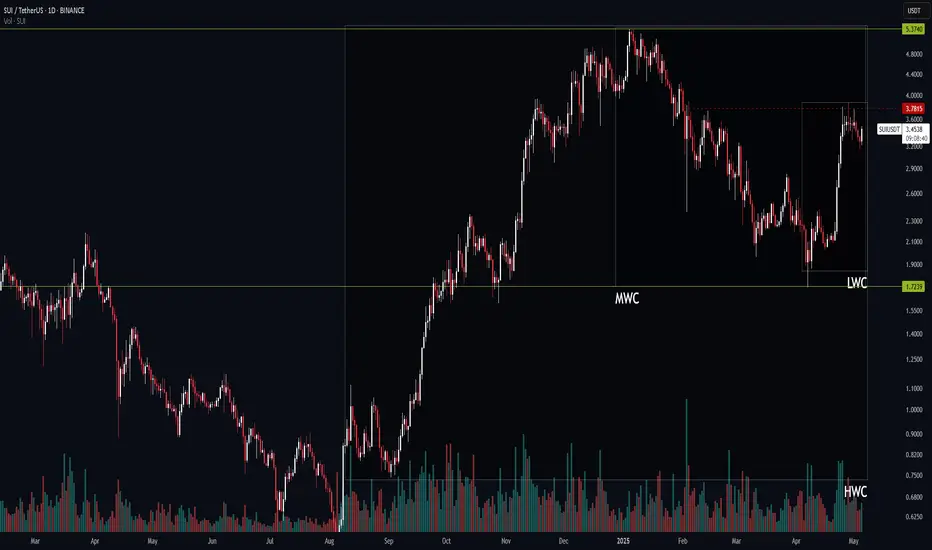
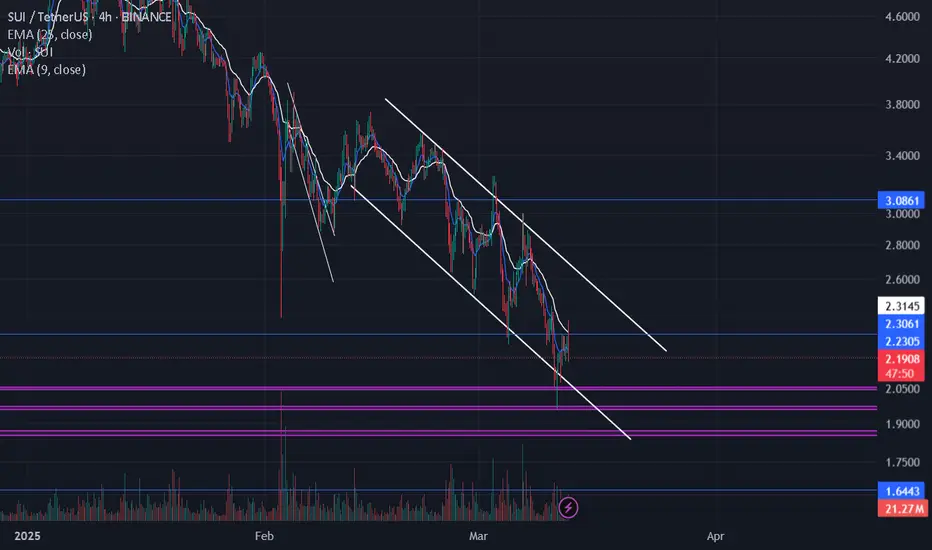
Trendline vs. Resistance — SUI’s Battle on the 15-Minute ChartBINANCE:SUIUSDT
📊 Cycle Structure:
HWC (Higher Wave Cycle): Bullish 🔼
MWC (Middle Wave Cycle): Bearish 🔽
LWC (Lower Wave Cycle): Bullish 🔼
📌 This mixed structure creates a conflicting environment — higher timeframe trend is bullish, but MWC acts as a drag, preventing smooth upward momentum.
📉 Market Structure:
Currently, price is consolidating with a slight bullish tilt. BTC itself is in a very uncertain state, but its cycles are still bullish — meaning SUI might act unpredictably.
We’re looking at two main setups here:
Long Entry: On clean breakout of key resistance.
Short Entry: On breakdown of the descending trendline.
🔸 The 15M descending trendline has already seen 6 touches.
✅ A breakdown could trigger a short setup — but since it's on a low timeframe, don’t expect a massive dump.
🎯 First TP zone for shorts: the 32540 support — a solid zone for partial profit-taking.
🟢 My Personal Preference — Long Bias:
I'm leaning toward the long side for a few reasons:
HWC and LWC are both bullish.
BTC.D just rejected hard from its channel top — signaling altcoins like SUI may perform better.
🔹 32695 has seen 3 touches already, with the third one being a fakeout.
✅ If we see weak selling pressure and strong volume on the next touch, it can be a valid long trigger.
🎯 Potential upside target: the 35135 resistance zone — where a decent reaction is expected.
📌 Want a specific coin or pair analyzed? Drop it in the comments — I’ll pick a few and break them down.
⚠️ Without proper risk management, you're just a ticking time bomb.
— PXA | Structure-Based Precision Trading
$SUI Looks Super Bullish, But There’s a Catch!CRYPTOCAP:SUI Looks Super Bullish, But There’s a Catch!
SUI Network is heating up in this bull market, and yes — it could potentially reach $10… even $15–$20 long-term! 🔥
But here’s something you need to know 👇
🔓 Today, 44M CRYPTOCAP:SUI (~$143M) tokens got unlocked — that’s 1.32% of the circulating supply.
▶️ Only 33.87% of total supply is unlocked — meaning 66.13% is still locked with early investors and the team.
▶️ That’s ~$140M worth of tokens unlocking every month. This could put serious sell pressure on the price!
✅ I'm still bullish long-term, already holding from $0.50–$0.60.
▶️ If CRYPTOCAP:SUI drops to around $2.80, I’ll be buying more.
Short-term dip = Long-term opportunity?
Be smart. Track unlocks. Buy low. Think long.
NFA & DYOR

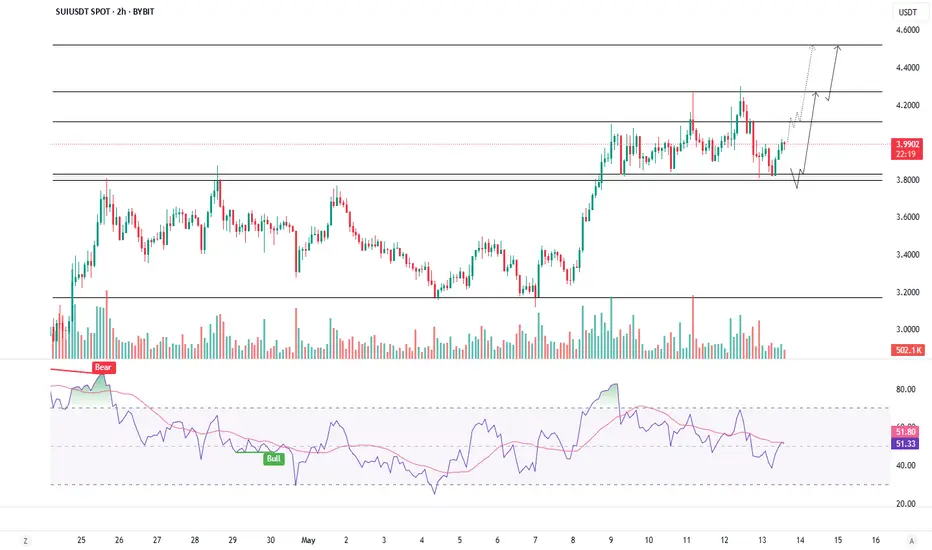
SUIUSDT HOLDING STEADY - BIG MOVE AHEAD?Symbol - SUIUDST
SUIUSDT has entered a consolidation phase within the broader context of an emerging bullish trend. Current price action highlights a zone of interest and a potential trigger area that merit close monitoring.
Market sentiment toward SUIUSDT remains constructive. The formation of a rising trend is being reinforced by Bitcoin's ongoing strength and a relatively supportive macro and fundamental backdrop.
From a technical perspective, SUIUSDT is consolidating within a range bounded by resistance at 4.1100 and support at 3.8110 Notably, a substantial liquidity pool exists below the 3.8110 support level, which has yet to be tested. This suggests a high likelihood of a false breakdown occurring before a potential continuation of the upward trend. However, should bullish momentum accelerate, buyers may defend current levels more aggressively, potentially leading to a breakout above the 4.1100-4.2750 resistance zone and subsequent price stabilization above those levels - indicating further upside potential.
Key Support Levels: 3.8110, 3.6670
Key Resistance Levels: 4.1100, 4.2750
The broader cryptocurrency market, led by Bitcoin, appears to be undergoing a liquidity gathering phase as part of a local correction within a bullish trend structure. While a brief wave of liquidations occurred yesterday, there is currently no substantive evidence of a broader market downturn. In an ideal technical scenario, SUIUSDT could retest support around 3.8110, form a false breakdown, and subsequently resume its upward trajectory.
SUI Daily Timeframe – A Big Move Is Loading!BINANCE:SUIUSDT
🧠 Market Cycle Overview:
HWC (High Wave Cycle – Higher timeframe): Bullish 🔼
MWC (Medium Wave Cycle – Medium timeframe): Bearish 🔽
LWC (Low Wave Cycle – Lower timeframe): Bullish 🔼
When the higher and lower timeframe cycles are bullish but the mid-term is bearish, it usually means the market is in a resting phase. This kind of setup can often give us a golden long opportunity! 🎯
📊 Price Action & Volume:
For the past 12 days, SUI has been ranging with decreasing volume. This drop in volume is often a sign that a big move is near. Just be careful — in this phase, the market might make small fakeouts to hit stop-losses.
🔻 Short Setup:
Right now, I’m not opening any short positions until I see the next clear leg.
I wouldn’t recommend shorting either, since it’s going against the main cycles.
But as always, stick to your own plan — this is just my view, not a signal. 👀
🔺 Long Setup:
The $3.7815 level was the last point where price reacted and dropped.
If we get a strong breakout above that, it’s a valid long entry. 🚀
✳️ Since we’re analyzing on the daily timeframe, the confirmation candle for any breakout should close on at least the 1H (1-hour) or preferably the 4H (4-hour) timeframe to be considered reliable.
🎯 Summary:
The market is in a correction, but the primary direction is still bullish.
Long setups are more favorable — just wait for breakout confirmation and manage your entry with patience.
"⚠️ Without proper risk management, you're just a ticking time bomb!"
— PXA 📊
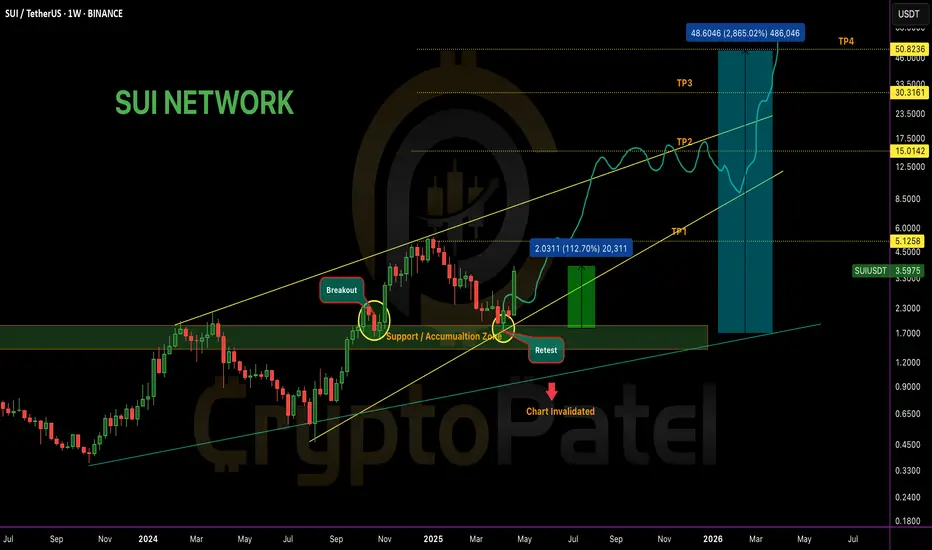
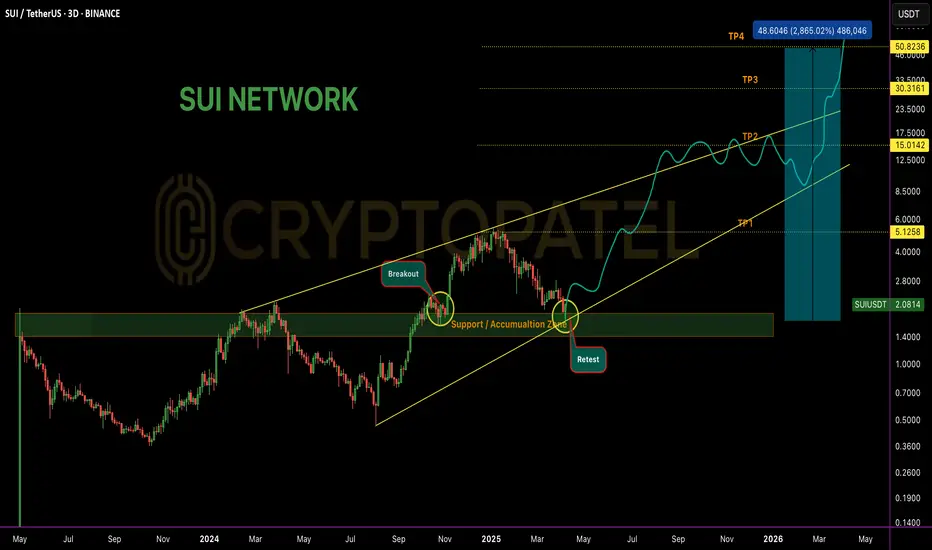
Will SUI hit $50 in Comming Years?SUI NETWORK MEGA BREAKOUT ALERT! 🚀
🟢 Chart Analysis Update:
• Breakout confirmed from the long-term accumulation zone.
• Retest successful — price bounced perfectly from the previous support zone.
• Current price: $3.59 (up +112% From our recent bottom price Entry)
• Next major targets:
🎯 TP1: $5.12
🎯 TP2: $15.01
🎯 TP3: $30.31
🎯 TP4: $50.82
Potential upside: 2,865%+ if the full move plays out!
🔔 Key Points:
Strong support holding at $2.00 zone.
Chart remains valid as long as price stays above accumulation zone.
Invalidation only if SUI breaks below $1.80 zone.
If momentum continues, SUI could enter a parabolic run in the coming months. Eyes on this rocket! 🚀
#SUI to $50 in the Future? Which is 25x-30x ?#SUI to $50 in the Future?
I won’t tell you why — because that’s where your research comes in.
But here’s a clue:
▪️ Accumulation Zone: Below or around $2
▪️ Patience = Potential
▪️ Come back and thank me in 3–4 years.
Not Financial Advice — Always DYOR.
SUI forming Bullish wedge patternSui is currently moving in trendline forming bullish wedge pattern. It needs to break this trendline with good volume for upward movement . Wait for trendline breakout confirmation before taking entry.
Will $SUI hit $10 in Current Bull Market?Will CRYPTOCAP:SUI hit $10 in Current Bull Market?
Key support zone: $2.50-$2 – Holding this level is crucial for a potential breakout toward $10.
Price action suggests a strong bounce from this demand zone, making it a strategic re-accumulation area for high-R:R setups.
#SUI #Altcoins

Sui expecting parabolic momentumSui expecting parabolic momentum. Keep accumulating it. Will give small small trades in the post. So follow for regular trades. I am expecting targets till 11. But it wont come overnight. Will try to capture the moves in small small futures trades with low leverage & SLs.

Long-Term Investment Portfolio 2025: SUIUSDT (1000% from 1$)Long-Term Investment Portfolio 2025: SUIUSDT (Target 1000% from $1)
🌟 Maximize Returns with SUIUSDT Using RainBow MG3! 🌟
🌍 Market Overview:
SUIUSDT is a high-potential cryptocurrency for long-term investors, offering 10x-15x returns (up to 1000% growth) if purchased around the $1 range. By leveraging the RainBow MG3 indicator, investors can identify strategic BUY entries within critical price zones.
📊 Trade Plan:
📌 Entry Point:
Accumulate within the range of $2.7 - $4.5, or
Set alerts using RainBow MG3 to time optimal entry points.
🎯 Target:
10x - 15x returns for positions acquired from $1, aiming for significant profit potential.
⏳ Hold Time:
6 months or longer, aligned with long-term growth trends and major cycles.
🔍 Strategy Insights:
RainBow MG3 Precision:
Use RainBow MG3 to track and confirm BUY signals within the specified accumulation range for precision timing.
Capital Allocation:
Deploy capital incrementally (DCA) within the $2.7 - $4.5 range to mitigate volatility risks while maximizing accumulation potential.
💡 Note:
This analysis is for informational purposes only and is not financial advice. Always DYOR before making investment decisions.
🔥 SUIUSDT offers explosive growth potential – Secure your position now! 🔥

SUI
The flagpole is a crucial part of the flag pattern in technical analysis. It represents a sharp move in price, either up or down, followed by a consolidation phase that forms the "flag" part of the pattern1. Here's a quick breakdown:
Flagpole: This is the initial sharp move in price. For a bullish flag, it's an upward move; for a bearish flag, it's a downward move1.
Flag: After the flagpole, the price moves sideways in a more narrow range, forming the flag. This consolidation phase is where buyers or sellers take a breather before the next move.
Breakout: The breakout occurs when the price moves out of the flag in the direction of the initial flagpole move.
