Option Trading Strategies Basic Directional Option Strategies
1.1 Long Call Strategy
A long call involves buying a call option with the expectation that the underlying asset will rise significantly before expiration.
Market View: Bullish
Risk: Limited to premium paid
Reward: Unlimited
Best Used When: Strong upward momentum is expected
This strategy benefits from rising prices and increasing volatility. Time decay works against the buyer, so timing is crucial.
1.2 Long Put Strategy
A long put involves buying a put option expecting the price to fall sharply.
Market View: Bearish
Risk: Limited to premium paid
Reward: Substantial if price falls sharply
Best Used When: Strong downtrend or breakdown expected
Long puts are also used as insurance against falling markets.
Trade ideas

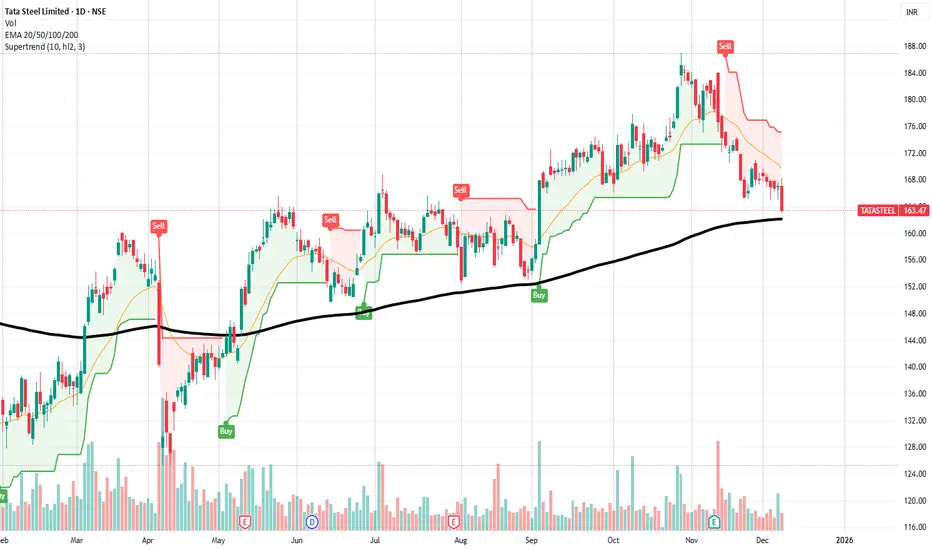
Tata Steel | 200 EMA Support + MACD Bullish Setup | Perfect std.Tata Steel has entered a high-probability reversal zone, combining multiple technical signals that traders often use to identify strong opportunities.
1. Price Sitting Exactly on 200 EMA (Major Trend Support)
The stock has reached the 200 EMA, a long-term trend indicator that acts as strong dynamic support.
From the chart, the last 3 touches to the 200 EMA (May, June & September) resulted in sharp upward reversals.
This increases the probability that buyers may step in again at this level.
------------------------------------------------------------------
2. MACD Close to Bullish Crossover
The MACD histogram is reducing red bars and is moving toward the zero line, indicating that selling pressure is cooling down.
A bullish crossover near a major support often marks the beginning of an upswing in momentum.
------------------------------------------------------------------
3. Stock Appears Short-Term Oversold
Price is stretched away from the short-term moving averages (20 & 50 EMA), and recent candles show slowing selling pressure.
This supports the idea of a bounce or trend reversal from the current zone.
------------------------------------------------------------------
4. Supertrend Still in Sell but Losing Momentum
Supertrend remains red, but the fall has slowed significantly.
A close above 170–172 will flip Supertrend to Buy, confirming the reversal.
Support Zones
162–164 → 200 EMA support zone
158 → Last horizontal support (critical)
Resistance Zones
170 → Short-term resistance (20 EMA)
176–178 → Strong reversal confirmation zone
185 → Major swing resistance
📈 Possible Bullish Scenario (Primary View)
If the price holds above 162–164 and MACD turns positive:
Targets: 170 | 176–178 | 185 | Stop-loss: Below 160 (Daily close)
📝 Notes (Important for Traders)
This is a technical analysis idea, not a buy/sell recommendation.
Risk management is important: adjust SL according to your trading style.
Building a Trader’s Mindset: Patience, Consistency, Adaptability1. Patience – The Foundation of Professional Trading
Patience is not simply “waiting.” It is disciplined inaction until the right opportunity forms. Impatient traders overtrade, chase moves, react emotionally, and burn capital. Patient traders act only when their edge is present.
Why Patience Matters
Markets are mostly noise. True high-probability setups appear occasionally. A patient trader understands that success comes from waiting for conditions that match their plan. The goal is not to trade more, but to trade better.
Forms of Patience in Trading
Waiting for the right setup
You may scan 50 charts and take only one trade. Professional traders understand that most days are not meant for big profits.
Patience in entry execution
Many traders jump early due to fear of missing out (FOMO). But waiting for confirmation, retests, or volatility cooling often determines whether a trade becomes a winner.
Patience in holding a winning trade
Most traders cut winners early. Patience helps you let the trend unfold and ride profits instead of booking small gains.
Patience during drawdowns
A losing streak is temporary, but the emotional urge to “make back losses fast” destroys accounts. Patience helps you reset mentally.
How to Develop Patience
Trade fewer setups but master them deeply.
Use alerts, so you don’t watch charts constantly.
Define your conditions clearly: “I enter only if X, Y, and Z align.”
Practice delayed gratification—a psychological muscle built over time.
Reward process, not outcome—celebrate discipline, not luck.
Patience builds emotional stability, which becomes the core of all other trading skills.
2. Consistency – The Engine That Drives Growth
Consistency is the ability to follow your process repeatedly—same logic, same rules, same risk control—every single day. A consistent trader becomes predictable to themselves, which makes performance measurable and improvable.
Most traders fail not because their strategy is bad but because they apply it inconsistently.
Why Consistency Matters
Markets produce random short-term outcomes. A strategy may win today and lose tomorrow. Consistency ensures that over time your edge plays out. Without consistency:
Risk fluctuates and results become unpredictable.
Emotions dominate decision-making.
You cannot improve because you don’t know what you did right or wrong.
Your trading becomes luck-based rather than skill-based.
Pillars of Consistency
1. A Clear Trading Plan
A plan defines:
Entry rules
Exit rules
Stop-loss and target criteria
Position size
Market conditions you trade
Without a plan, consistency is impossible.
2. Risk Management Discipline
Risk per trade should remain consistent—usually 1–2% of capital. Changing risk based on emotion leads to uneven results.
3. Time and Routine Consistency
Professional traders have fixed routines:
Pre-market preparation
Chart review
Journaling
Performance tracking
Routine eliminates randomness in behavior.
4. Consistent Emotional Regulation
Traders must behave consistently regardless of:
A big win
A big loss
A news event
A volatile session
This detaches performance from temporary emotional states.
How to Build Consistency
Journal every trade—entry, reason, emotions, outcome.
Review weekly—identify patterns of mistakes.
Automate repetitive tasks—alerts, screeners, watchlists.
Reduce strategy hopping—stick to one system for a long enough sample size.
Focus on incremental improvement, not perfection.
Consistency turns trading into a process-driven profession instead of a gambling activity.
3. Adaptability – Surviving and Thriving in Changing Markets
Markets evolve constantly. What worked in a trending market may fail in a sideways one. Adaptability enables a trader to evolve with conditions, update strategies, and stay relevant.
Why Adaptability Matters
Volatility changes.
Liquidity shifts.
Macro events impact trends.
Algo trading affects speed and structure.
Investor psychology evolves over time.
Rigid traders get left behind. Flexible traders stay profitable.
Traits of Adaptable Traders
Open-Mindedness
They are willing to test new ideas, adjust position sizes, or explore different timeframes when conditions shift.
Awareness of Market Context
Instead of forcing trades, they ask:
“Is the market trending, ranging, reversing, or consolidating?”
Ability to Evolve Strategies
Adaptable traders update systems using data, not emotion.
Emotional Flexibility
They accept being wrong quickly—cutting losses, not defending ego.
How to Develop Adaptability
Study multiple market environments: trending, range-bound, high/low volatility.
Maintain multiple tools (trend-following, mean-reversion, breakout strategies).
Regularly backtest and forward-test strategies.
Observe global macro events and their impact.
Keep a growth mindset—stay curious and upgrade skills.
Avoid rigid beliefs like “this stock must go up” or “this pattern always works.”
Adaptability is about changing when necessary while staying disciplined to core principles.
How These Three Traits Work Together
Patience + Consistency
Patience helps you avoid bad trades.
Consistency ensures you execute your good trades properly.
Together they create stable performance.
Patience + Adaptability
Patience lets you wait for the market to show its conditions.
Adaptability allows you to adjust once those conditions shift.
Consistency + Adaptability
Consistency provides structure.
Adaptability keeps the structure flexible enough to survive changing environments.
All Three Combined
A trader who masters patience, consistency, and adaptability:
Takes fewer but high-quality trades
Controls emotions
Stays calm during volatility
Maintains steady profits
Learns continuously
Avoids catastrophic losses
Improves year after year
This mindset separates professionals from amateurs.
Practical Daily Exercises to Build This Mindset
1. Pre-Market Exercise
Write down:
What setups you will trade today
What you will avoid
Maximum loss allowed
This reinforces patience and consistency.
2. Mid-Day Emotion Check
Ask:
Am I following my plan?
Am I trading emotionally?
Am I forcing trades?
This keeps behavior aligned.
3. Post-Market Review
Journal:
Trades taken
Mistakes
Improvements
Market conditions
This builds adaptability.
4. Weekly Reset
Analyze:
Win rate
Risk-to-reward
Emotional patterns
Strategy performance in current conditions
This helps you evolve with the market.
Conclusion
Building a trader’s mindset takes time. It requires unlearning impulsive habits, developing emotional intelligence, and aligning your behavior with long-term goals. Patience keeps you selective. Consistency keeps you disciplined. Adaptability keeps you relevant.
Trading is not about predicting the market—it is about managing yourself. When your mindset is strong, your strategy becomes powerful. When your emotions are controlled, your results become stable. Master these three mindset pillars, and your journey shifts from random outcomes to structured, repeatable success.

TATASTEEL 1 Day Time Frame 📌 Current status
Price is hovering around ₹166–167.
52‑week range: low ≈ ₹122.6, high ≈ ₹186.9.
✅ What This Means for Near‑Term Trading / Observation
As of now, the stock is in a neutral / consolidation phase — price sitting between support (~ ₹165) and resistance (~ ₹170–172).
A break below ~ ₹165 might open path toward ~₹163–164, or lower, depending on volume and market sentiment.
A break above ~ ₹170–172 — especially on good volume — could trigger upward movement toward ~₹180+ zones (with key watch on 52‑wk highs around ₹185–187).
Because we are closer to middle of the 52‑wk range rather than extremes, price volatility remains possible — so risk management (stop‑loss, position sizing) matters.

Part 1 Ride The Big Moves Types of Option Strategies
Options allow traders to combine multiple positions to create strategies based on volatility, direction, or time decay.
Here are some popular ones:
1. Buying Calls and Puts
The simplest form. Good for beginners and directional traders.
2. Selling Options
You earn premium.
Risk is higher, so proper strategy and stop-loss are needed.
3. Spreads
Involves buying one option and selling another.
Examples:
Bull call spread
Bear put spread
Credit spreads
These reduce risk and premium cost.
4. Straddle
Buying both call and put at the same strike.
Used when expecting big movement but unsure about direction.
5. Strangle
Similar to straddle but with different strikes.
6. Iron Condor
A non-directional strategy used to profit when the market stays in a narrow range.
Options allow both beginners and advanced traders to adjust risk, reward, and probability.

Global Market Shifts1. Technological Acceleration and Digitalization
Technology is one of the most powerful drivers of global market shifts. The acceleration of artificial intelligence, automation, blockchain, robotics, and data analytics is redefining industries from manufacturing to banking.
Automation has altered the cost dynamics of production, enabling companies to relocate certain activities back to their home countries despite previously outsourcing them to low-cost regions. This phenomenon, often referred to as reshoring or nearshoring, is driven by the desire for supply chain resilience and reduced dependency on global disruptions.
The digital economy has also enabled new business models. E-commerce, online services, cloud computing, and fintech innovations have created trillion-dollar markets and revolutionized consumer behavior. From remote work to digital payments, technology is not only transforming markets—it is reshaping the very structure of the global workforce and how companies operate.
Artificial intelligence has become a strategic asset for nations. Countries are competing to develop advanced AI capabilities, which has deep implications for productivity, defense, and global leadership. As AI integrates deeper into supply chains and decision-making, markets will continue to shift around countries with the most advanced digital infrastructure and innovation ecosystems.
2. Geopolitical Realignments and Trade Fragmentation
Global markets are increasingly influenced by geopolitics. Traditional alliances are being restructured, rivalries are intensifying, and economic power is becoming more multipolar.
The most notable geopolitical shift involves strategic competition between major powers—especially between large economies such as China, the United States, and other emerging regions. Trade wars, tariff battles, technology restrictions, and security concerns have introduced new uncertainties into global markets.
Countries are seeking strategic autonomy by diversifying their economic dependencies. This has resulted in the rise of regional trading blocs, bilateral agreements, and supply-chain partnerships based on political alignment rather than pure efficiency.
As global economic integration slows, companies must adapt to a fragmented trading environment where geopolitical risks directly impact currency markets, commodity prices, financial flows, and investment decisions.
3. Monetary Policy Shifts and Inflation Cycles
A major global market shift arises from changes in monetary policy, particularly from central banks in advanced economies. Inflation surges and interest rate cycles influence everything from asset valuations to consumer borrowing costs.
In recent years, inflation has resurfaced as a central challenge. Central banks responded with aggressive interest rate hikes, reshaping equity markets, bond yields, housing sectors, and currency movements.
Higher interest rates tend to strengthen currencies, reduce liquidity, increase the cost of capital, and cool down overheated markets. As rates rise or fall, global investors reallocate funds across emerging and developed markets.
These monetary shifts ripple through the world economy, affecting trade balances, debt sustainability, and foreign investment flows. Countries with high levels of external debt face heightened vulnerability when global liquidity tightens.
4. Supply Chain Reconfiguration
The global supply chain system that dominated the last few decades is undergoing significant transformation. For years, companies optimized supply chains for efficiency and low cost, relying heavily on global production networks.
However, recent disruptions—ranging from pandemics to shipping bottlenecks and geopolitical tensions—highlighted the fragility of hyper-globalized supply systems.
This has led to several structural shifts:
Reshoring: Bringing production back to home countries.
Nearshoring: Moving manufacturing closer to major consumer markets.
Friendshoring: Sourcing from politically aligned nations.
Multi-sourcing: Avoiding reliance on single suppliers.
Supply chains are becoming more diversified and resilient, but this transition increases costs in the short term. Markets are adjusting to a new reality where security and predictability often outweigh efficiency.
Industries like semiconductors, pharmaceuticals, EV batteries, and critical minerals are at the center of this supply chain revolution.
5. Energy Transition and Sustainability Trends
Another major global market shift is the transition from fossil fuels to cleaner energy sources. Climate change concerns, government mandates, and consumer expectations have accelerated the shift toward renewable energy, electric vehicles, sustainable manufacturing, and green finance.
Countries are investing billions in solar power, wind energy, hydrogen, and other low-carbon solutions. The energy transition is also reshaping commodity markets. Demand for oil may fluctuate, while demand for metals like lithium, cobalt, nickel, and rare earth elements is increasing rapidly.
Companies across all sectors are facing pressure to reduce emissions, adopt ESG (Environmental, Social, Governance) frameworks, and disclose carbon footprints. As sustainability becomes a competitive advantage, global capital is flowing towards greener projects.
This transition is not uniform. Some regions move faster while others rely on traditional energy sources. This creates a dynamic global landscape where new energy leaders emerge while others adapt gradually.
6. Shifting Consumer Preferences and Demographics
Global demographics are changing dramatically. Developed countries face aging populations, while emerging markets have young, expanding workforces. Consumption patterns are shifting accordingly.
Younger generations prioritize digital-first experiences, eco-friendly products, and personalized services. Meanwhile, rising middle classes in developing countries are driving demand for technology, healthcare, transportation, and modern retail.
The global consumer is becoming more interconnected yet more diverse. Companies must navigate cultural preferences, regulatory environments, and economic conditions across different markets.
These demographic forces have long-term implications, influencing everything from labor markets and productivity to healthcare demand and real estate trends.
Conclusion
Global market shifts are the result of multiple interconnected forces—technological innovations, geopolitical changes, monetary cycles, supply chain strategies, energy transitions, and evolving consumer behaviors.
Today’s world is moving away from a singular globalized model toward a more complex, multipolar system defined by resilience, regional alliances, and digital transformation. Understanding these shifts is essential for navigating investment decisions, business strategies, and policy development.
In this rapidly changing environment, adaptability, foresight, and innovation will define success for nations, companies, and individuals alike.

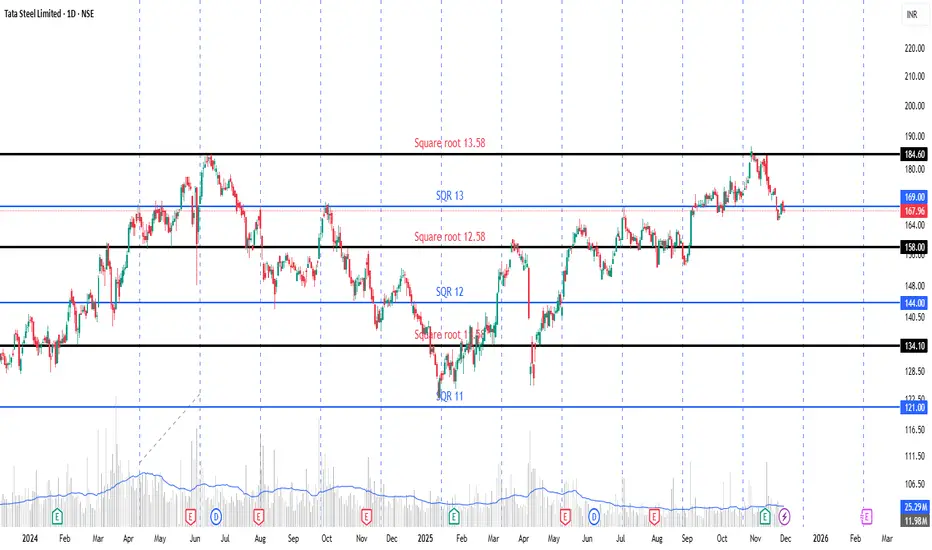
Gann's Square of Nine is one of the unique tools How to Use It in Trading (Step-by-Step Simplified)
Method 1: Find Support/Resistance from a Major High or Low
suppose you stock price is 100
Take a significant high or low price (e.g.,TATASTEEL all-time high was ~ 187/-).
Find the closest number in the Square of 9 (or enter the price into a Gann Square of 9 calculator).
Move along the key angles to find the next levels.
Example (very simplified):
Suppose current price = 100
Square root of 100 ≈ 10 (10 X 10)
To find next major resistance at 180° (opposite side):
Add 2 → 12 → 12²(12 X 12) = 144 → so 144 is strong resistance
Add another 2 → 14²(14 X 14) = 196 → next big level
To find support below:
Subtract 2 → 8² (8 X 8) = 64 → strong support
Rule of thumb (the famous one every Gann student memorizes):
(TATASTEEL 2004–2025)
JUN 2024 HIGH ≈ 184.60 → √184.60 ≈ 13.58 → 13.58² = ~184.60
Less 1 (45°) → 12.58² = 158 → minor
Less another 1 → 11.58² = 134 ( last time act as support zone)
but remember round figure Square Root is impotent point. just watch
Square root (13-2) =11 - 11² = 122 price level work as a strong support on Dec,2024.
To go UP one full 90° → add 2 to the square root, then square it
To go UP one full 180° → add 4 to the square root, then square it
To go DOWN → subtract instead of add
Quick Cheat Sheet (Most Used Moves)
Move Formula Example (from 100) (What I call)
Next 45° up (√price + 1)² (10 + 1)² = 121 (Hurdle point)
Next 90° up (√price + 2)² (10 + 2)² = 144 ( Resistance point)
Next 180° up (√price + 4)² (10 + 4)² = 196 (New Breakout Point)
Next 360° up (√price + 8)² (10 + 8)² = 324 (Final Target)
Next 90° down (√price – 2)² (10 – 2)² = 64 (pure profit booking point)
These levels (64, 121, 144, 196, 324, etc.) very often act as support/resistance.
Method 2: Time & Price Squaring
Gann said when Time = Price (in square of 9 terms), the market reverses.
Example:
A low happened at price 25 (which is 5²)
49 days later = 7² → if price also reaches near a 7² level (49 area), high probability of reversal.
Top-Performing Companies Across Different PLI CategoriesElectronics and Semiconductor Sector
The electronics and semiconductor sector is one of the most significant beneficiaries of the PLI scheme. India’s ambition to become a global electronics manufacturing hub has seen major players expand operations under the scheme.
Key Performing Companies:
Foxconn India: A global contract manufacturer, Foxconn has leveraged PLI incentives to expand smartphone assembly lines and component production in India, catering to both domestic demand and exports.
Wistron and Pegatron: These Taiwanese companies have aggressively increased manufacturing capacities, focusing on consumer electronics such as smartphones and laptops.
Lava International and Micromax: Indian brands have utilized PLI support to enhance their supply chains, localize manufacturing, and remain competitive against international players.
These companies have shown exceptional growth in production volumes and employment generation, highlighting the success of PLI in promoting electronics manufacturing.
Pharmaceuticals and Medical Devices
The pharmaceuticals and medical devices sector is a critical area of focus under the PLI scheme, especially in light of global demand for affordable and high-quality healthcare products.
Top Performers:
Sun Pharma: Leveraging PLI benefits, Sun Pharma has expanded its manufacturing of critical APIs (Active Pharmaceutical Ingredients) to meet both domestic and international demand.
Cipla and Lupin: These companies have enhanced production capacities in high-demand therapeutic segments such as cardiovascular, anti-infectives, and diabetes medications.
Trivitron Healthcare: A key player in medical devices, Trivitron has scaled up production of diagnostic and surgical equipment, supported by PLI incentives.
These companies’ performance demonstrates the PLI scheme’s potential in enhancing India’s self-reliance in healthcare and reducing dependence on imports.
Automobile and Auto Components
The PLI scheme has also targeted the automotive sector, particularly electric vehicles (EVs) and advanced automotive components.
Leading Companies:
Tata Motors: With a focus on EV production, Tata Motors has utilized PLI incentives to expand EV manufacturing, batteries, and related components.
Mahindra Electric: Mahindra Electric has capitalized on PLI support to boost EV innovation and production, aiming to increase domestic adoption.
Bosch India: As a leading auto components manufacturer, Bosch has invested in next-generation automotive technologies including EV systems, sensors, and power electronics.
These companies are not only benefiting from financial incentives but are also driving India’s transition to sustainable mobility and smart automotive solutions.
Textiles and Apparel
The textiles and apparel sector has seen a transformative impact under the PLI scheme, especially in enhancing value addition and export competitiveness.
Top Performing Companies:
Arvind Ltd: A leader in textiles, Arvind has leveraged PLI incentives to scale up high-end apparel production and integrate advanced technologies.
Welspun India: Focused on home textiles and high-quality fabrics, Welspun has expanded production capacities and strengthened its export footprint.
Raymond Ltd: With investments in innovative textiles and premium apparel, Raymond has utilized PLI support to modernize operations and maintain market leadership.
These companies illustrate how PLI incentives are fostering quality enhancement, higher employment, and export growth in India’s textile industry.
Food Processing Industry
The PLI scheme aims to boost India’s food processing sector, which has enormous potential due to the country’s agricultural base.
High Performers:
Amul (Gujarat Cooperative Milk Marketing Federation): Amul has expanded value-added dairy production with PLI support, ensuring higher efficiency and export readiness.
ITC Ltd: ITC has leveraged the PLI scheme to enhance processed food production, particularly ready-to-eat and packaged goods, for both domestic and international markets.
Parle Agro: PLI incentives have helped Parle Agro scale production lines for beverages and packaged foods, enhancing competitiveness and market share.
These companies demonstrate the PLI scheme’s ability to strengthen India’s food processing ecosystem, reduce wastage, and promote global competitiveness.
Advanced Chemistry Cell (ACC) and Battery Manufacturing
The rise of EVs and renewable energy has increased demand for advanced batteries. The ACC and battery manufacturing category under PLI aims to establish India as a hub for battery production.
Leading Companies:
Exide Industries: Exide has expanded lithium-ion and lead-acid battery manufacturing, leveraging PLI incentives to modernize plants and boost capacity.
Amara Raja Batteries: Focused on automotive and stationary energy storage solutions, Amara Raja has invested in R&D and production expansion.
Tata Chemicals: Diversifying into advanced battery materials, Tata Chemicals has used PLI support to strengthen supply chains for lithium and other key materials.
These investments are critical for India’s EV ambitions and energy transition goals.
Impact on Employment and Exports
The companies benefiting from the PLI scheme have not only scaled production but also created significant employment opportunities. Manufacturing facilities often require skilled and semi-skilled labor, providing job creation in tier-2 and tier-3 cities. Moreover, enhanced production capacities have boosted exports, enabling India to compete with global players in sectors like electronics, pharmaceuticals, textiles, and EV batteries.
Challenges and Future Outlook
Despite strong performance, companies face challenges such as supply chain constraints, competition from global manufacturers, and technology gaps. However, continued PLI support, combined with strategic investments, can help overcome these hurdles.
Looking ahead, sectors like electronics, EVs, advanced batteries, and pharmaceuticals are expected to continue leading under the PLI scheme. Companies that invest in innovation, technology localization, and skill development will likely emerge as the most successful beneficiaries.
Conclusion
The PLI scheme has been a game-changer for India’s manufacturing ecosystem, with top-performing companies across various sectors demonstrating its potential. From electronics and pharmaceuticals to automotive, textiles, and food processing, PLI incentives have enabled companies to scale production, enhance exports, and create employment. Companies like Foxconn, Sun Pharma, Tata Motors, Arvind Ltd, and Amul exemplify the transformative impact of the scheme. As India continues to focus on self-reliance and global competitiveness, the PLI scheme will remain a crucial driver of industrial growth and economic development.

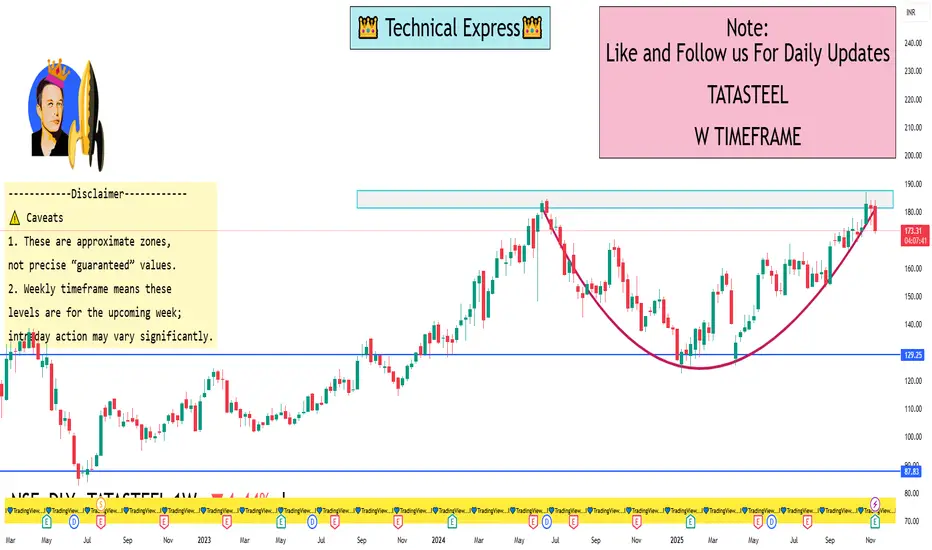
TATA STEEL- cup and handleTATA STEEL cup and handle formation in the making. Breach of 185 levels leading to targets

Introduction to Futures HedgingUnderstanding Futures Contracts
A futures contract is a standardized legal agreement to buy or sell an asset at a predetermined price at a specified future date. These contracts are traded on organized exchanges, ensuring liquidity, transparency, and regulatory oversight. The underlying asset in a futures contract could be a physical commodity such as crude oil, wheat, or gold, or a financial instrument like an index, bond, or currency.
Futures contracts have key characteristics:
Standardization: The contract specifies the quantity, quality, and delivery date of the underlying asset.
Margin Requirements: Traders must maintain a margin—a fraction of the contract value—to enter into futures positions.
Mark-to-Market: Gains and losses are settled daily based on the contract’s market value.
Leverage: Futures allow traders to control large positions with relatively small capital, magnifying both potential gains and losses.
These features make futures contracts ideal tools for hedging because they provide predictability and protection against price volatility.
The Concept of Hedging
Hedging is the practice of taking an investment position in one market to offset potential losses in another. In essence, it acts like insurance: while it may limit potential profits, it also minimizes exposure to losses. There are two main types of hedging:
Long Hedge: Used when a business anticipates purchasing an asset in the future and wants to lock in the current price to avoid rising costs.
Example: An airline expects to buy jet fuel in six months. To protect against rising fuel prices, it can buy futures contracts now at the current price. If fuel prices rise, the gain on the futures contract offsets the higher cost of purchasing fuel in the future.
Short Hedge: Used when a business holds an asset and wants to protect against falling prices.
Example: A wheat farmer expects to harvest in three months. To avoid losses if wheat prices fall, the farmer can sell wheat futures contracts now. If the price drops, the profit on the futures contract compensates for the lower market price of the physical wheat.
By employing hedging strategies, both buyers and sellers can stabilize cash flows and plan their operations with more certainty.
Importance of Futures Hedging
Risk Management: The primary objective of futures hedging is to manage price risk. Businesses in agriculture, energy, metals, and finance frequently use futures to minimize the impact of adverse price movements.
Price Discovery: Futures markets facilitate price discovery, reflecting expectations of supply and demand. Hedgers benefit by gaining insight into future price trends.
Financial Stability: Hedging provides stability to earnings and costs. For companies with significant exposure to commodity or currency fluctuations, this stability supports strategic planning, investment, and growth.
Speculation Reduction: By hedging, companies avoid excessive exposure to speculation-driven market movements, focusing instead on their core business operations.
Enhanced Creditworthiness: Companies with effective hedging programs are viewed as financially prudent by lenders and investors, improving access to capital.
Mechanics of Futures Hedging
Hedging with futures involves several steps:
Identify the Exposure: Determine which assets, commodities, or financial instruments are exposed to price risk.
Select the Appropriate Futures Contract: Choose a futures contract that closely matches the underlying asset in terms of quantity, quality, and timing.
Decide the Hedge Ratio: The hedge ratio determines the number of futures contracts needed to offset the risk. Perfect hedges are rare; often, partial hedges are employed to balance risk reduction and cost.
Enter the Futures Position: Buy or sell futures contracts depending on whether a long or short hedge is appropriate.
Monitor and Adjust: As market conditions change, hedgers must monitor their positions and adjust contracts to maintain effective risk coverage.
Close or Offset the Hedge: Futures contracts can be offset before expiration by taking an opposite position or allowed to expire if physical delivery aligns with the hedger’s requirements.
Examples of Futures Hedging
1. Agricultural Hedging:
A corn farmer expects to harvest 10,000 bushels in four months. Concerned about falling prices, the farmer sells corn futures contracts now. When harvest time arrives, even if the market price has dropped, the farmer’s futures gains compensate for the lower sale price, ensuring financial stability.
2. Corporate Hedging:
A multinational company expects to receive €5 million in payments in six months but operates primarily in USD. To protect against EUR/USD exchange rate fluctuations, the company sells euro futures contracts. If the euro depreciates, gains on the futures offset the reduced dollar value of the payment.
3. Commodity Hedging:
An airline hedges against rising fuel costs by buying crude oil futures. If oil prices increase, the gain on the futures contracts compensates for higher fuel costs, helping maintain profitability.
Advantages of Futures Hedging
Predictable Cash Flows: Hedging reduces uncertainty in revenue and costs.
Flexibility: Futures can be tailored to different commodities, currencies, or indices.
Liquidity: Exchange-traded futures offer easy entry and exit.
Leverage: Efficient capital use allows risk management without tying up large amounts of money.
Transparency: Prices are visible and regulated, reducing counterparty risk.
Limitations of Futures Hedging
Basis Risk: The futures price may not move perfectly in line with the underlying asset, resulting in imperfect hedges.
Cost: Margins and transaction fees add to the cost of hedging.
Limited Profit Potential: Hedging locks in prices, reducing the opportunity to benefit from favorable market movements.
Complexity: Understanding contract specifications, hedge ratios, and market dynamics requires expertise.
Over-hedging Risk: Using excessive futures positions can create unintended exposure and losses.
Conclusion
Futures hedging is a vital risk management tool in modern financial and commodity markets. It allows businesses and investors to stabilize cash flows, plan effectively, and mitigate losses arising from adverse price movements. By understanding the mechanics, advantages, and limitations of futures contracts, market participants can use hedging strategies to navigate volatile markets with confidence. While futures hedging does not eliminate risk entirely, it transforms unpredictable market movements into manageable financial outcomes, fostering greater stability and strategic decision-making.
In an increasingly globalized and interconnected economy, the role of futures hedging has expanded beyond traditional commodities to include financial instruments, currencies, and indices. Companies, investors, and financial institutions that employ well-structured hedging strategies are better positioned to withstand market shocks, protect their profitability, and achieve long-term growth.
Part 1 Intraday Trading Master ClassIndex Options vs Stock Options
Index Options
Extremely liquid
Weekly expiry
Less manipulation
Ideal for intraday traders
Stock Options
Monthly expiry only
Higher margin for selling
Less liquid compared to index
Better for positional strategies

Candle Patterns Candlestick patterns are one of the most widely used tools in technical analysis. Originating from 17th-century Japanese rice trading, they provide visual information about market psychology, price momentum, and potential trend reversals. Each candlestick represents price movement during a specific time period—whether 1 minute, 1 hour, 1 day, or more. By studying candlestick patterns, traders try to anticipate whether buyers or sellers are gaining control and what the next move might be.
A candlestick consists of four key data points: open, high, low, and close. The body of the candle reflects the distance between the open and close, while the wicks (also called shadows) indicate the highs and lows. A bullish candle typically closes higher than it opens, while a bearish candle closes lower. When these candles form specific shapes or sequences, they become candlestick patterns.
Candlestick patterns fall into three major categories: bullish reversal, bearish reversal, and continuation patterns. Understanding each helps traders identify potential turning points and trend confirmations.

Part 10 Trade Like Institutions 1. Buying a Call (Bullish Bias)
You profit when the price goes above the strike price + premium.
Example:
Nifty at 22,000
You buy 22,100 CE for a ₹50 premium
Breakeven = 22,150
Above 22,150 → profit begins
2. Buying a Put (Bearish Bias)
You profit when the price goes below the strike price – premium.
Example:
Nifty at 22,000
You buy 21,900 PE for ₹40 premium
Breakeven = 21,860
Below 21,860 → profit begins

Candle Patterns 1. Buyers
Push price upward
Create green candles
Long wicks show rejection of low prices
2. Sellers
Push price downward
Create red candles
Long top wicks indicate weakening buying strength
3. Indecision
Appears in dojis and spinning tops
Market is waiting for direction
4. Reversals
Appear when buyers overpower sellers or vice-versa
Engulfing, hammer, shooting star signal possible turning points
5. Continuation
Patterns like Rising Three Methods show temporary rest before trend resumes

Tata Steel: Resistance Test Awaits Q2 CatalystTechnical Analysis
Tata Steel Limited has demonstrated a strong bullish rally spanning three decades, establishing itself as a blue-chip steel sector leader. Over the past year, the stock has been facing persistent resistance in the ₹184-₹187 zone, tested multiple times without a decisive breakout.
Currently trading at ₹181, the stock is positioned just below this critical resistance zone. Interestingly, while quarterly revenue shows a slight drop both QoQ and YoY, EPS has demonstrated positive growth - indicating improved profitability and operational efficiency despite revenue headwinds.
The Q2 FY26 results scheduled for announcement day after tomorrow (November 12, 2025) serve as a crucial catalyst. Positive results could provide the fundamental support needed to break through the stubborn ₹184-₹187 resistance zone and trigger the next leg of the rally.
Entry Strategy: Wait for Q2 results and breakout confirmation above ₹187 before initiating positions.
🎯Targets:
Target 1: ₹190
Target 2: ₹195
Target 3: ₹200
Risk Assessment:
If resistance is not taken out post Q2 results, no more expectations on this stock.
💰Q1 FY26 Financial Highlights (vs Q4 FY25 & Q1 FY25)
Total Income: ₹53,178 Cr (↓ -5% QoQ from ₹56,218 Cr; ↓ -3% YoY from ₹54,771 Cr)
Total Expenses: ₹45,751 Cr (↓ -8% QoQ from ₹49,659 Cr; ↓ -5% YoY from ₹48,077 Cr)
Operating Profit: ₹7,428 Cr (↑ +13% QoQ from ₹6,559 Cr; ↑ +11% YoY from ₹6,694 Cr)
Profit Before Tax: ₹3,067 Cr (↑ +39% QoQ from ₹2,200 Cr; ↑ +29% YoY from ₹2,377 Cr)
Profit After Tax: ₹2,007 Cr (↑ +67% QoQ from ₹1,201 Cr; ↑ +118% YoY from ₹919 Cr)
Diluted EPS: ₹1.66 (↑ +60% QoQ from ₹1.04; ↑ +116% YoY from ₹0.77)
🧠Fundamental Highlights
Tata Steel delivered exceptional Q1 FY26 performance with PAT surging 118% YoY to ₹2,007 crore despite 3% revenue decline, showcasing remarkable operational efficiency. The company reported strong Q2 FY26 operational data with crude steel production reaching 5.67 million tons (up 8% QoQ and 7% YoY).
Q2 FY26 domestic deliveries grew robustly by 20% QoQ and 7% YoY to 5.56 million tons, driven by normalized operations post G Blast Furnace relining at Jamshedpur. Branded Products & Retail vertical achieved best-ever quarterly volumes of approximately 1.9 million tons, demonstrating strong retail demand.
Market cap stands at ₹2,23,766 crore with the stock delivering impressive returns: up 5.8% in one month, 20% in three months, 30% in six months, and 34% YTD. The company reported 7.3% YoY increase in operating profit for Q1 FY26 with EBITDA of ₹74,560 crore.
European operations showed turnaround with Netherlands reporting 1.67 million tons production and 1.54 million tons deliveries. UK operations targeting Q4 FY26 breakeven with Electric Arc Furnace project construction underway at Port Talbot, representing £1.25 billion decarbonization initiative.
JP Morgan maintains overweight rating with ₹180 price target (17% upside potential), while other brokerages project revenue/EBITDA growth CAGR of 8%/26% over FY25-27E. Steel prices anticipated to have bottomed out with China's stimulus measures expected to benefit the sector.
Conclusion
Tata Steel's three-decade bull run approaching critical ₹184-₹187 resistance zone, backed by exceptional Q1 FY26 showing 118% PAT surge and 116% EPS growth despite revenue decline. Strong Q2 operational data with 8% production growth and 20% delivery increase provide positive momentum ahead of November 12 results announcement. UK breakeven target by Q4 FY26 and European turnaround add to growth visibility. Stock trading at attractive 7.2x FY26E EV/EBITDA with analyst targets of ₹180 suggest 17% upside potential upon resistance breakout.
Disclaimer: aliceblueonline.com

TATA STEEL on Demand ZoneTATASTEEL is approaching a demand zone.
Price has retraced into a key support area where buyers previously stepped in. Watching closely for potential reversal signals and strength.
Buy AMO Order Placed.
Exit within 14 day period.
- 🔎 Zone: Demand area highlighted on chart
- 📈 Bias: Monitoring for bullish reaction

TataSteel Short Trade OpportunityTataSteel has had a trend line breakdown on hourly timeframe, 170 & 166 are the lower levels which have opened up. The stock respects fibonacci levels as shown, won't be surprised if the stock moves up till 178 for a retest and then starts falling towards the lower level, wait for a retest for entry opportunity with a strict SL of 180 on hourly closing basis.

Double Top FormationTataSteel has formed a double top on a weekly timeframe which indicates caution, one can initiate a short (swing) trade below the weekly lows with a strict SL of 185 on closing basis.

Hedging with GoldWhy Gold Works as a Hedge
Gold’s hedging power comes from a few fundamental characteristics that have not changed for hundreds of years:
Limited Supply – Gold cannot be printed like currency. Central banks cannot create gold, so its value is less influenced by inflationary policies.
Universal Acceptance – Every country accepts gold as real value. It works beyond borders, politics, and currency systems.
Safe-Haven Asset – When global markets face uncertainty—war, recession, market crashes—investors run towards gold.
Anti-Inflation Characteristics – When inflation rises, the purchasing power of money falls, but gold usually appreciates.
Low Correlation with Equity Markets – When equities fall, gold often stabilizes or rises, making it a natural hedge.
These traits make gold a protective shield in a diversified investment or trading portfolio.
Types of Risks You Can Hedge Using Gold
1. Hedging Against Inflation
Inflation erodes the value of currency over time. Historically, gold prices rise when inflation goes up because currencies weaken.
Example: If inflation in India rises due to rising oil prices or currency depreciation, gold prices often rise in INR.
Investors use gold to preserve their purchasing power.
2. Hedging Against Currency Risk
Gold is priced globally in USD. For countries like India, gold becomes expensive when:
USD strengthens
INR weakens
Thus, gold acts as a hedge against domestic currency depreciation.
3. Hedging Against Equity Market Volatility
When stock markets fall sharply, gold generally rises or stays stable. This negative correlation helps protect portfolios.
Example: During global shocks like lockdowns, wars, or economic crises, investors move from risky assets to gold.
4. Hedging Against Geopolitical Risk
Gold reacts instantly to geopolitical uncertainty such as:
War threats
Diplomatic tensions
Oil supply disruptions
Global sanctions
When these events surface, gold becomes a safe refuge.
5. Hedging Systemic and Financial Risks
Gold holds value even when:
Banks collapse
Bond yields spike
Cryptocurrencies crash
Interest rates change
Therefore, gold is used by central banks and hedge funds as an “insurance asset.”
How to Hedge with Gold – Practical Methods
1. Physical Gold
Traditional but effective.
Gold bars
Coins
Jewellery (not efficient due to making charges)
Pros:
Tangible, no counterparty risk
Cons:
Storage, purity, liquidity issues
Best for: Long-term hedging and wealth preservation.
2. Gold ETFs (Exchange Traded Funds)
Most popular hedging tool for stock market investors.
Why they’re effective:
Easily tradable on NSE/BSE
Backed by physical gold
No storage issues
Example: Buying Gold ETF when expecting market volatility or inflationary pressure.
3. Sovereign Gold Bonds (SGBs)
Issued by RBI, these are ideal for medium-long term hedging.
Benefits:
2.5% annual interest
No storage issue
Tax-free on redemption after maturity
SGBs hedge inflation and currency risks while earning returns.
4. Gold Futures (MCX)
For traders, MCX gold futures are the most flexible hedge.
Uses:
Hedge short-term trading volatility
Lock buying/selling prices
Protect equity positions
Example:
If you are long in equities and expect a global shock, you can hedge by buying gold futures.
5. Gold Options
Options on gold, available on MCX, allow hedging using limited risk.
Example:
Buy Call option on gold → hedge against rising inflation/geopolitical risk
Buy Put option on gold → hedge against falling gold prices
Portfolio Hedging Strategies Using Gold
1. 10–15% Allocation Strategy
Most global experts recommend allocating 10% to 15% of a portfolio to gold to hedge against macro-economic risks.
Stable long-term return
Smoothens volatility
Acts as insurance during market crashes
Example allocation:
70% equity + 20% debt + 10% gold
2. Hedge When VIX Spikes
When volatility index (India VIX) rises sharply:
Markets become unstable
Investors flee to safety
Gold absorbs fear-driven flows
Traders use gold futures/options during VIX spikes to protect equity positions.
3. Dollar-Cost Averaging (DCA) in Gold
Instead of buying gold at once, accumulate slowly.
Reduces timing risk
Works during inflation cycles
Smoothens price fluctuations
Ideal for ETFs or SGBs.
4. Gold as a Hedge During Rate Cycle Changes
When central banks cut interest rates:
Gold rises (because opportunity cost drops)
When central banks raise rates:
Gold slows down, but still holds for hedging
Understanding rate cycles helps time your hedge better.
When You MUST Hedge with Gold
1. Rising Inflation Trend
If CPI inflation moves up consistently, gold becomes essential.
2. Weakening Rupee
When INR falls beyond 83–85 levels, gold prices rise quickly in India.
3. Global Recession Fears
In recessionary conditions:
Equities fall
Bond yields drop
Investors shift to gold
4. When Oil Prices Spike
Historically, oil and gold move together during crises:
higher oil = higher inflation = higher gold
5. Major Geopolitical Tensions
Wars, sanctions, Middle-East disruptions, or supply chain risks push gold higher.
Advantages of Gold as a Hedge
✔ Consistent Performance across decades
✔ Liquidity – easily traded
✔ Crisis-proof asset
✔ Acts as insurance for portfolios
✔ Balances equity risk
✔ Low correlation with other asset classes
✔ Effective against inflation and currency depreciation
Limitations of Hedging with Gold
⚠ No dividends or corporate earnings
⚠ Gold can go sideways for long periods
⚠ Short-term volatility exists
⚠ Futures require margin and skill
Gold is best used as a hedge, not as the only investment.
Conclusion
Hedging with gold is one of the oldest and most reliable risk-management strategies in financial markets. Whether it’s inflation risk, market volatility, geopolitical uncertainty, or currency depreciation, gold acts as a protective layer around your portfolio. For traders, gold provides a negative correlation hedge during equity market turbulence. For investors, gold safeguards long-term wealth and future purchasing power. In modern markets where data, algorithms, and AI influence every price move, gold remains a timeless asset—quiet, powerful, and consistent as a hedge.
TATASTEEL 1 Week View🔍 Current context
The stock is trading around ₹ 176–177 (as of mid-Nov 2025).
On a weekly basis, technical indicators suggest a mixed to weak bias: for example, on daily timeframes many moving averages and indicators show “Sell” signals.
On the weekly timeframe (Moneycontrol data) the moving averages, MACD, RSI etc are showing outperform (“bullish”) signals.
Key support/resistance pivot levels:
Resistance (Classic) ~ ₹ 185.31, ₹ 189.25, ₹ 194.40
Support (Classic) ~ ₹ 176.22, ₹ 171.07, ₹ 167.13
52‐week high ~ ₹ 186.94, 52‐week low ~ ₹ 122.62
🎯 1-Week Trading Levels & Potential Strategy
Given the above, here are plausible levels and scenarios for the next week:
Upside target: If the stock picks up momentum, a breakout above ~ ₹ 180-185 opens the way toward ~ ₹ 189-190 (resistance).
Downside risk: If weakness persists, a drop below ~ ₹ 176 could test support around ~ ₹ 171–172, and potentially down to ~ ₹ 167.
Key trigger level: The ~ ₹ 176 region is a hinge. Holding above gives chance for upside; failing it shifts the bias downward.
⚠️ Caveats
A 1-week timeframe is quite short; factors such as global steel demand, raw material costs, and domestic policy can impact quickly.
Technicals are only one piece of the puzzle — fundamentals, news, sector dynamics matter.
The conflicting signals (daily weak vs weekly stronger) mean the stock may trade sideways or range-bound in the short run.
Premium Chart Knowledge Strategy and Leverage
Option trading allows traders to speculate on price movements or hedge positions with limited capital, offering leverage and flexibility through calls (buy) and puts (sell) contracts.
Risk and Reward
Options carry high profit potential but significant risk due to time decay and volatility. Successful trading requires analysis, discipline, and understanding of premium pricing and expiry.

Tata Steel: Resistance Test Awaits Q2 Catalyst🔍 Technical Analysis
Tata Steel Limited has demonstrated a strong bullish rally spanning three decades, establishing itself as a blue-chip steel sector leader. Over the past year, the stock has been facing persistent resistance in the ₹184-₹187 zone, tested multiple times without a decisive breakout.
Currently trading at ₹181, the stock is positioned just below this critical resistance zone. Interestingly, while quarterly revenue shows a slight drop both QoQ and YoY, EPS has demonstrated positive growth - indicating improved profitability and operational efficiency despite revenue headwinds.
The Q2 FY26 results scheduled for announcement day after tomorrow (November 12, 2025) serve as a crucial catalyst. Positive results could provide the fundamental support needed to break through the stubborn ₹184-₹187 resistance zone and trigger the next leg of the rally.
Entry Strategy: Wait for Q2 results and breakout confirmation above ₹187 before initiating positions.
🎯 Targets:
Target 1: ₹190
Target 2: ₹195
Target 3: ₹200
Risk Assessment:
If resistance is not taken out post Q2 results, no more expectations on this stock.
💰 Q1 FY26 Financial Highlights (vs Q4 FY25 & Q1 FY25)
Total Income: ₹53,178 Cr (↓ -5% QoQ from ₹56,218 Cr; ↓ -3% YoY from ₹54,771 Cr)
Total Expenses: ₹45,751 Cr (↓ -8% QoQ from ₹49,659 Cr; ↓ -5% YoY from ₹48,077 Cr)
Operating Profit: ₹7,428 Cr (↑ +13% QoQ from ₹6,559 Cr; ↑ +11% YoY from ₹6,694 Cr)
Profit Before Tax: ₹3,067 Cr (↑ +39% QoQ from ₹2,200 Cr; ↑ +29% YoY from ₹2,377 Cr)
Profit After Tax: ₹2,007 Cr (↑ +67% QoQ from ₹1,201 Cr; ↑ +118% YoY from ₹919 Cr)
Diluted EPS: ₹1.66 (↑ +60% QoQ from ₹1.04; ↑ +116% YoY from ₹0.77)
🧠 Fundamental Highlights
Tata Steel delivered exceptional Q1 FY26 performance with PAT surging 118% YoY to ₹2,007 crore despite 3% revenue decline, showcasing remarkable operational efficiency. The company reported strong Q2 FY26 operational data with crude steel production reaching 5.67 million tons (up 8% QoQ and 7% YoY).
Q2 FY26 domestic deliveries grew robustly by 20% QoQ and 7% YoY to 5.56 million tons, driven by normalized operations post G Blast Furnace relining at Jamshedpur. Branded Products & Retail vertical achieved best-ever quarterly volumes of approximately 1.9 million tons, demonstrating strong retail demand.
Market cap stands at ₹2,23,766 crore with the stock delivering impressive returns: up 5.8% in one month, 20% in three months, 30% in six months, and 34% YTD. The company reported 7.3% YoY increase in operating profit for Q1 FY26 with EBITDA of ₹74,560 crore.
European operations showed turnaround with Netherlands reporting 1.67 million tons production and 1.54 million tons deliveries. UK operations targeting Q4 FY26 breakeven with Electric Arc Furnace project construction underway at Port Talbot, representing £1.25 billion decarbonization initiative.
JP Morgan maintains overweight rating with ₹180 price target (17% upside potential), while other brokerages project revenue/EBITDA growth CAGR of 8%/26% over FY25-27E. Steel prices anticipated to have bottomed out with China's stimulus measures expected to benefit the sector.
✅ Conclusion
Tata Steel's three-decade bull run approaching critical ₹184-₹187 resistance zone, backed by exceptional Q1 FY26 showing 118% PAT surge and 116% EPS growth despite revenue decline. Strong Q2 operational data with 8% production growth and 20% delivery increase provide positive momentum ahead of November 12 results announcement. UK breakeven target by Q4 FY26 and European turnaround add to growth visibility. Stock trading at attractive 7.2x FY26E EV/EBITDA with analyst targets of ₹180 suggest 17% upside potential upon resistance breakout.
Disclaimer: This analysis is for educational purposes only. Consult your financial advisor before making investment decisions. Stock markets are subject to risks.

Technical Analysis vs. Fundamental Analysis1. Fundamental Analysis: Understanding the Core Value
Fundamental analysis involves examining the underlying economic and financial factors that determine a company’s real worth. The idea is simple: every stock has an intrinsic value, which may differ from its market price. If the market price is below intrinsic value, the stock is undervalued (a potential buy). If it’s above, the stock is overvalued (a potential sell).
1.1 Components of Fundamental Analysis
Fundamental analysis can be divided into two main parts — qualitative and quantitative analysis.
Qualitative Factors include aspects such as the company’s management, competitive advantages, business model, industry position, brand value, and corporate governance. These factors determine how well the company can maintain profitability over time.
Quantitative Factors involve analyzing financial data — income statements, balance sheets, and cash flow statements — to assess profitability, liquidity, and solvency.
1.2 Key Ratios and Metrics
Analysts use several ratios to evaluate a company’s performance:
Earnings Per Share (EPS) – Measures profit allocated to each outstanding share.
Price-to-Earnings (P/E) Ratio – Compares market price to earnings; helps identify overvaluation or undervaluation.
Return on Equity (ROE) – Indicates profitability relative to shareholders’ equity.
Debt-to-Equity Ratio (D/E) – Shows the company’s financial leverage.
Price-to-Book (P/B) Ratio – Compares market value to book value.
These ratios provide insight into how efficiently a company uses its resources and how it compares to its competitors.
1.3 Top-Down and Bottom-Up Approaches
Top-Down Approach: Begins by analyzing macroeconomic factors — GDP growth, interest rates, inflation, fiscal policies — and then narrows down to industries and companies likely to benefit.
Bottom-Up Approach: Starts at the company level, focusing on specific fundamentals, regardless of broader economic conditions.
1.4 Objective of Fundamental Analysis
The main objective is long-term investment. Investors like Warren Buffett use fundamental analysis to find value stocks — those that trade for less than their intrinsic worth. This approach is ideal for investors looking to build wealth steadily over time.
2. Technical Analysis: Reading the Market’s Psychology
Technical analysis, on the other hand, is based on the premise that market prices already reflect all available information, and that price movements tend to follow identifiable patterns over time. Instead of analyzing a company’s financials, technical analysts (or “chartists”) study charts, trends, and indicators to predict future price action.
2.1 Core Principles of Technical Analysis
Market Action Discounts Everything: All factors — economic, political, or psychological — are already reflected in the price.
Prices Move in Trends: Markets tend to move in recognizable trends — upward (bullish), downward (bearish), or sideways (range-bound).
History Repeats Itself: Price patterns recur because human emotions — fear and greed — remain constant over time.
2.2 Tools and Techniques
Technical analysis employs a variety of tools to interpret market data:
Price Charts: The foundation of technical analysis, including line charts, bar charts, and candlestick charts.
Trends and Trendlines: Help identify the general direction of the market.
Support and Resistance Levels: Indicate price levels where buying or selling pressure historically prevents further movement.
Volume Analysis: Confirms the strength of a trend; higher volume often supports the validity of a move.
Indicators and Oscillators: Mathematical calculations applied to price and volume, such as:
Moving Averages (SMA, EMA)
Relative Strength Index (RSI)
Moving Average Convergence Divergence (MACD)
Bollinger Bands
Fibonacci Retracement Levels
2.3 Technical Patterns
Chartists look for patterns that signal potential market reversals or continuations:
Reversal Patterns: Head and shoulders, double tops/bottoms.
Continuation Patterns: Flags, pennants, triangles.
Candlestick Patterns: Doji, hammer, engulfing, and shooting star patterns that reveal market sentiment.
2.4 Objective of Technical Analysis
The goal is to time the market — to identify the best entry and exit points. Technical analysis is particularly useful for short-term traders, such as day traders and swing traders, who rely on momentum and price action rather than intrinsic value.
3. Comparison Between Fundamental and Technical Analysis
Aspect Fundamental Analysis Technical Analysis
Focus Company’s intrinsic value, earnings, growth, and economic factors Price movements, patterns, and market trends
Data Used Financial statements, economic data, industry trends Price, volume, and historical charts
Time Horizon Long-term (months to years) Short-term (minutes to weeks)
Approach Analytical and valuation-based Statistical and pattern-based
Objective Identify undervalued/overvalued assets Identify buy/sell opportunities
Investor Type Value investors, long-term holders Traders, speculators
Market Assumption Market may misprice assets in the short term Market reflects all information instantly
Tools Used P/E, EPS, ROE, D/E, financial models RSI, MACD, moving averages, candlestick patterns
Decision Basis Intrinsic value gap Price trend and momentum
Example Buying a stock after analyzing strong earnings growth Buying a stock after a breakout from resistance
4. Integration of Both Approaches
Many successful investors combine fundamental and technical analysis for better decision-making. For example:
Fundamentals identify what to buy (quality stock or undervalued asset).
Technical analysis identifies when to buy or sell (best timing and trend confirmation).
This blended approach helps reduce risk. A trader may use fundamentals to find fundamentally strong companies and then apply technical tools to decide when to enter or exit positions.
For instance, an investor might identify a fundamentally strong company like Infosys Ltd. based on solid earnings and low debt, but wait for a bullish chart pattern (like a breakout above resistance) before investing.
5. Advantages and Limitations
Fundamental Analysis Advantages
Provides deep insights into a company’s true worth.
Suitable for long-term investing and wealth creation.
Helps avoid market speculation and emotional trading.
Limitations
Time-consuming and data-heavy.
Ineffective for short-term trades where price action dominates.
Market prices can remain irrational longer than expected.
Technical Analysis Advantages
Ideal for short-term trading.
Provides clear entry and exit signals.
Works across any market — stocks, forex, or commodities.
Limitations
Based on probabilities, not certainties.
May produce false signals in volatile or low-volume markets.
Ignores underlying business fundamentals.
6. Which One is Better?
There is no universal answer — the choice depends on an investor’s objective, timeframe, and personality.
A long-term investor who focuses on value creation and dividend growth should prefer fundamental analysis.
A short-term trader who thrives on volatility and quick gains should rely more on technical analysis.
Many professionals use a hybrid strategy, integrating both methods to capitalize on strengths and offset weaknesses.
7. Conclusion
Both technical and fundamental analysis are powerful tools that serve different purposes in the financial markets. Fundamental analysis emphasizes value, seeking to identify opportunities based on real-world data, company performance, and economic strength. Technical analysis emphasizes timing, focusing on trends, price patterns, and market psychology to make faster decisions.
Ultimately, success in investing or trading depends not merely on choosing one method over the other but on understanding how and when to apply each. A well-informed investor blends both — using fundamentals to find good companies and technicals to identify the right moment to act — thus achieving a balance between knowledge and timing, value and opportunity, analysis and action.
