Mastering Technical Analysis1. What Is Technical Analysis?
Technical analysis is a method of forecasting market movement by studying price charts, trading volume, indicators, and patterns. Unlike fundamental analysis—which focuses on earnings, economic data, and intrinsic value—TA assumes that all information is already reflected in the price.
At its core, technical analysis is built on three key assumptions:
1. Market action discounts everything
Every factor—economic data, news, global events—gets absorbed into price.
2. Prices move in trends
Markets do not move randomly. They follow identifiable patterns: uptrends, downtrends, or sideways ranges.
3. History repeats itself
Human behavior, fear and greed, and market psychology create recurring patterns.
These principles allow traders to anticipate moves with probability, not certainty.
2. Understanding Price Structure
a. Dow Theory Basics
Dow Theory forms the foundation of technical analysis:
Market moves in three trends: primary (major), secondary (pullbacks), and minor (small fluctuations).
Trends stay in effect until clear reversal signals appear.
Volume confirms price movement.
b. Market Trends
A trend is the direction in which prices move.
Uptrend: Higher highs (HH) + higher lows (HL)
Downtrend: Lower highs (LH) + lower lows (LL)
Sideways/Range: Price oscillates between support and resistance.
Identifying trends early is one of the biggest advantages for traders.
3. Key Elements of Technical Analysis
a. Support and Resistance
Support is a price level where buying interest dominates. Resistance is where selling pressure appears.
These levels help traders:
Time entries
Set targets
Place stop losses
Breakouts and breakdowns from these levels often indicate major moves.
b. Trendlines and Channels
Trendlines connect the lows in an uptrend and highs in a downtrend. When combined with parallel lines, they form channels, showing strong directional movement.
A break of a trendline often signals trend reversal.
c. Chart Patterns
Patterns form when price movements create recognizable shapes on charts.
Reversal Patterns:
Head and Shoulders
Inverse Head and Shoulders
Double Top / Double Bottom
Triple Tops / Bottoms
Continuation Patterns:
Flags
Pennants
Triangles
Rectangles
Chart patterns reflect collective market psychology and help forecast future direction.
4. Candlestick Patterns
Candlestick charts reveal the emotional story of buyers and sellers. Some common patterns include:
Bullish Patterns:
Hammer
Bullish Engulfing
Morning Star
Piercing Line
Bearish Patterns:
Shooting Star
Bearish Engulfing
Evening Star
Dark Cloud Cover
Combining candlestick signals with support/resistance improves accuracy.
5. Technical Indicators and Oscillators
Indicators help interpret market momentum, strength, and volatility. Although no indicator is perfect, combining a few well-selected ones enhances decision-making.
a. Moving Averages
They smooth out price movement to reveal trends.
Types:
SMA (Simple Moving Average)
EMA (Exponential Moving Average)
Common strategies:
Golden Cross (50-MA above 200-MA)
Death Cross (50-MA below 200-MA)
EMA-based trend trading
b. RSI (Relative Strength Index)
RSI measures momentum and identifies overbought (>70) and oversold (<30) conditions. It also signals divergences, which often precede reversals.
c. MACD (Moving Average Convergence Divergence)
MACD shows the relationship between two EMAs. Signals include:
Bullish or bearish crossovers
Histogram direction
Divergences
d. Bollinger Bands
These measure volatility. Price touching the upper band suggests overbought conditions; touching the lower band suggests oversold conditions. Squeezes indicate big upcoming moves.
e. Volume Indicators
Volume is essential for confirming trends.
Rising price + rising volume = strong trend
Rising price + low volume = weak trend
6. Multi-Time Frame (MTF) Analysis
Professional traders analyze charts across multiple time frames. For example:
Higher time frames (1D, 1W) show the major trend.
Lower time frames (1H, 15m) show entry opportunities.
A trade is strongest when trends align on multiple time scales.
7. Breakout and Breakdown Trading
Breakouts occur when price moves above resistance with strong volume. Breakdowns occur when price falls below support.
Successful breakout trading requires:
Volume confirmation
Retest of breakout zones
Avoiding false breakouts
8. Risk Management and Position Sizing
Mastering technical analysis is not just about reading charts. The biggest key is managing risk.
Essential rules:
Always use a stop loss
Do not risk more than 1–2% of capital per trade
Use risk-reward ratios (e.g., 1:2 or 1:3)
Trade with discipline, not emotion
Good risk management keeps you in the game long enough to experience compounding success.
9. Trading Psychology
Technical analysis is 30% charts and 70% psychology. Recognize these emotional traps:
Fear of missing out (FOMO)
Overconfidence after profit
Revenge trading after loss
Impatience and overtrading
A disciplined trader follows rules and trusts their strategy.
10. Creating Your Own Trading System
To master technical analysis, create a structured trading system:
Components of a strong system:
Market selection (stocks, indices, crypto)
Time frame (intraday, swing, positional)
Indicators (2–3 maximum)
Entry rules (breakout, pullback, pattern)
Exit rules (target, trailing stop)
Risk-reward ratios
Backtesting to validate performance
A system removes emotional decision-making and boosts consistency.
11. Combining Technical and Fundamental Analysis
While TA is powerful, combining it with fundamental catalysts—earnings, macro trends, sector strength—creates high-probability setups. For example:
Volume breakout + strong quarterly results
Trend continuation + positive economic news
This hybrid approach is used by many successful traders.
12. The Path to Mastery
Technical analysis mastery does not come overnight. It requires:
Chart practice
Backtesting historical data
Studying past cycles
Recording trades in a journal
Reviewing mistakes and refining rules
Over time, patterns become clear, and intuition develops.
Conclusion
Mastering technical analysis is a journey of learning price behavior, practicing chart reading, and developing psychological discipline. By understanding trends, patterns, indicators, and risk management, traders gain the ability to anticipate market moves with greater confidence. TA does not guarantee profits—it improves probabilities. Combined with discipline, patience, and a structured approach, it becomes a powerful skill that can transform your trading performance.
Trade ideas

Part 1 Intraday Trading Master ClassKey Terms in Option Trading
a) Premium
The cost paid by the buyer to purchase an option contract.
This is the maximum loss for the buyer and the maximum gain for the seller.
b) Strike Price
The fixed price at which a call buyer can buy or a put buyer can sell.
c) Expiry
The date when the option contract expires.
In India:
Indices: Weekly + Monthly expiry
Stocks: Monthly expiry only
d) Lot Size
Options are traded in lots, not single units.
Example: Nifty lot = 50 units.
e) In-the-Money (ITM), At-the-Money (ATM), Out-of-the-Money (OTM)
ITM Call: Spot > Strike
ATM: Spot = Strike
OTM Call: Spot < Strike
Vice-versa for puts.

Premium Chart Patterns Introduction: Chart patterns are visual formations on price charts that help traders understand market behaviour. They show how buyers and sellers are interacting and where the price might move next. These patterns repeat over time, so traders use them to predict breakouts, trend reversals, and continuation of trends.
Chart patterns are mainly divided into Reversal Patterns, Continuation Patterns, and Bilateral Patterns.
1. Reversal Chart Patterns
Reversal patterns indicate that the current trend is about to change direction. If the market is going up, a reversal pattern may signal a fall. If the market is falling, it may warn of an upcoming rise.
2. Continuation Chart Patterns
These patterns show that the ongoing trend will continue after a short pause or consolidation.
3. Bilateral Chart Patterns
These patterns indicate a possible breakout in either direction.

Real Knowledge Premium Charts 🔶 What Are Premium Chart Patterns?
Premium chart patterns are advanced price structures that go beyond basic formations like triangles or flags. They reveal institutional activity, market psychology, and volume–price alignment.
These patterns often indicate major breakouts, reversals, or continuation trends — giving traders an edge when combined with volume profile, market structure, and confirmation indicators.

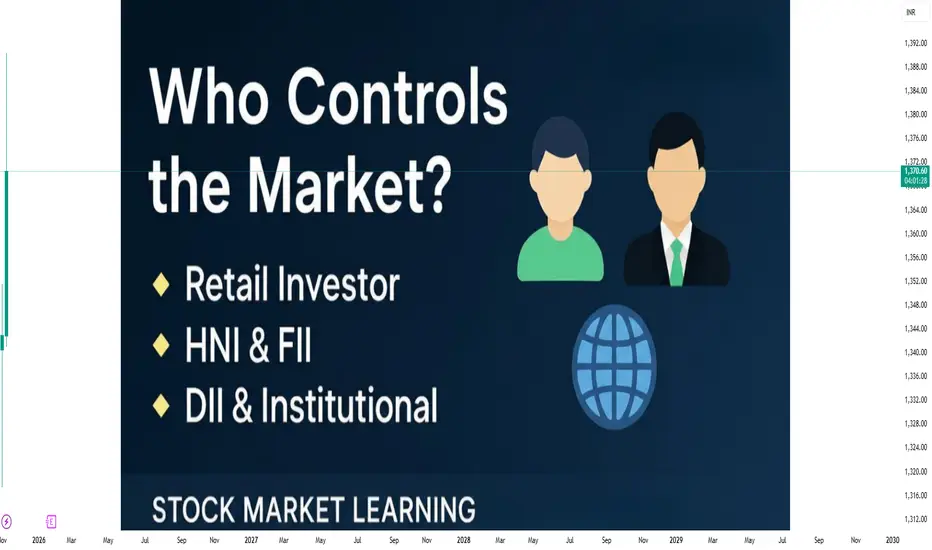
Who Controls the Trade Market?1. Governments and National Policies
Governments are among the most significant influencers of global trade. They do not directly “control” the entire trade market but shape it through:
a. Trade Policies
Countries impose:
Tariffs
Import/export taxes
Quotas
Subsidies
Sanctions
These tools can encourage or restrict trade. For example, a country may impose tariffs on imported steel to protect its local steel industry, affecting global steel prices and trade flows.
b. Trade Agreements
Nations sign bilateral and multilateral agreements such as:
WTO Agreements
Regional trade blocs (EU, ASEAN, NAFTA/USMCA, MERCOSUR)
Free trade agreements (India–UAE CEPA, EU–Japan EPA)
Such agreements define tariff structures, market access, rules of origin, and dispute mechanisms. They create predictable trade environments that shape global flows.
c. Currency and Monetary Policy
Governments influence their currency through central banks, affecting:
Export competitiveness
Import costs
Balance of payments
For example, a weaker currency makes a country’s exports cheaper globally, increasing trade activity.
2. Central Banks and Interest Rate Policies
Central banks indirectly influence the trade market by controlling:
Interest rates
Foreign exchange reserves
Money supply
Inflation
These factors alter import/export demand, capital flows, and trade financing costs. The U.S. Federal Reserve, ECB, Bank of Japan, and People's Bank of China have an outsized influence because their currencies drive global trade settlements.
3. The World Trade Organization (WTO)
The WTO does not “control” trade but regulates and oversees the global trading system. It:
Sets rules for fair trade
Resolves trade disputes
Ensures nondiscriminatory trade practices
Manages global tariff schedules
When trade conflicts arise—such as U.S.–China tariff disputes—WTO rulings influence the direction of global commerce.
4. Global Corporations and Multinational Companies
Large corporations have enormous power over global trade because they operate massive supply chains that span continents. This includes:
Tech giants like Apple, Samsung, and TSMC
Automotive leaders like Toyota, Volkswagen, and Tesla
Energy majors like ExxonMobil, Saudi Aramco, BP
Retail giants like Amazon, Walmart
These companies determine:
Where factories are located
What resources are needed
How goods move across borders
Because of their sheer scale, multinational companies influence labor markets, commodity demand, transportation networks, and global logistics.
5. Commodity Exchanges and Financial Markets
International exchanges play a key role in price discovery. Examples include:
Chicago Mercantile Exchange (CME) – agriculture, energy, metals
London Metal Exchange (LME) – base metals
New York Stock Exchange (NYSE) – equities
ICE – energy, sugar, cotton
These exchanges:
Set global benchmark prices
Facilitate futures and options trading
Provide hedging tools for buyers and sellers
Thus, financial traders and institutions heavily influence short-term market movements, especially in oil, gold, crops, and currencies.
6. Banks and Financial Institutions
Trade requires financing. Large banks such as:
JPMorgan
HSBC
Citi
Deutsche Bank
Standard Chartered
provide:
Letters of credit
Trade loans
Forex settlement
Risk management tools
Without these institutions, global trade would slow dramatically, especially for developing economies.
7. Geopolitical Powers and Global Politics
Political decisions deeply affect trade. The world’s major power centers—the U.S., China, EU, India, Japan, Russia—shape trade through:
Economic alliances
Trade warfare (tariffs, sanctions)
Military presence near trade routes
Resource control
Investment in foreign infrastructure
Geopolitical tensions such as the Russia–Ukraine war, South China Sea disputes, or Middle Eastern conflicts often disrupt supply chains, shipping lanes, and commodity prices.
8. Cartels and Organized Commodity Groups
Some commodities are influenced by producer groups or cartels. The most powerful example is:
OPEC
The Organization of the Petroleum Exporting Countries coordinates oil production to influence global oil prices.
Although they do not fully control the oil market, their decisions strongly impact:
Crude supply
Energy prices
Inflation globally
Other organized groups exist in diamonds, copper, and certain agricultural sectors, but none are as influential as OPEC.
9. Supply Chain and Logistics Networks
Trade physically moves through:
Shipping companies
Port authorities
Airlines
Freight forwarders
Rail networks
Global shipping giants like Maersk, MSC, and COSCO operate vast fleets and control a significant portion of global container movement. Congestion at a major port can affect trade worldwide.
10. Digital Platforms, E-Commerce, and Technology
In the 21st century, platforms such as Alibaba, Amazon, and Shopify influence global trade patterns by enabling cross-border commerce at scale.
Additionally, digital tools like:
AI forecasting
Blockchain-based trade finance
Real-time logistics tracking
Mobile payments
have increased trade efficiency and reduced barriers.
11. Consumers and Market Demand
Ultimately, consumer behavior controls the direction of trade. Their preferences shape:
What goods are produced
Where they are sourced
How companies market products
For example:
Rising demand for electric vehicles increases global trade in lithium, cobalt, and battery components.
Demand for fast fashion drives textile imports and exports.
Consumers collectively act as a “silent controller” of trade.
12. Conclusion — A System, Not a Single Controller
The trade market is not controlled by any one entity. Instead, it operates as a dynamic ecosystem shaped by:
Governments
Corporations
Financial markets
Regulators
Central banks
Geopolitical forces
Supply chain networks
Consumers
Part 4 Institutional Trading Risks in Option Trading
While options offer leverage and flexibility, they also carry risks:
Time Decay: Option value reduces as expiry nears.
High Volatility: Can cause large swings in option prices.
Unlimited Loss (for sellers): Writers face potentially infinite risk.
Complexity: Requires understanding of multiple factors like Greeks, volatility, and time.

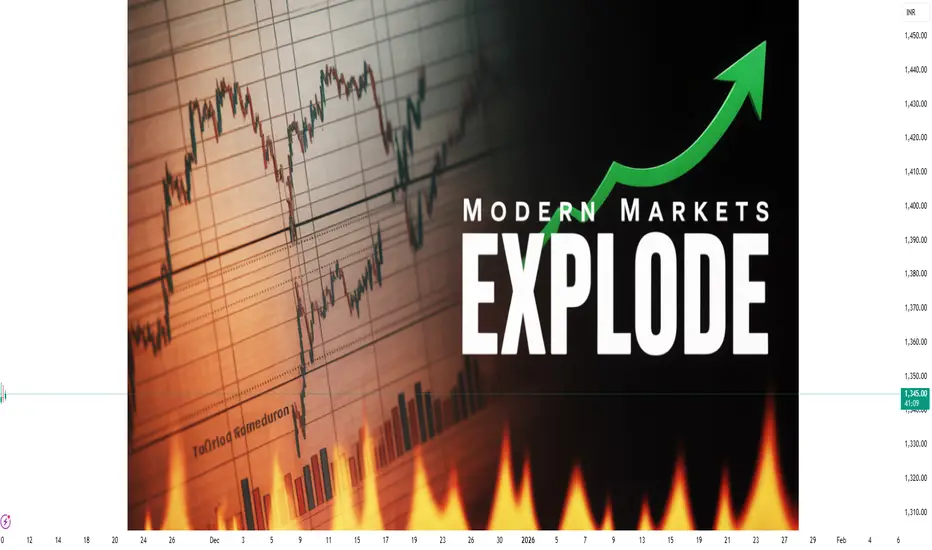
The Modern Market Explosion1. The Digital Revolution in Financial Markets
The first and most powerful factor behind the modern market explosion is digitalization. In the 1980s and 1990s, trading floors were filled with brokers shouting bids and offers. Today, a vast majority of global trades happen electronically within milliseconds. Platforms like NSE, NASDAQ, and NYSE are now driven by high-speed algorithms and smart order systems.
Technology has democratized investing. Mobile apps and online platforms have made it possible for anyone — from a college student to a retiree — to invest in stocks, ETFs, or cryptocurrencies from their smartphones. This has led to a surge in retail participation across the world.
Moreover, the integration of AI and machine learning has redefined data analysis. Traders can now detect patterns, forecast trends, and execute trades with precision that was once unimaginable. AI-driven bots make split-second decisions based on vast data streams, helping investors capture opportunities faster than ever before.
2. Globalization and Market Interconnectivity
Today’s markets are no longer local — they are interconnected ecosystems. What happens in one corner of the world instantly impacts another. A rate hike in the U.S. can move Asian currencies, while a geopolitical conflict in the Middle East can spike global oil prices and influence stock indices in Europe and India.
This interconnectivity means opportunities are global. Investors can diversify portfolios across geographies — U.S. tech stocks, Indian mid-caps, Japanese bonds, and even African startups. But it also means higher volatility. The same interlinkage that offers diversification can also spread panic during crises — as seen in the 2008 financial meltdown or the 2020 pandemic shock.
However, globalization has also enabled foreign capital inflows into emerging economies, fueling growth and innovation. Markets like India, Indonesia, and Brazil have seen massive foreign institutional investments (FIIs) as global investors search for higher returns.
3. The Rise of Retail Investors and the “Crowd Effect”
One of the most striking features of the modern market explosion is the rise of retail participation. The COVID-19 pandemic accelerated this trend as millions turned to trading apps during lockdowns. Platforms like Zerodha, Robinhood, and Groww brought zero-commission trading, social learning, and user-friendly interfaces — empowering individuals to take control of their financial future.
Retail investors have become a powerful market force. Their collective moves can influence stock trends, as seen in the 2021 “GameStop phenomenon,” where a community of small traders challenged big hedge funds. Social media platforms like Reddit, X (Twitter), and YouTube have become virtual trading floors, where ideas spread faster than news headlines.
This new wave has made markets more dynamic but also more sentiment-driven. Tweets, rumors, or viral posts can trigger price movements — making psychology as important as fundamentals.
4. Explosion of Asset Classes and Financial Instruments
Modern markets are not limited to stocks and bonds anymore. Investors today have access to an explosion of financial instruments — from commodities and derivatives to cryptocurrencies, NFTs, and tokenized assets.
Cryptocurrencies like Bitcoin and Ethereum have introduced decentralized finance (DeFi), where financial transactions occur without intermediaries.
Exchange-Traded Funds (ETFs) offer exposure to entire sectors, themes, or countries in a single trade.
Options and futures allow traders to speculate or hedge against price movements with leverage.
Green finance and ESG investments are attracting investors seeking both profit and sustainability.
This diversity has expanded investment choices but also increased complexity. The new challenge for traders is not lack of opportunity, but knowing where to focus.
5. Speed, Data, and the New Trading Psychology
Markets now operate at machine speed. Algorithmic trading, powered by data analytics, accounts for more than half of global trading volume. Every second, millions of transactions take place across exchanges.
But this speed comes with a psychological shift. Traders must adapt to shorter timeframes and rapid information flow. In such a fast-moving environment, fear and greed amplify quickly. A small piece of negative news can trigger instant sell-offs, while hype can drive unsustainable rallies.
In this high-speed world, success depends on discipline, emotional control, and understanding market structure rather than chasing trends. Smart traders analyze volume profiles, liquidity zones, and institutional footprints to navigate volatility effectively.
6. The Role of Central Banks and Liquidity Waves
Modern markets also respond strongly to monetary policy. Central banks like the U.S. Federal Reserve, European Central Bank, and the Reserve Bank of India play a key role in shaping liquidity conditions.
Over the past decade, low-interest rates and quantitative easing (QE) flooded markets with liquidity, driving asset prices to record highs. However, when rates rise, the same liquidity reversal can cause sharp corrections — as seen in 2022.
The explosion in asset prices, from real estate to equities, has been largely fueled by easy money. This has also raised concerns about bubbles, inequality, and systemic risk. Thus, the modern market is as much about liquidity cycles as it is about fundamentals.
7. ESG, Sustainability, and the Future of Capital
Another major dimension of the modern market explosion is the rise of responsible investing. Environmental, Social, and Governance (ESG) factors are now integral to corporate strategy and investor decisions.
Global investors are demanding transparency, green energy initiatives, and ethical governance. Companies that align with sustainability goals attract more capital and public trust. This trend represents a moral shift — markets are no longer just about profit but purpose.
Renewable energy, electric vehicles, and carbon-credit trading are becoming new frontiers of market growth. In essence, the explosion isn’t just financial — it’s philosophical.
8. Artificial Intelligence and the Next Market Evolution
AI is the backbone of the next stage of market evolution. From predictive analytics to automated risk management, AI systems are reshaping portfolio strategies. Machine learning models analyze historical data, news sentiment, and global indicators to generate trading insights at unmatched speed.
Even retail investors can now use AI-powered tools to optimize strategies or detect anomalies. This levels the playing field, allowing individuals to compete with institutions — provided they understand how to use data intelligently.
However, this also raises questions about market fairness and algorithmic dominance. When machines control large volumes of trades, flash crashes and liquidity spikes become real risks.
9. Challenges in the Modern Market Era
Despite its opportunities, the modern market explosion faces significant challenges:
Volatility: Rapid information flow can cause unpredictable swings.
Regulation: Governments struggle to keep up with innovations like crypto and DeFi.
Cybersecurity: As markets go digital, hacking and data breaches pose serious risks.
Inequality: Wealth gaps may widen as those with access to technology and information dominate returns.
To sustain growth, regulators, investors, and institutions must strike a balance between innovation and stability.
10. Conclusion: The Future is Decentralized, Digital, and Data-Driven
The modern market explosion is not a single event — it’s an ongoing revolution. Every innovation, every new investor, and every data-driven decision adds another spark to this dynamic ecosystem.
We’re witnessing the democratization of finance — where anyone with knowledge, discipline, and internet access can participate in wealth creation. But success will depend on adaptability, continuous learning, and emotional intelligence.
As technology continues to evolve, markets will become more decentralized, transparent, and intelligent. The future belongs to those who understand that this explosion isn’t just about money — it’s about information, connection, and evolution.
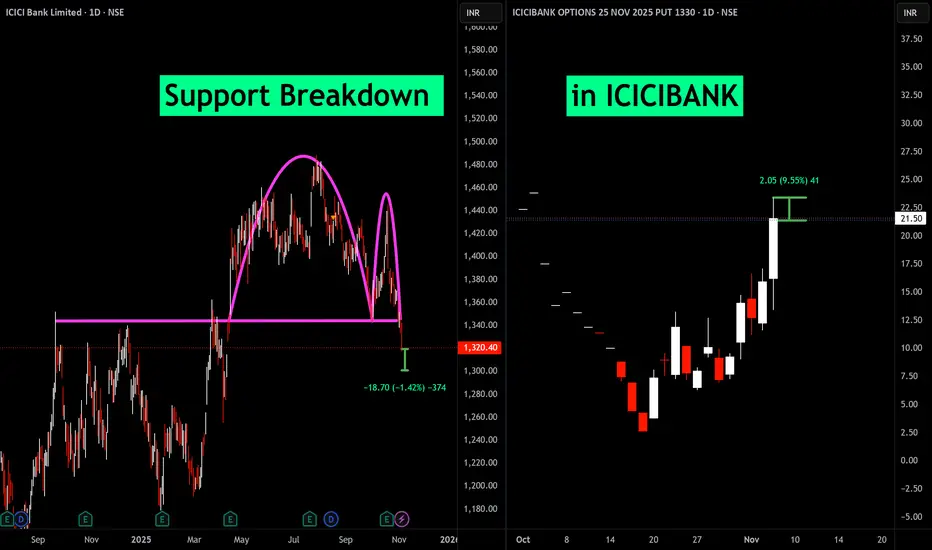
ICICI BANKLast time ICICI took rejection from 0.618 zone, will it again reject the area which comes around 1400

Part 2 Identifying Support and ResistanceRisks in Option Trading
While options offer flexibility, they also come with inherent risks:
Time Decay: Option value erodes as expiry nears, especially for buyers.
High Volatility: Sudden volatility spikes can cause unpredictable price swings.
Leverage Risk: Small movements in the underlying can lead to large gains or losses.
Unlimited Loss Potential for Sellers: Option writers face potentially large losses, especially with uncovered (naked) positions.
Liquidity Risk: Some stock options may have wide bid-ask spreads, making entry and exit difficult.
Proper risk management, position sizing, and stop-loss mechanisms are essential for long-term success.

ICICI BankICICI Bank has taken strong support around the 1320 zone. If this level holds move toward 1420 looks possible in the coming days

Support Breakdown in ICICIBANKThe breakdown of a key support level typically signals that sellers have gained control over the stock, which often leads to further declines.
The chart shows ICICI Bank's daily price slipping below strong support, which traders watch carefully to time short or protective put option trades.
Buying puts here benefits from the falling stock price causing put premiums to rise.
The suggested profit targets and stop-loss levels are based on technical price levels derived from the previous support turned resistance and the magnitude of the breakdown move.
This trade idea is best suited for traders comfortable with short-term bearish plays using direct short selling or options strategies that capitalize on falling prices.
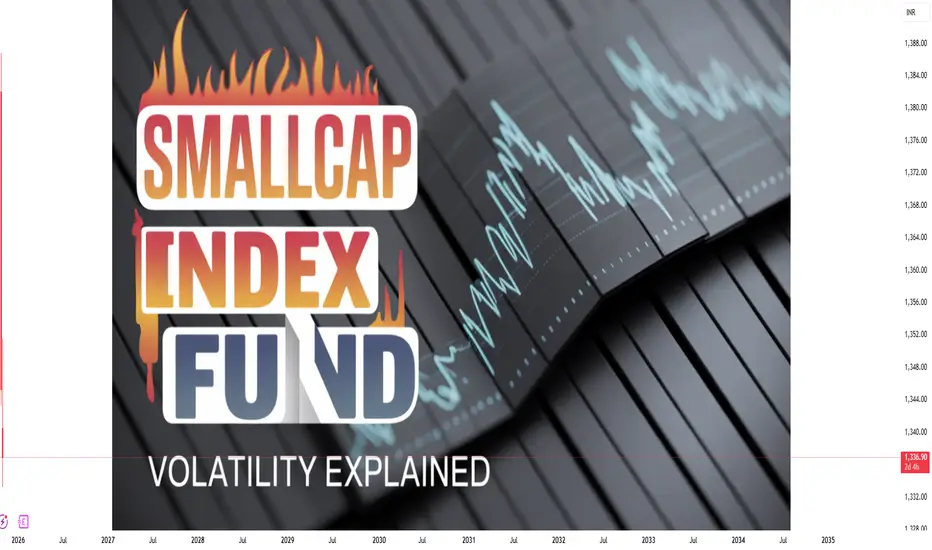
Small-Cap Index Funds Volatility Explained1. Understanding Small-Cap Index Funds
Small-cap index funds track market indices composed of small-cap stocks—companies typically valued between ₹5,000 crore and ₹20,000 crore in India (or between $300 million and $2 billion globally). Examples include the Nifty Smallcap 100 in India or the Russell 2000 Index in the U.S.
Unlike actively managed funds, index funds do not attempt to pick specific stocks; they simply mirror the performance of a predefined index. This makes them cost-effective and diversified, offering investors exposure to a wide range of small companies in one investment vehicle.
While this diversification helps reduce the risk of individual company failure, it doesn’t eliminate market-level volatility, especially in the small-cap segment.
2. Why Small-Cap Stocks Are Volatile
The key reason behind small-cap fund volatility lies in the nature of the underlying small companies. They are in the growth or expansion phase of their business cycle, which makes their earnings, cash flows, and valuations less stable than those of large, established firms.
Let’s break down the main causes:
a) Limited Financial Resources
Small-cap companies often have restricted access to credit and lower cash reserves. During economic downturns or credit crises, they struggle more than large firms to raise funds or maintain operations, which can cause sharp price declines.
b) Low Liquidity
Shares of small-cap companies are traded less frequently. When investors rush to buy or sell, prices can swing widely because there are fewer buyers or sellers in the market. This low liquidity amplifies short-term price movements.
c) Higher Business Risk
Many small-cap firms operate in niche markets or rely on a limited set of products. This lack of diversification in business models means that any disruption—such as regulatory changes, technological shifts, or a key customer loss—can severely impact their earnings and, consequently, stock prices.
d) Sensitivity to Economic Cycles
Small caps are considered economic barometers. They perform strongly during expansions when demand and growth rise, but they can fall sharply during recessions or when interest rates rise. This cyclical nature adds to their volatility.
e) Market Sentiment
Investor perception plays a significant role in small-cap stock movements. In bullish phases, investors often become overly optimistic, driving prices to unsustainable levels. Conversely, during market corrections, fear can lead to steep declines. Hence, sentiment swings are more pronounced in small-cap segments.
3. Historical Perspective: Volatility Patterns
Looking at historical data, small-cap indices have shown higher annualized volatility compared to large-cap indices. For instance, over long periods, the Nifty Smallcap 100 has displayed greater short-term fluctuations compared to the Nifty 50, though it has also offered higher potential returns over a 10-year horizon.
Periods of extreme volatility often follow market corrections or macroeconomic uncertainty—like the 2008 global financial crisis or the 2020 pandemic. However, in recovery phases, small caps tend to rebound faster and outperform, as investors return to riskier growth opportunities.
4. Measuring Volatility in Small-Cap Funds
Volatility can be measured using several metrics:
a) Standard Deviation
It measures how much a fund’s returns deviate from its average over time. A higher standard deviation indicates greater volatility. Small-cap index funds typically have a higher standard deviation than mid- or large-cap funds.
b) Beta
Beta measures a fund’s sensitivity to the overall market. A beta greater than 1 indicates that the fund is more volatile than the market. Small-cap funds usually have betas ranging from 1.2 to 1.5, meaning they move more sharply in both directions compared to broader market indices.
c) Sharpe Ratio
This metric shows how much excess return a fund provides per unit of risk. Although small-cap funds may have high volatility, if they generate proportionately higher returns, they can still deliver a favorable Sharpe ratio.
5. Short-Term vs Long-Term Volatility
Volatility matters most in the short term. Over days, weeks, or months, small-cap index funds can experience large swings—sometimes 5–10% in a single session during turbulent times.
However, over long investment horizons (5–10 years), these fluctuations tend to average out. Historically, investors who remained invested through multiple market cycles often benefited from the compounding effect of growth in small companies that later became mid- or large-cap giants.
6. Benefits of Volatility: Hidden Opportunities
While volatility often sounds negative, it also presents opportunities for disciplined investors:
Higher Growth Potential: Small companies have more room to grow their earnings, and as their valuations expand, investors benefit from capital appreciation.
Mean Reversion: After sharp sell-offs, small-cap indices often recover quickly, offering attractive entry points.
Diversification Advantage: Adding a small-cap index fund to a portfolio primarily composed of large-cap stocks can improve overall portfolio returns and balance risk.
Thus, for long-term investors who can tolerate fluctuations, volatility can be a friend, not a foe.
7. Managing Volatility: Smart Investment Strategies
To navigate small-cap volatility effectively, investors can adopt several strategies:
a) Long-Term Approach
Holding investments for 7–10 years allows time for small-cap companies to grow and for short-term volatility to even out.
b) Systematic Investment Plan (SIP)
Investing through SIPs helps average out the cost of purchase across market cycles, reducing the impact of volatility.
c) Diversification
Balancing small-cap exposure with mid-cap and large-cap funds creates a more stable portfolio. This helps cushion against sudden declines in the small-cap space.
d) Regular Review
Monitoring fund performance relative to benchmarks ensures that the fund continues to align with your risk tolerance and financial goals.
e) Avoid Market Timing
Trying to predict highs and lows in volatile segments often backfires. Staying invested consistently usually yields better results than frequent trading.
8. Who Should Invest in Small-Cap Index Funds?
Small-cap index funds are not suitable for everyone. They best fit investors who:
Have a high risk tolerance
Seek long-term capital growth
Can withstand temporary market declines
Understand that volatility is part of the journey toward higher returns
For conservative investors or those nearing financial goals, it’s advisable to keep small-cap allocation limited (say 10–15% of the equity portfolio).
9. Real-World Example
Consider the Nifty Smallcap 100 Index. Between March 2020 and November 2021, it surged over 150%, reflecting a massive post-pandemic recovery. Yet, in 2022, the same index dropped around 25% due to global inflation concerns and rate hikes. This wide swing highlights the volatility inherent in small caps—but also their recovery power.
10. Conclusion
Volatility in small-cap index funds is not inherently bad—it’s a reflection of the growth potential and risk embedded in smaller businesses. These funds fluctuate more because they mirror the economic pulse of emerging companies—dynamic, ambitious, and vulnerable.
For patient, informed, and risk-tolerant investors, small-cap index funds can be powerful tools for long-term wealth creation. However, success requires discipline: understanding the market cycles, managing emotions during downturns, and staying invested long enough for volatility to transform into opportunity.
Part 4 Learn Institutional Trading Key Terminology in Option Trading
To understand options, one must be familiar with some basic terms:
Underlying Asset: The instrument on which the option is based (e.g., stock, index, or commodity).
Strike Price: The price at which the option holder can buy (call) or sell (put) the asset.
Premium: The cost paid by the option buyer to acquire the contract.
Expiration Date: The date when the option contract becomes void.
In-the-Money (ITM): A call option is ITM when the underlying price is above the strike; a put is ITM when the price is below the strike.
Out-of-the-Money (OTM): The opposite of ITM. The call option has no intrinsic value when the price is below the strike; a put option has none when the price is above the strike.
At-the-Money (ATM): When the underlying price and strike price are nearly equal.
Intrinsic Value: The actual profit if the option were exercised immediately.
Time Value: The portion of the premium that reflects the probability of the option gaining value before expiry.

Divergence Secrets How Option Pricing Works
The price (premium) of an option is influenced by several factors, collectively known as the “Option Greeks”:
Delta: Measures how much the option price changes with a ₹1 change in the underlying asset.
Gamma: Indicates the rate of change of Delta.
Theta: Represents the time decay of the option’s value as it approaches expiry.
Vega: Measures sensitivity to volatility.
Rho: Indicates sensitivity to interest rate changes.
Additionally, the volatility of the underlying asset and time to expiry play crucial roles in determining option prices. Higher volatility increases the premium, as uncertainty boosts the potential for profit.

Part 11 Tradig Master ClassKey Terminologies
Strike Price: The fixed price at which the asset can be bought or sold.
Premium: The cost paid by the buyer to the seller (writer) of the option for the rights granted by the contract.
Expiration Date: The date on which the option contract expires.
In-the-Money (ITM): When exercising the option would result in a profit.
Out-of-the-Money (OTM): When exercising the option would result in a loss.

Introduction: Understanding Domestic Equity Markets1. What Are Domestic Equity Markets?
The domestic equity market refers to the marketplace within a country where stocks or shares of companies incorporated in that country are bought and sold. It differs from foreign equity markets, where investors trade shares listed in other countries.
When investors buy shares in a domestic company, they are essentially purchasing a small portion of ownership in that company. This ownership entitles them to a share of the profits (through dividends) and potential capital appreciation if the company grows in value.
Key Characteristics
Local Listings: Companies listed on domestic exchanges must comply with the country's regulatory framework.
Domestic Investors: Participants primarily include local individuals, institutions, and sometimes government agencies.
Currency: All transactions occur in the local currency (e.g., INR in India).
Regulation: Markets are governed by national financial authorities such as SEBI (Securities and Exchange Board of India), which ensures transparency and fairness.
2. Structure and Components of Domestic Equity Markets
Domestic equity markets are made up of several key components that together ensure smooth operation, liquidity, and trust.
a. Stock Exchanges
Stock exchanges are the primary platforms where shares are listed and traded. In India, the BSE (established in 1875) is Asia’s oldest exchange, while the NSE (founded in 1992) revolutionized trading with its electronic and transparent system. These exchanges facilitate both primary and secondary market activities.
b. Primary Market
The primary market is where new securities are issued for the first time. Companies raise funds by offering shares to the public through an Initial Public Offering (IPO) or Follow-on Public Offering (FPO).
This stage is crucial as it provides companies with capital for expansion and gives investors an opportunity to invest at the ground level.
c. Secondary Market
Once shares are issued, they are traded among investors in the secondary market. This segment provides liquidity, allowing investors to buy or sell their holdings anytime. The continuous buying and selling determine stock prices based on demand and supply dynamics.
d. Market Participants
Domestic equity markets attract a diverse range of participants:
Retail Investors: Individual investors trading for personal portfolios.
Institutional Investors: Mutual funds, insurance companies, and pension funds managing large pools of capital.
Foreign Institutional Investors (FIIs): Though part of the domestic exchange, they bring in global capital.
Market Makers and Brokers: Entities that ensure liquidity and execution of trades.
3. Role of Domestic Equity Markets in the Economy
The domestic equity market is not just a place for investors to earn returns—it is a critical pillar supporting economic development.
a. Capital Formation
Equity markets help companies raise long-term capital without borrowing. This capital fuels expansion, innovation, and job creation, contributing to GDP growth.
b. Wealth Creation
As companies grow and generate profits, their stock prices appreciate. Investors benefit through capital gains and dividends, leading to wealth accumulation and financial empowerment of citizens.
c. Resource Allocation
Equity markets efficiently allocate resources by channeling savings into productive investments. The performance of listed companies acts as a signal to attract or divert capital based on efficiency and profitability.
d. Economic Indicator
Stock market trends often mirror the broader economy. A rising market generally signals optimism about economic growth, while falling markets can reflect uncertainty or contraction.
e. Enhancing Corporate Governance
Listed companies are subject to strict disclosure and governance standards. Regular reporting builds transparency and accountability, improving overall business ethics and investor confidence.
4. Factors Influencing Domestic Equity Markets
Several internal and external factors influence the movement of domestic equity markets. Understanding these helps investors make informed decisions.
a. Economic Factors
GDP Growth: A growing economy usually means better business prospects, pushing stock prices higher.
Inflation: Moderate inflation is manageable, but high inflation erodes purchasing power and corporate profitability.
Interest Rates: Rising interest rates make borrowing costlier and reduce stock market appeal compared to fixed-income securities.
b. Corporate Performance
Quarterly earnings reports, management commentary, and future guidance play a crucial role in determining investor sentiment toward specific companies.
c. Government Policies
Fiscal policies, taxation, and reforms like “Make in India” or “PLI schemes” directly affect corporate profitability and investor confidence.
d. Global Influences
Even though domestic markets focus on local companies, they are not isolated. Global oil prices, U.S. Federal Reserve decisions, or geopolitical tensions often impact domestic equities.
e. Market Sentiment and Psychology
Sometimes, markets move more on emotions than on fundamentals. Herd behavior, speculation, or social media-driven sentiment can lead to sharp price swings—similar to what we saw during the “meme stock” trend.
5. Major Segments of Domestic Equity Markets
Domestic equity markets are classified into different segments based on company size, industry, and type of trading.
a. Large-cap, Mid-cap, and Small-cap Stocks
Large-cap: Stable, established companies with high market capitalization (e.g., Reliance, TCS).
Mid-cap: Growing firms with moderate capitalization offering higher growth potential but slightly higher risk.
Small-cap: Emerging or niche companies with lower market capitalization and higher volatility but potentially higher returns.
b. Sectoral Indices
Equity markets are divided into sectors like IT, Banking, FMCG, Energy, and Healthcare. Sectoral performance often reflects changing consumer behavior and policy priorities.
c. Derivatives Market
Futures and options allow traders to hedge risk or speculate on price movements, adding depth and liquidity to the overall market.
6. The Indian Domestic Equity Market Landscape
India’s equity market has evolved remarkably over the past three decades. From paper-based trading floors to fully digital platforms, the transformation has been revolutionary.
a. Growth and Global Recognition
The Indian market is now among the world’s top five in market capitalization. Indices like Nifty 50 and Sensex are globally tracked benchmarks representing economic progress.
b. Participation Expansion
Technological advances, mobile trading apps, and demat accounts have democratized investing. Retail participation surged post-2020, with millions of first-time investors entering the market.
c. Regulatory Framework
The Securities and Exchange Board of India (SEBI) plays a critical role in ensuring investor protection, market integrity, and corporate compliance. Regular audits, fair disclosure norms, and surveillance systems maintain transparency.
d. Emerging Trends
Rise of ESG Investing (Environmental, Social, Governance): Investors now prioritize sustainable and ethical companies.
SME & Startup Listings: Platforms like NSE Emerge support small and medium enterprises in raising capital.
Increased Algorithmic & Quant Trading: Technology-driven strategies enhance liquidity and efficiency.
7. Risks and Challenges in Domestic Equity Markets
While the equity market offers substantial opportunities, it is not without risks.
a. Market Volatility
Prices fluctuate due to economic or geopolitical factors. Investors must manage this risk through diversification and long-term perspective.
b. Liquidity Risk
Smaller-cap stocks or niche sectors may face low trading volumes, making it difficult to enter or exit positions without affecting prices.
c. Information Asymmetry
Despite regulations, insider information or misinformation can still distort fair market functioning.
d. Behavioral Biases
Emotional investing—such as chasing trends or panic selling—often leads to poor outcomes.
e. Regulatory and Policy Changes
Sudden shifts in taxation or compliance rules can temporarily disrupt markets and investor sentiment.
8. The Role of Technology in Domestic Equity Markets
Technology has transformed how markets operate and how investors participate.
a. Electronic Trading Systems
Automation has reduced transaction costs and improved execution speed and transparency.
b. Online Brokerage and Mobile Platforms
Retail investors can now trade from anywhere, access data analytics, and invest with minimal capital.
c. Artificial Intelligence and Big Data
AI-driven tools analyze market sentiment, patterns, and forecasts, empowering smarter investment decisions.
d. Blockchain Integration
Future markets may use blockchain for settlement, transparency, and security—reducing fraud and delays.
9. The Future of Domestic Equity Markets
Looking ahead, domestic equity markets are poised to play an even greater role in shaping economic growth and financial inclusion.
a. Deepening Retail Participation
Financial literacy programs and simplified digital access will bring millions of new investors into equity markets.
b. Integration with Global Markets
Domestic markets will increasingly align with global standards, attracting more foreign investments.
c. Sustainable and Impact Investing
The focus will shift toward long-term, responsible investments that support environmental and social goals.
d. Policy and Innovation Support
Government initiatives to boost entrepreneurship, infrastructure, and manufacturing will fuel new listings and investment opportunities.
Conclusion
Understanding domestic equity markets is essential for anyone interested in how economies grow, how companies fund innovation, and how individuals can build wealth. These markets represent the pulse of a nation’s economic vitality—reflecting collective expectations, aspirations, and confidence.
From traditional trading floors to algorithm-driven platforms, domestic equity markets have come a long way. They not only enable capital formation and wealth creation but also serve as powerful mechanisms of economic democracy—allowing ordinary citizens to become stakeholders in the country’s progress.
As India and other emerging economies continue to rise, domestic equity markets will remain the beating heart of their financial systems—driving growth, fostering innovation, and connecting people to prosperity.

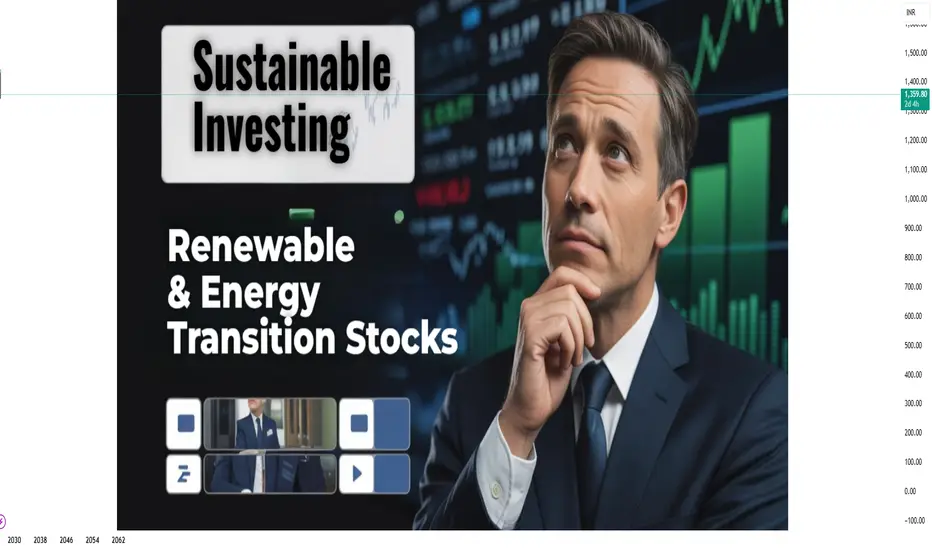
Renewable & Energy Transition Stocks – The Future of Sustainable1. Introduction: The Global Energy Shift
The 21st century has witnessed a dramatic transformation in how the world generates and consumes energy. The era of fossil fuels — coal, oil, and gas — which once powered industrial revolutions and global economies, is now giving way to cleaner, sustainable alternatives. This shift, termed the Energy Transition, refers to the movement from carbon-intensive energy sources to low-carbon and renewable ones like solar, wind, hydro, bioenergy, and green hydrogen.
The driving forces behind this transition are multifold:
Climate Change Concerns: Rising global temperatures and carbon emissions have triggered urgent calls for decarbonization.
Technological Advancements: The cost of solar and wind energy has fallen by over 80% in the last decade.
Government Policies: Global accords like the Paris Agreement and domestic policies such as India’s National Green Hydrogen Mission are pushing clean energy adoption.
Investor Sentiment: ESG (Environmental, Social, Governance) investing has grown exponentially, favoring companies aligned with sustainability.
As a result, renewable and energy transition stocks have emerged as one of the most exciting themes in modern markets, offering long-term growth prospects while aligning with global sustainability goals.
2. Understanding Renewable & Energy Transition Stocks
Renewable and energy transition stocks are companies involved in producing, developing, or enabling clean and sustainable energy technologies. These may include:
Renewable energy producers – Solar, wind, hydro, geothermal.
Equipment manufacturers – Solar panels, wind turbines, inverters.
Energy storage & battery companies – Lithium-ion, solid-state batteries.
Green hydrogen producers – Companies working on electrolysis and hydrogen fuel infrastructure.
Electric vehicle (EV) ecosystem firms – Battery suppliers, charging network operators, EV manufacturers.
Grid modernization and smart energy firms – Companies enabling efficient distribution and storage of renewable energy.
These businesses are at the forefront of what is often called the “Green Industrial Revolution.”
3. The Global Landscape of Renewable Energy
Globally, renewable energy has reached an inflection point. According to the International Energy Agency (IEA), renewables are expected to account for more than 50% of global electricity generation by 2030.
Key trends include:
Solar Power Boom: Solar PV capacity is doubling roughly every three years, making it the cheapest energy source in many regions.
Wind Energy Expansion: Offshore wind is gaining strong momentum in Europe and Asia.
Battery Storage Growth: Global battery capacity is projected to grow 20-fold by 2030, crucial for stabilizing intermittent renewable sources.
Green Hydrogen Revolution: Countries like Japan, Germany, and India are investing billions to develop hydrogen as a clean fuel alternative for heavy industries and transport.
Carbon Trading & ESG Investing: Institutional investors are allocating capital towards companies that meet sustainability benchmarks.
4. India’s Renewable Energy Revolution
India has emerged as a global leader in renewable energy adoption. With a strong policy push, ambitious targets, and a growing domestic industry, India’s clean energy ecosystem is rapidly expanding.
Key Highlights:
Installed Renewable Capacity: Over 190 GW (as of 2025), out of a total power capacity of ~440 GW.
Target: 500 GW of non-fossil fuel-based capacity by 2030.
Solar Energy: India ranks among the top 5 globally in solar installations, driven by states like Rajasthan, Gujarat, and Tamil Nadu.
Wind Power: Tamil Nadu and Gujarat lead India’s onshore wind capacity.
Hydrogen & EV Push: The National Green Hydrogen Mission aims to make India a global hub for hydrogen production and export.
Government Support: Initiatives like the PLI (Production Linked Incentive) schemes, Renewable Purchase Obligations (RPOs), and Carbon Credit Frameworks are fueling sectoral growth.
5. Major Segments in the Energy Transition Ecosystem
A. Solar Energy
Solar power is the crown jewel of the renewable revolution. Falling panel costs, improved efficiency, and government subsidies have made it highly competitive.
Key Indian Players:
Adani Green Energy Ltd. (AGEL): One of the world’s largest solar power developers with over 20 GW pipeline projects.
Tata Power Renewable Energy Ltd.: Focused on solar EPC, rooftop solar, and battery storage.
Waaree Energies & Vikram Solar: Leading module manufacturers benefiting from domestic demand and exports.
B. Wind Energy
Wind remains a crucial pillar, particularly for coastal and high-wind states.
Key Players:
Suzlon Energy Ltd.: India’s leading wind turbine manufacturer, rebounding from past debt with new orders.
Inox Wind Ltd.: Active in turnkey projects and turbine manufacturing.
C. Energy Storage & Battery Technology
The renewable revolution is incomplete without storage solutions. Batteries stabilize grid supply and support EVs.
Leading Firms:
Amara Raja Energy & Mobility Ltd.
Exide Industries Ltd.
Tata Chemicals (in EV battery materials).
Reliance Industries Ltd. (building Giga factories for cell manufacturing).
D. Electric Vehicles & Charging Infrastructure
EVs are a cornerstone of the clean energy transition. With government incentives (FAME II, PLI), India’s EV ecosystem is expanding fast.
Top Stocks:
Tata Motors: Leading EV carmaker.
Olectra Greentech: Electric bus manufacturer.
Exicom Tele-Systems & Servotech Power Systems: EV charging infrastructure.
Ola Electric: Upcoming IPO; focuses on two-wheelers and battery tech.
E. Green Hydrogen & Fuel Cells
Hydrogen is expected to revolutionize industrial and heavy transport sectors.
Top Indian Participants:
Reliance Industries: Investing heavily in green hydrogen and solar.
NTPC & IOC: Setting up pilot hydrogen projects.
Larsen & Toubro (L&T): Partnering in electrolyzer manufacturing.
F. Power Utilities Transitioning to Green
Traditional energy companies are also diversifying into renewables.
Examples:
NTPC Green Energy Ltd.
JSW Energy Ltd.
Torrent Power Ltd.
These firms are gradually reducing coal dependency and increasing renewable capacity.
6. Financial Performance & Market Trends
Renewable energy stocks have been among the top performers globally over the past five years.
In India, several renewable and transition-related stocks have delivered multibagger returns due to strong project pipelines, policy support, and rising energy demand.
Key Market Drivers:
Falling Input Costs: Lower cost of solar modules, wind turbines, and storage systems.
Strong Policy Support: Clear long-term targets and PLI incentives.
Rising Institutional Interest: ESG and green funds are channeling massive capital into this space.
Corporate Decarbonization Goals: Large corporations are sourcing renewable power for sustainability commitments.
However, volatility remains due to:
Supply chain disruptions (solar modules, lithium).
Interest rate fluctuations impacting capital-intensive projects.
Policy execution delays in large-scale installations.
7. Global Leaders in Renewable & Transition Stocks
Globally, several companies lead the charge:
NextEra Energy (USA): One of the world’s largest renewable power generators.
Enphase Energy & SolarEdge (USA): Specialize in solar inverters and microinverters.
Vestas (Denmark) & Siemens Gamesa (Spain): Global wind turbine giants.
Plug Power (USA) & Nel ASA (Norway): Leaders in hydrogen technology.
Tesla (USA): Beyond EVs, Tesla’s energy division is revolutionizing battery storage and solar solutions.
These global firms often set benchmarks for innovation and profitability in the sector, influencing investor sentiment in emerging markets like India.
8. Government Policies Driving India’s Energy Transition
India’s renewable momentum is underpinned by robust government initiatives:
National Solar Mission: Aims to make India a global solar leader.
PLI Scheme for Solar & Batteries: Incentives for domestic manufacturing to reduce import dependency.
Green Hydrogen Mission (₹19,744 crore): To produce 5 MMT of green hydrogen annually by 2030.
Energy Conservation Act Amendment (2022): Introduced carbon trading and stricter emission norms.
State-level Net Metering Policies: Promote rooftop solar adoption.
Such initiatives provide long-term policy stability and investor confidence.
9. Challenges Facing the Sector
Despite rapid growth, several hurdles persist:
High Capital Costs: Initial investments remain steep.
Land Acquisition Issues: Large-scale solar and wind projects need vast land areas.
Transmission Constraints: Renewable energy is often produced far from consumption centers.
Storage Limitations: Battery technology, though improving, remains expensive.
Policy Uncertainty: Frequent regulatory changes at the state level can affect project timelines.
Nevertheless, technology improvements and economies of scale are expected to reduce these challenges over time.
10. Future Outlook (2025–2035)
The next decade is expected to be transformational for renewable and energy transition stocks.
Growth Catalysts:
India’s commitment to Net Zero by 2070 ensures decades of policy and investment support.
Corporate Power Purchase Agreements (PPAs) will boost renewable demand.
Hydrogen & Battery Ecosystem Development will attract global partnerships.
Digitalization & AI Integration in energy management will improve efficiency.
Global Capital Inflows: Sovereign and ESG funds are increasing allocations to clean energy projects.
By 2030, India could see over $250 billion in renewable investments, creating immense opportunities for investors.
11. Investment Perspective: How to Approach the Sector
From an investment standpoint, renewable & transition stocks can be categorized as:
Core Energy Producers: Adani Green, NTPC Green, JSW Energy.
Equipment Manufacturers: Waaree Energies, Suzlon, Inox Wind.
Storage & Battery Makers: Amara Raja, Exide, Tata Chemicals.
EV Ecosystem Players: Tata Motors, Olectra, Servotech Power.
Diversified Conglomerates: Reliance, L&T, IOC (expanding into hydrogen and renewables).
Investors should focus on:
Long-term vision: These are structural growth stories, not short-term trades.
Strong balance sheets: Many players are capital-intensive.
Government-backed projects: Ensure visibility of revenues.
Technological advantage: Efficiency and innovation lead to higher margins.
12. Conclusion: The Dawn of a Green Era
The energy transition is not merely a policy trend — it’s a paradigm shift reshaping the global economy. Renewable and energy transition stocks are at the heart of this transformation, symbolizing the movement toward a sustainable, low-carbon future.
India stands at a unique juncture: with abundant sunlight, a vast coastline for wind potential, supportive policies, and entrepreneurial drive, it is poised to become one of the world’s top green energy hubs.
For investors, the renewable energy sector offers not just returns, but an opportunity to participate in building the energy foundation of the future. While short-term volatility may persist, the long-term trajectory is unmistakably upward — driven by innovation, necessity, and the world’s collective pursuit of sustainability.
ICICI Bank 1 Week Time Frame🧮 Key Levels (Weekly Timeframe Estimate)
Current price (as of 28 Oct 2025): ~ ₹1,377.70.
Support zone: ~ ₹1,330 – ₹1,345
Weekly pivot S2 is ~ ₹1,325.60 according to pivot table.
A little above that (~₹1,340) seems to act as a psychological floor.
Mid / pivot zone: ~ ₹1,360 – ₹1,385
The weekly pivot point standard is ~ ₹1,362.40.
The current price is just above this pivot zone, meaning if price falls back toward it, this zone will be key.
Resistance zone: ~ ₹1,420 – ₹1,460
Weekly R1 ~ ₹1,382.20, R2 ~ ₹1,399.20, R3 ~ ₹1,419.00 from the same pivot table.
From chart context many analysts mark ~ ₹1,424-₹1,437 as potential resistance.

Buy at base candle - ICICIBANKA base candle is typically:
- The lowest point in a recent downtrend before price starts to reverse.
- A candle with low wick rejection and volume confirmation, signaling buyer interest.
There is a hammer on 14OCT25 is the confirmation.
AMO Order placed.
I will exit anyday before 14 days.

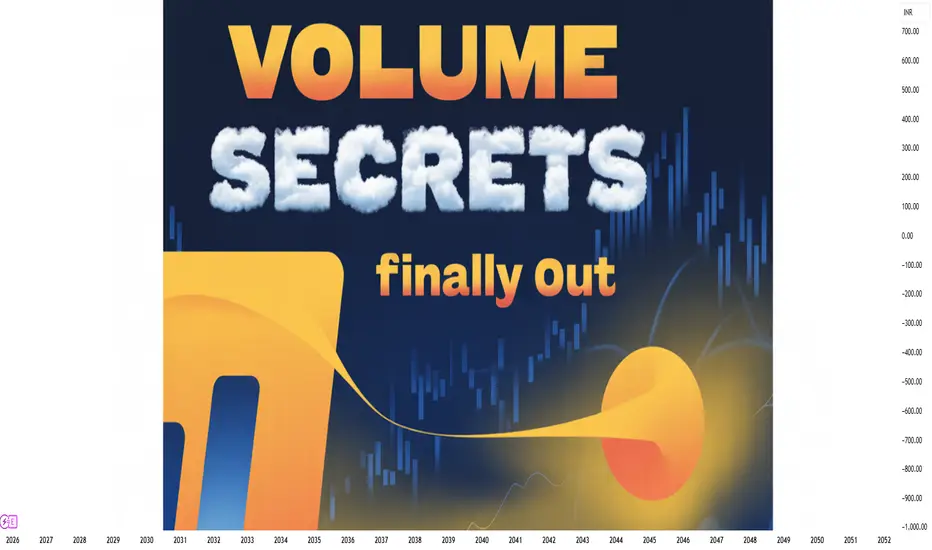
Trading Volume Secrets Finally OutIntroduction: The Hidden Power Behind Market Movements
In the world of financial markets, price is often the first thing traders look at — but it’s not the whole story. Beneath every price chart lies another powerful force: trading volume. While price tells us what is happening, volume reveals why. Understanding trading volume can uncover the true intentions of large institutional players, validate price trends, and expose false breakouts before they trap unsuspecting traders.
For years, professional traders and institutions have quietly used volume analysis as their secret weapon — guiding their decisions on when to buy, sell, or stay out. Today, we reveal those trading volume secrets and explain how you can use them to your advantage.
1. What Is Trading Volume?
Trading volume represents the total number of shares, contracts, or units traded in a given period. In simple terms, it measures market activity and participation.
For example, if 10 million shares of a stock are exchanged in one day, its trading volume for that day is 10 million. High volume often means strong investor interest, while low volume reflects uncertainty or lack of conviction.
But beyond raw numbers, volume tells a deeper story — it shows how committed traders are to a price move. A rally with low volume is like a building on weak foundations; it may not stand for long. Conversely, a price move backed by heavy volume indicates strength and sustainability.
2. Why Volume Is the “Truth Teller” of the Market
Volume is often called the fuel of the market because price cannot move significantly without participation. Large institutions such as mutual funds, hedge funds, and banks execute trades in high volume, and their footprints appear in the volume data.
Let’s break down why volume is considered the ultimate confirmation tool:
Price without volume is illusion: If prices rise but volume stays low, it usually signals a temporary move — often driven by retail traders or short covering.
Volume precedes price: Many times, spikes in volume appear before a major trend reversal. Smart money often accumulates (buys quietly) or distributes (sells gradually) before the market reacts.
Volume confirms strength: Strong uptrends are characterized by increasing volume on rallies and decreasing volume on pullbacks. Weak trends show the opposite.
In essence, while prices can be manipulated in the short term, volume reveals the conviction behind the move.
3. The Hidden Patterns of Volume
Let’s explore the patterns and clues traders can extract from volume behavior:
a. Rising Volume with Rising Price
This is the hallmark of a strong bullish trend. When prices climb and volume increases simultaneously, it indicates growing confidence among buyers. Institutions are entering positions, and retail traders often follow later.
b. Falling Volume with Rising Price
This is a warning sign. It suggests that the rally may be losing momentum, with fewer participants supporting higher prices. Such moves are often followed by corrections.
c. Rising Volume with Falling Price
When volume expands as prices fall, it signals strong selling pressure — possibly from large investors exiting. This pattern often appears before or during a bearish trend.
d. Falling Volume with Falling Price
This pattern indicates a weakening downtrend. Sellers are losing interest, and a reversal could be near.
e. Volume Spikes
Sudden, unusually high volume often marks key turning points. For example, after a long decline, a massive surge in volume might signal capitulation — the moment when panic selling exhausts itself and a reversal begins.
4. The Volume–Price Relationship
One of the most powerful ways to read markets is through Volume Price Analysis (VPA) — a method popularized by legendary trader Richard Wyckoff. The concept is simple but profound:
“Price shows you the move. Volume shows you the intention.”
In VPA, traders analyze how price bars and volume bars interact to spot accumulation (buying) and distribution (selling) phases.
Key Scenarios:
Wide range up bar with high volume: Strong buying interest — bullish confirmation.
Wide range up bar with ultra-high volume but small price progress: Indicates potential selling into strength (distribution by smart money).
Narrow range down bar with high volume: Could signal absorption — buyers quietly accumulating as weak holders sell.
Narrow range bar with low volume: Market is quiet; often a precursor to a breakout or breakdown.
5. The Smart Money Volume Trap
One of the biggest volume secrets lies in understanding institutional behavior. Big players cannot simply buy or sell millions of shares at once without moving the market against themselves. Instead, they use volume manipulation tactics:
Accumulation Phase
Institutions quietly buy from retail sellers at lower prices.
Volume gradually increases but prices stay range-bound.
Fake breakdowns may occur to scare retail traders into selling.
Markup Phase
After accumulating enough, institutions push prices higher.
Volume rises sharply as retail traders jump in — too late.
The trend appears “obvious” now, but smart money is already positioned.
Distribution Phase
Prices stay high, but volume remains elevated.
Institutions offload their holdings to late entrants.
Once selling pressure exceeds buying demand, the trend reverses.
Markdown Phase
The market declines sharply as retail panic sets in.
Volume spikes again — institutions may start re-accumulating at lower levels.
Recognizing these volume cycles can help traders follow the smart money instead of fighting it.
6. Volume Indicators and Tools
Several technical indicators help traders interpret volume more effectively. Here are the most valuable ones:
a. On-Balance Volume (OBV)
Developed by Joseph Granville, OBV adds volume on up days and subtracts it on down days. It helps confirm trends:
If OBV rises while price rises → bullish confirmation.
If OBV falls while price rises → bearish divergence (possible reversal).
b. Volume Moving Average
A moving average of volume smooths out fluctuations, showing long-term participation trends. If current volume exceeds the average, a significant move may be starting.
c. Volume-Weighted Average Price (VWAP)
VWAP is the average price weighted by volume over a specific period. Institutional traders use it to gauge fair value and execute large orders without distorting the market.
d. Accumulation/Distribution Line (A/D)
This indicator measures the relationship between price and volume to determine whether a stock is being accumulated (bought) or distributed (sold).
e. Chaikin Money Flow (CMF)
CMF combines price and volume to assess buying and selling pressure. A positive CMF suggests accumulation, while a negative value signals distribution.
7. Volume and Breakouts: Separating Truth from Traps
Breakouts are among the most profitable — and most dangerous — trading setups. The secret to identifying genuine breakouts lies in volume:
True breakout: Strong volume confirms that many participants are involved, supporting the move.
False breakout: Low or declining volume suggests a lack of conviction, often leading to a quick reversal.
A simple rule:
No volume, no trust.
Before entering a breakout trade, always check if the breakout candle is backed by higher-than-average volume.
8. Using Volume in Different Markets
Volume analysis is not limited to stocks — it’s powerful across multiple asset classes:
a. Stock Market
Volume confirms institutional participation, validates price patterns (like head-and-shoulders or triangles), and signals breakouts.
b. Forex Market
While spot forex lacks centralized volume data, traders use tick volume (number of price changes) as a proxy. It closely mirrors real volume trends.
c. Futures and Commodities
Volume helps identify contract rollovers, open interest changes, and institutional positioning in commodities like oil, gold, or wheat.
d. Cryptocurrency Market
Crypto volume data is transparent and real-time. Tracking exchange volume and blockchain transaction volume can reveal whale (large holder) activity.
9. Volume Divergence: The Secret Reversal Signal
Volume divergence occurs when price moves in one direction, but volume does not confirm it. This often signals an upcoming reversal.
Example:
Price keeps making new highs, but volume is shrinking → buyers are losing strength.
Price falls to new lows, but volume declines → selling pressure is fading.
Such divergences often precede significant turning points — a key secret used by experienced traders.
10. How to Use Volume in Your Trading Strategy
Here’s a practical framework to integrate volume into your trading decisions:
Identify the trend direction using price action or moving averages.
Confirm trend strength by checking if volume supports the move.
Spot accumulation or distribution zones by observing volume spikes in sideways ranges.
Validate breakouts or breakdowns using volume surges.
Watch for divergence between price and volume to anticipate reversals.
Use volume indicators like OBV or VWAP to add confirmation.
Avoid low-volume environments, as they often lead to false signals and poor liquidity.
11. Psychological Secrets Hidden in Volume
Volume is not just a technical metric — it reflects trader psychology. Every spike in volume represents emotional intensity — fear, greed, or panic. Understanding this psychology can give traders an edge:
High volume at peaks: Euphoria and greed dominate; retail traders rush in.
High volume at bottoms: Panic selling and capitulation occur; smart money steps in.
Steady volume rise: Confidence builds gradually — a healthy trend.
Volume drop: Uncertainty, hesitation, or lack of interest.
Reading volume is like listening to the market’s heartbeat. It tells you when enthusiasm grows, when fear spreads, and when calm returns.
12. Common Mistakes in Volume Analysis
Even though volume is powerful, traders often misuse it. Avoid these pitfalls:
Ignoring context — volume must always be read alongside price action.
Comparing volume across different assets — what’s high for one stock may be low for another.
Focusing only on daily volume — intraday and weekly patterns provide richer insights.
Assuming every spike means reversal — sometimes it’s just news-driven volatility.
13. The Future of Volume Analysis
With algorithmic and high-frequency trading dominating modern markets, volume analysis is evolving. Artificial intelligence tools now analyze not just how much volume trades, but who is trading it — institutions, retail investors, or algorithms.
Smart traders use volume profile tools to study how volume is distributed across price levels, identifying zones of high interest called value areas. These act as support and resistance levels far stronger than those based on price alone.
Conclusion
Trading volume is far more than a simple statistic — it’s the hidden force that drives markets. It reflects participation, conviction, and emotion, providing traders with vital clues that price alone cannot offer.
By mastering volume analysis, traders can see beneath the surface of price movements — spotting accumulation before rallies, distribution before crashes, and false breakouts before they trap the crowd.
In essence, volume is the truth teller of the market. When price and volume move together, trends thrive. When they diverge, caution is warranted. Understanding these volume secrets transforms ordinary chart reading into professional market analysis — the same skill that separates the pros from the amateurs.
Part 2 Intraday TradingTypes of Options
There are two main types of options:
a. Call Option
A Call Option gives the holder the right to buy an asset at a specific price within a set time.
Traders buy call options when they expect the price of the asset to rise.
Example:
If a stock is trading at ₹100 and you buy a call option with a strike price of ₹110, you will profit if the stock rises above ₹110 before expiry.
b. Put Option
A Put Option gives the holder the right to sell an asset at a specific price within a set time.
Traders buy put options when they expect the price of the asset to fall.
Example:
If the stock is at ₹100 and you buy a put option with a strike price of ₹90, you will profit if the stock price falls below ₹90 before expiry.

Trading with CandlesticksIntroduction
Candlestick trading is one of the most widely used and powerful methods in technical analysis. It provides a visual and psychological representation of price movement over a specific time frame. Originating in Japan in the 18th century, candlestick charts were first used by rice traders to predict price movements based on market emotions. Today, traders worldwide—from beginners to institutional professionals—use candlesticks to identify trends, reversals, and potential entry or exit points in financial markets, including stocks, forex, commodities, and cryptocurrencies.
Candlestick charts combine simplicity and depth, revealing not just price direction but also market sentiment, momentum, and volatility—all in one glance. Let’s explore in detail how candlestick trading works, its patterns, and strategies to apply it effectively.
1. What Are Candlesticks?
A candlestick represents the price action of an asset within a specific time frame (for example, 1 minute, 1 hour, 1 day, or 1 week). Each candlestick shows four key data points:
Open – The price at which the asset began trading during that period.
Close – The price at which it finished trading for that period.
High – The highest price reached during that period.
Low – The lowest price during that period.
These data points are displayed in a rectangular shape called the body, with thin lines extending above and below, known as wicks or shadows.
Bullish Candle: When the closing price is higher than the opening price (usually shown in green or white).
Bearish Candle: When the closing price is lower than the opening price (usually shown in red or black).
The length of the body and shadows helps traders understand market momentum and psychological pressure between buyers (bulls) and sellers (bears).
2. Anatomy of a Candlestick
To interpret a candlestick effectively, one must understand its components:
Long Body: Indicates strong buying or selling pressure.
Short Body: Suggests indecision or consolidation.
Long Upper Shadow: Sellers pushed the price down after buyers initially drove it up.
Long Lower Shadow: Buyers pushed the price up after sellers initially drove it down.
No Shadows (Marubozu): Represents strong conviction from either buyers or sellers throughout the session.
For example:
A bullish marubozu (long green candle without shadows) signals strong buying interest.
A bearish marubozu (long red candle) indicates strong selling pressure.
3. History and Origin of Candlestick Charts
Candlestick analysis dates back to the 1700s when Munehisa Homma, a Japanese rice trader, developed this technique to forecast rice prices. He realized that human emotions influenced market behavior, and by studying price patterns, he could predict future movements. His concepts of “bullish” and “bearish” sentiment still form the foundation of technical trading today.
Candlestick analysis was later introduced to Western markets by Steve Nison in the 1990s through his book “Japanese Candlestick Charting Techniques.” Since then, it has become a fundamental part of modern trading.
4. Advantages of Candlestick Trading
Candlestick charts offer several advantages over traditional bar or line charts:
Visual Clarity: Candles make it easy to identify patterns and reversals quickly.
Psychological Insight: Each candle shows who controls the market—buyers or sellers.
Works Across Markets: Effective in equities, forex, commodities, and crypto.
Combines Well With Other Tools: Traders often combine candlestick patterns with indicators like RSI, MACD, or moving averages for confirmation.
Time Flexibility: Works equally well across intraday, daily, or weekly charts.
5. Major Candlestick Patterns
Candlestick patterns are combinations of one or more candles that help predict market direction. They can be single, double, or triple candle patterns.
A. Single Candlestick Patterns
Doji:
Open and close prices are almost equal, forming a cross-like shape.
Indicates market indecision and potential reversal.
Types: Long-Legged Doji, Dragonfly Doji, Gravestone Doji.
Hammer:
Small body, long lower shadow.
Appears after a downtrend, signaling a potential bullish reversal.
Inverted Hammer:
Small body with a long upper shadow.
Suggests buyers are gaining strength after a downtrend.
Shooting Star:
Opposite of an inverted hammer; occurs at the top of an uptrend.
Indicates a potential bearish reversal.
Spinning Top:
Small body with long upper and lower shadows.
Reflects indecision, often preceding a breakout.
B. Double Candlestick Patterns
Bullish Engulfing:
A small red candle followed by a large green candle that completely engulfs it.
Suggests strong buying momentum and a possible uptrend.
Bearish Engulfing:
A small green candle followed by a large red candle that engulfs it.
Indicates potential downward reversal.
Piercing Pattern:
Appears after a downtrend; the second candle (bullish) opens lower but closes above the midpoint of the first candle.
Dark Cloud Cover:
Appears after an uptrend; the second candle (bearish) opens higher but closes below the midpoint of the first candle.
C. Triple Candlestick Patterns
Morning Star:
Three-candle bullish reversal pattern.
Consists of a bearish candle, a small indecisive candle (Doji or Spinning Top), and a strong bullish candle.
Evening Star:
Bearish version of the Morning Star; signals the end of an uptrend.
Three White Soldiers:
Three consecutive long green candles.
Confirms strong bullish sentiment and trend continuation.
Three Black Crows:
Three long red candles; a clear sign of bearish strength and trend reversal.
6. How to Trade Using Candlestick Patterns
To effectively trade with candlestick patterns, traders must combine pattern recognition with market context. Here’s a step-by-step guide:
Step 1: Identify the Trend
Before entering a trade, determine the overall trend using moving averages or trendlines.
Candlestick patterns are most reliable when traded in alignment with the broader trend.
Step 2: Spot a Reversal or Continuation Pattern
Look for patterns like hammers, engulfing candles, or stars near key support/resistance zones.
Confirm with volume—higher volume adds credibility to the pattern.
Step 3: Confirm With Indicators
Use indicators like RSI (for overbought/oversold conditions), MACD (for trend confirmation), or Bollinger Bands (for volatility signals).
Step 4: Plan Entry and Exit
For bullish patterns: Enter near the candle close or on the next candle’s breakout.
For bearish patterns: Enter when price breaks below the pattern low.
Set stop-loss below the pattern’s shadow (for long trades) or above it (for short trades).
Step 5: Manage Risk
Always use stop-loss orders.
Avoid over-leveraging.
Follow a risk-reward ratio of at least 1:2.
7. Combining Candlesticks with Support and Resistance
Support and resistance levels are critical in candlestick analysis:
Support: A price level where buying pressure is strong enough to prevent further decline.
Resistance: A level where selling pressure prevents price from rising.
When a candlestick reversal pattern appears near these levels (e.g., hammer at support or shooting star at resistance), the signal’s reliability increases significantly.
8. Candlestick Patterns and Market Psychology
Each candlestick tells a story about the battle between bulls and bears. Understanding this psychology helps predict the next move:
Long bullish candle: Buyers dominated the session.
Long bearish candle: Sellers controlled the market.
Doji: Both sides are uncertain; possible reversal ahead.
Engulfing pattern: Indicates a sudden shift in sentiment.
This emotional representation gives traders an edge in anticipating future price behavior.
9. Common Mistakes in Candlestick Trading
Ignoring Market Context:
Patterns are less reliable without trend confirmation.
Trading Every Pattern:
Not all patterns lead to reversals; combine with volume and indicators.
Neglecting Risk Management:
Even reliable patterns can fail; always use stop-loss.
Overcomplicating Charts:
Stick to key time frames and clear patterns—avoid chart clutter.
10. Modern Application of Candlestick Trading
With digital platforms and AI-based charting tools, traders now have access to automatic pattern recognition. Platforms like TradingView, MetaTrader, and ThinkorSwim help identify and validate candlestick formations in real time. Algorithms even analyze sentiment and probability to enhance decision-making.
However, human interpretation remains irreplaceable. The trader’s intuition, experience, and understanding of market psychology remain essential for success.
11. Example of a Practical Candlestick Setup
Scenario: Stock XYZ is in a downtrend and approaches a major support level.
You notice:
A long Hammer candle forms at support.
RSI shows oversold conditions (<30).
Volume spikes, suggesting buying interest.
Trade Plan:
Entry: On the next candle when price breaks above the hammer’s high.
Stop-Loss: Below the hammer’s low.
Target: 2x the risk or next resistance level.
This combination of candlestick, support, and indicator confirmation makes for a high-probability trade setup.
12. Advantages and Limitations
Advantages:
Quick visual analysis.
Applies to all asset classes.
Helps identify sentiment shifts early.
Limitations:
False signals during volatile markets.
Requires experience to interpret correctly.
Should be used with supporting tools, not in isolation.
Conclusion
Candlestick trading is a time-tested and psychologically rich method for understanding market behavior. It reflects the constant struggle between buyers and sellers, allowing traders to interpret emotions through price movements. Whether you’re trading stocks, forex, or crypto, mastering candlestick patterns helps you make informed decisions, manage risk, and anticipate market shifts.
However, no pattern guarantees success—discipline, context, and confirmation are key. When combined with sound risk management and fundamental analysis, candlestick trading becomes not just a charting method but a strategic framework for consistent and intelligent trading.
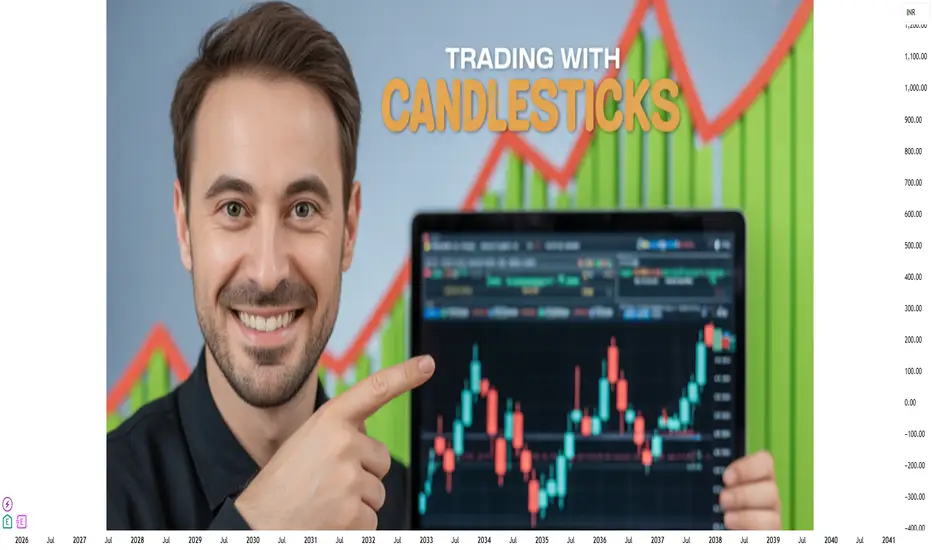
ICICI BANK ( 1D ) 🎯 TRADING PLAN 🎯
✔ Price Action shows strong support
At the 78.60% Fibonacci Retracement
With a Bullish Harami Candlestick
Pattern.
✔ RSI being Oversold adds weight to
The setup.
💡 Success in trading doesn't come from
Predicting the future ; it's come from
Disciplined decision making.
Disclaimer : All information is for
Educational & Informational
Purpose Only. Not a buy / sell
Recommendation. You are
Solely responsible for your
Trading & Investment decisions
