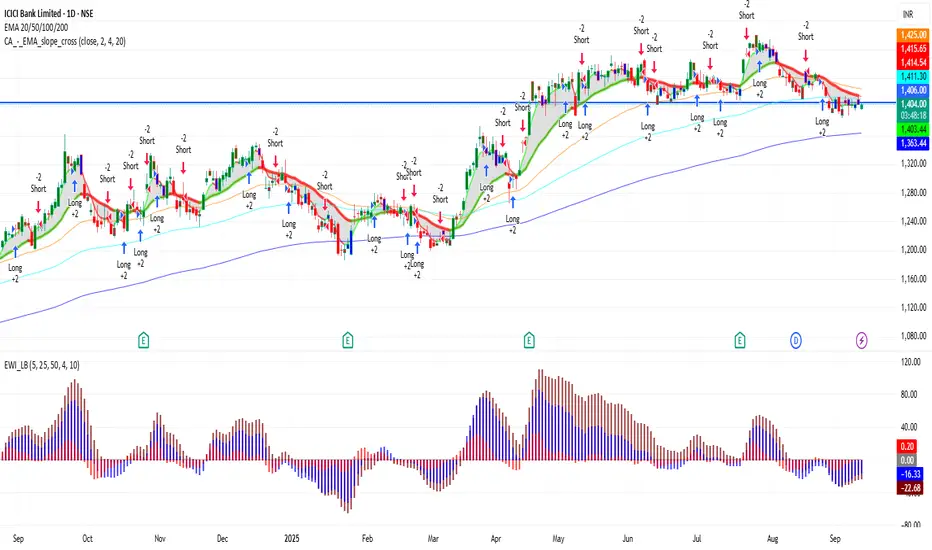
ICICIBANK 1D Time frame📊 Current Snapshot
Current Price: ₹1,406.10
Day’s Range: ₹1,402.00 – ₹1,416.35
52-Week Range: ₹1,186.00 – ₹1,500.00
Previous Close: ₹1,403.90
Opening Price: ₹1,403.70
Market Cap: ₹10.02 lakh crore
Volume: ~81.3 lakh shares
📈 Trend & Indicators
Trend: Neutral to mildly bullish; trading near 50-day and 200-day moving averages.
RSI (14): 60 – Neutral; no immediate overbought or oversold conditions.
MACD: Positive → indicates bullish momentum.
Moving Averages: Short-term moving averages suggest neutral to slightly bullish outlook.
🔮 Outlook
Bullish Scenario: Break above ₹1,416 with strong volume could target ₹1,450.
Bearish Scenario: Drop below ₹1,400 may lead to further decline toward ₹1,375.
Neutral Scenario: Consolidation between ₹1,400 – ₹1,416; breakout needed for directional move.
📌 Key Factors to Watch
Market Sentiment: Overall market trend and investor behavior.
Economic Indicators: Interest rates, inflation, and RBI policy updates.
Global Cues: Global market trends, US indices, crude oil, and currency movements.
Trade ideas
News Impact on Trading1. Why News Matters in Trading
At its core, trading is about anticipating price movements. Prices are not just numbers; they represent the collective expectations of millions of traders and investors. News acts as an input that reshapes those expectations.
For example:
If a company reports profits far above expectations, its stock price often jumps.
If a central bank hints at raising interest rates, currency and bond markets move instantly.
If political instability occurs in an oil-rich region, crude oil prices tend to rise.
Markets are forward-looking, so news influences not just the current price, but also the future outlook. This is why traders closely monitor economic calendars, press releases, and real-time news feeds.
2. The Psychology of News Reactions
The impact of news is not just about information, but also about how traders interpret and emotionally react to it.
Fear and Greed
Good news fuels greed → buying pressure.
Bad news triggers fear → selling pressure.
Herd Mentality
When big headlines break, traders often follow the crowd. This creates sharp price spikes (both up and down), even if the long-term fundamentals don’t change much.
Overreaction
Markets frequently overreact to news in the short term. Prices may rise or fall more than justified, creating opportunities for contrarian traders.
Confirmation Bias
Traders often interpret news in line with their existing positions. For example, a bullish trader may downplay negative news, while a bearish trader may exaggerate its significance.
3. Types of News That Impact Trading
Not all news is equal. Some headlines barely move markets, while others cause extreme volatility. Broadly, news can be classified into economic, corporate, political, and unexpected events.
3.1 Economic News
Economic indicators are among the most predictable yet impactful types of news.
Interest Rate Decisions (Central Banks):
When the Federal Reserve, ECB, RBI, or other central banks raise or cut rates, currencies and stocks react immediately.
Inflation Data (CPI, PPI):
High inflation often leads to tighter monetary policy → negative for stocks but positive for safe-haven assets.
Employment Reports (NFP in the US):
Strong job growth = economic strength, but too strong may signal future rate hikes.
GDP Growth Rates:
A growing economy supports equity markets; a slowdown can hurt investor sentiment.
3.2 Corporate News
Company-specific news has a direct impact on stock prices.
Earnings Announcements: Positive earnings surprises can drive rallies, while misses can cause sell-offs.
Mergers & Acquisitions: Acquisition news often boosts the target company’s stock, but the acquiring company may fall due to high costs.
Product Launches & Innovations: Tech companies often see big moves around new product releases.
Management Changes & Scandals: Leadership shifts or controversies can shake investor confidence.
3.3 Political & Geopolitical News
Elections: Market sentiment often shifts based on which party is expected to win.
Trade Wars & Tariffs: These directly affect international companies and commodity prices.
Wars or Terrorist Attacks: They trigger safe-haven buying (gold, USD, bonds) and hurt risky assets (stocks, emerging market currencies).
3.4 Natural Disasters & Unexpected Events
Pandemics (COVID-19): Triggered global market crashes in 2020.
Earthquakes, Floods, Hurricanes: Affect commodity supply chains and insurance stocks.
Cyberattacks: Impact technology and financial institutions.
3.5 Social Media & Rumors
In the digital era, tweets and online rumors also impact markets. A single tweet from Elon Musk has moved Bitcoin, Dogecoin, and Tesla’s stock price multiple times.
4. Short-Term vs Long-Term Impact
Not all news has the same duration of impact.
Short-term: Intraday volatility due to data releases (like NFP or CPI).
Medium-term: Quarterly earnings guiding the next few months.
Long-term: Geopolitical shifts, policy reforms, or technological breakthroughs.
For example, the 2008 Financial Crisis was triggered by news about subprime mortgages, but its impact lasted years. In contrast, a one-time oil inventory report may only affect crude prices for a few hours or days.
5. Market Reactions to News
5.1 Anticipation and Expectation
Often, markets price in news before it happens. For example, if traders expect a central bank to raise rates, bond yields may rise before the official announcement.
5.2 “Buy the Rumor, Sell the News”
This phenomenon describes when prices rise in anticipation of good news but fall once the news is confirmed, as traders take profits.
5.3 Volatility Spikes
During major announcements, bid-ask spreads widen, liquidity dries up, and prices can swing wildly. Day traders thrive on such volatility, while long-term investors often prefer to stay on the sidelines.
6. Case Studies of News Impact
6.1 Brexit Referendum (2016)
When the UK voted to leave the EU, the British pound crashed nearly 10% overnight — one of the biggest moves in currency history. Stocks also plunged, showing how political news reshapes global markets.
6.2 COVID-19 Pandemic (2020)
The outbreak triggered global stock market crashes, oil prices went negative for the first time, and gold surged as a safe-haven asset. This highlighted how health news can ripple across every asset class.
6.3 Elon Musk & Bitcoin
A single tweet from Musk in 2021 stating Tesla would accept Bitcoin payments pushed BTC above $60,000. Later, when he tweeted about environmental concerns, BTC dropped sharply.
6.4 US Inflation Data (2022–2023)
High US inflation numbers forced the Fed into aggressive rate hikes, causing stocks to drop while the dollar surged globally.
7. Strategies for Trading the News
Traders use several approaches to deal with news-driven markets.
7.1 News Trading (Direct Approach)
Traders enter positions immediately after a news release. Example: buying a stock right after strong earnings. Risk: prices may reverse quickly.
7.2 Event-Driven Trading
Focusing on predictable news events like Fed meetings, company earnings, or OPEC announcements. Traders prepare positions in advance based on expectations.
7.3 Sentiment Analysis
Using AI tools, Twitter feeds, or market surveys to gauge public sentiment before or after news breaks.
7.4 Hedging with Options
Options strategies (straddles, strangles) help traders profit from volatility, regardless of direction, during news events.
7.5 Avoiding the Noise
Some traders prefer to avoid trading during news events because volatility can lead to unpredictable outcomes.
8. Risks of News-Based Trading
While news creates opportunities, it also comes with risks.
Whipsaw Movements: Initial market reaction may reverse quickly.
Fake News & Rumors: Can cause false breakouts.
Information Lag: Retail traders often receive news later than institutions.
Emotional Trading: News can trigger panic buying/selling, leading to losses.
High Transaction Costs: Wide spreads during volatile moments increase costs.
9. Tools for News Trading
To trade effectively around news, traders use specialized tools:
Economic Calendars (Forex Factory, Investing.com): Show upcoming events.
Real-Time News Feeds (Bloomberg, Reuters, Dow Jones): Provide instant updates.
Social Media Trackers: Monitor sentiment shifts on Twitter, Reddit, etc.
Volatility Index (VIX): Measures expected market volatility.
Squawk Services: Audio streams of breaking news for traders.
10. News Impact Across Asset Classes
10.1 Equities
Corporate earnings, government policies, and sector-specific news drive stock prices.
10.2 Forex
Currencies react to macroeconomic data (interest rates, GDP, inflation). For example, USD strengthens on higher rates.
10.3 Commodities
Oil reacts to OPEC announcements and geopolitical news. Gold rises during crises as a safe haven.
10.4 Bonds
Highly sensitive to inflation data and central bank decisions.
10.5 Cryptocurrencies
Extremely reactive to regulatory news, tweets, and adoption announcements.
Conclusion
News is the heartbeat of financial markets. It acts as a powerful driver of price movement by influencing trader psychology, reshaping expectations, and altering fundamentals. From corporate earnings to geopolitical conflicts, news events create volatility that can be both a risk and an opportunity.
Successful traders are not just chart readers or data crunchers — they are also keen observers of global events. By understanding how news impacts markets, managing risks, and using the right strategies, traders can turn volatility into profit instead of panic.
In short, while news trading is challenging, it remains one of the most exciting and rewarding aspects of financial markets.
Part 2 Candlestick PatternBasics of Options Contracts
To truly understand options, let’s break down the core components.
What is an Option?
An option is a contract that gives the buyer the right, but not the obligation, to buy or sell an underlying asset at a predetermined price (strike price) on or before a specified date (expiry date).
The buyer of the option pays a price called the premium.
The seller (or writer) of the option receives this premium and takes on the obligation.
Types of Options
Call Option – Gives the buyer the right to buy the underlying asset at the strike price.
Example: You buy a call on Reliance at ₹2500 strike price. If Reliance moves to ₹2700 before expiry, you can buy at ₹2500 and profit.
Put Option – Gives the buyer the right to sell the underlying asset at the strike price.
Example: You buy a put on Infosys at ₹1500. If Infosys falls to ₹1400, you can sell at ₹1500 and profit.
Key Terms in Options
Strike Price: The price at which the option can be exercised.
Premium: The cost of the option (paid by buyer, received by seller).
Expiry Date: The date when the option contract ends.
Lot Size: Options are traded in lots, not single units. For example, one NIFTY option lot = 50 units.
Moneyness:
In the Money (ITM): Option has intrinsic value.
At the Money (ATM): Strike price = current price.
Out of the Money (OTM): Option has no intrinsic value.
American vs European Options
American Options: Can be exercised any time before expiry.
European Options: Can be exercised only on expiry.
(India primarily uses European-style options.)

Risk Management & Position Sizing1. Introduction
Trading and investing are not just about finding opportunities; they are about surviving long enough to capitalize on those opportunities. Many traders focus solely on strategies, indicators, or news but fail to recognize that risk management and position sizing are the backbone of long-term success.
It doesn’t matter if you have the best strategy in the world—without proper risk control, even a few bad trades can wipe out your account. On the other hand, a mediocre strategy with strict risk management can still keep you profitable over time.
Risk management is about protecting capital, while position sizing is about optimizing growth while keeping risks tolerable. Together, they determine not just whether you survive in the markets but whether you thrive.
2. Understanding Risk in Trading
Before diving into methods, let’s define risk:
Risk is the probability of losing part or all of your investment due to adverse price movements or unforeseen events.
Types of Risk
Market Risk – Prices move against you due to volatility, trends, or sudden news.
Credit Risk – Counterparty default risk (important in derivatives, bonds, and broker dealings).
Liquidity Risk – Inability to exit a position at desired prices due to thin volume.
Operational Risk – Failures in trading platforms, execution errors, or broker malfunctions.
Psychological Risk – Emotional decisions driven by fear, greed, or impatience.
Why Risk Management is Vital
Preserves trading capital to stay in the game.
Reduces emotional stress and impulsive decisions.
Helps achieve consistency in returns.
Shields from black swan events like 2008 crisis or COVID-19 crash.
3. Core Principles of Risk Management
3.1 Preservation of Capital
Your first goal isn’t to make money—it’s to avoid losing money unnecessarily. Even legendary traders say: “Take care of the downside, the upside will take care of itself.”
3.2 Risk vs. Reward
Every trade has a risk/reward ratio. If you risk ₹1,000 and aim to make ₹3,000, your ratio is 1:3. Good traders avoid trades with poor ratios like 2:1 risk/reward in their favor.
3.3 Probability & Expectancy
Trading is a game of probabilities.
Win rate × average win – (loss rate × average loss) = expectancy.
Positive expectancy ensures long-term profitability.
3.4 Diversification
Don’t put all eggs in one basket. Spread risk across assets, sectors, and strategies to reduce portfolio volatility.
4. Position Sizing Explained
What is Position Sizing?
Position sizing is deciding how much capital to allocate to a trade. Too small, and profits don’t matter; too large, and losses can be fatal.
Fixed Lot vs. Variable Lot
Fixed lot: Always trade the same number of shares/contracts.
Variable lot: Adjust size based on risk percentage, volatility, or account growth.
Position Sizing Models
Fixed Dollar Model – Risking a fixed cash amount (e.g., ₹10,000 per trade).
Fixed Percentage Risk Model – Risking 1–2% of account per trade (most popular).
Volatility-Based Model – Larger positions in stable assets, smaller in volatile ones.
Kelly Criterion – Mathematical formula to maximize growth while avoiding ruin.
5. Techniques of Risk Management in Practice
5.1 Stop-Loss Strategies
A stop-loss is a pre-set exit to limit losses.
Percentage Stop: Exit if loss exceeds 2% of capital.
Volatility Stop: Use ATR (Average True Range) to set dynamic stops.
Chart Stop: Place below support or above resistance.
5.2 Trailing Stops
Move stop-loss as trade moves in your favor—locking in profits while letting winners run.
5.3 Hedging
Use derivatives (options/futures) to protect against downside risk. Example: Buy a put to protect long equity.
5.4 Risk/Reward Ratios
Always look for trades where potential reward is at least 2–3x the risk.
6. The Psychology of Risk Management
Fear: Causes premature exits.
Greed: Leads to oversized positions.
Overconfidence: Makes traders ignore risk rules.
Impatience: Pushes traders into random trades.
Discipline, emotional control, and sticking to rules are as important as technical skills.
7. Position Sizing Strategies in Detail
Stocks
Use 2% rule: Never risk more than 2% of capital on a single stock.
Diversify across industries.
Forex
Calculate pip value and lot size using risk per trade.
Adjust for leverage; avoid risking more than 1%–2% of account per trade.
Futures & Options
Higher leverage = higher risk.
Use margin calculations and hedge positions with spreads.
Crypto
Extremely volatile.
Use smaller positions and wider stops.
Only risk what you can afford to lose.
8. Risk Management in Different Trading Styles
Day Trading
Use tight stops and small risk (0.5%–1%).
Trade frequently but with discipline.
Swing Trading
Moderate position sizes.
Wider stops, risk around 1%–2% per trade.
Position Trading
Long-term view, smaller number of trades.
Can risk slightly higher (up to 3%) but diversify more.
Scalping
Extremely small risks (0.1%–0.5%).
High frequency requires strict discipline.
9. Common Mistakes in Risk Management
Risking too much capital in one trade.
Ignoring correlation (e.g., buying multiple tech stocks all exposed to same risk).
Over-leveraging.
Moving stop-loss further away instead of accepting loss.
Trading without a written plan.
10. Building a Personal Risk Management Plan
Define Risk Tolerance – How much are you comfortable losing?
Capital Allocation Rules – Max % per trade, per sector, per asset.
Position Sizing Method – Choose fixed % or volatility-based.
Stop-Loss & Exit Rules – Define before entering trade.
Review & Journal – Track results and refine rules.
Conclusion
Risk management and position sizing are not optional—they are mandatory survival tools. While strategies and market analysis help find opportunities, only proper risk control ensures long-term consistency and growth.
The most successful traders are not the ones with the highest returns, but those who stay in the market longest with steady risk-adjusted growth.
Remember:
Preserve capital first.
Risk small, grow steady.
Size positions wisely.
That’s the ultimate formula for success in trading.
ICICI Bank at a Crucial Support Zone: Can Bulls Take Charge?ICICI Bank (₹1,402) is holding firm above the ₹1,380–1,400 support zone, a level that has sparked rebounds multiple times in the past.
✅ RSI back at 51 → momentum improving
✅ MACD showing bullish divergence → early reversal signal
⚡ Key hurdle: falling trendline resistance at ₹1,416
📈 Bullish setup: Sustaining above ₹1,400 and breaking ₹1,416 could fuel a rally toward ₹1,439–1,452.
Disclaimer: The information provided in this analysis is for educational and informational purposes only and should not be considered as financial or investment advice.

Part 2 Ride The Big MovesWhat Are Options?
The Definition
An option is a financial contract that gives you the right, but not the obligation, to buy or sell an underlying asset (like a stock, index, or commodity) at a specific price within a specific time.
There are two main types of options:
Call Option – Gives the right to buy the asset at a fixed price (called the strike price).
Put Option – Gives the right to sell the asset at a fixed price.
Think of options like insurance policies. Just as you pay a premium for car insurance to protect against accidents, in options trading you pay a premium to gain control over an asset’s future without actually owning it upfront.
A Simple Example
Imagine you want to buy 100 shares of Reliance Industries at ₹2,500 per share, but you don’t want to spend ₹2,50,000 immediately. Instead, you buy a call option for ₹100 per share with a strike price of ₹2,500, expiring in one month.
If Reliance rises to ₹2,700, you can exercise your option and buy at ₹2,500, instantly profiting ₹200 per share (minus the premium).
If Reliance falls to ₹2,300, you don’t exercise. You only lose the premium you paid (₹100 per share).
This flexibility is the power of options.

Crypto Trading StrategiesChapter 1: Basics of Crypto Trading
1.1 What is Crypto Trading?
Crypto trading is the buying and selling of digital currencies like Bitcoin, Ethereum, or Solana with the goal of making profits. Trades can be short-term (minutes, hours, or days) or long-term (months or years).
1.2 Why Do People Trade Crypto?
High volatility = high profit potential
24/7 market availability
Variety of assets (over 25,000 coins/tokens)
No central authority (decentralization)
1.3 Types of Crypto Trading
Spot Trading: Buying and selling crypto for immediate delivery.
Futures & Derivatives: Speculating on price without holding the asset.
Margin Trading: Borrowing funds to trade larger positions.
Automated Trading (Bots/AI): Using algorithms to execute trades.
Chapter 2: Foundations of a Good Trading Strategy
2.1 Key Elements
Market Analysis (technical + fundamental)
Risk Management (stop-loss, position sizing)
Trading Psychology (discipline, patience)
Adaptability (adjusting strategies to market conditions)
2.2 Technical Tools
Candlestick patterns
Moving averages (MA, EMA)
RSI, MACD, Bollinger Bands
Volume profile and market structure
2.3 Risk Control
Never risk more than 1–2% of capital per trade.
Always set stop-loss orders.
Diversify across assets.
Chapter 3: Popular Crypto Trading Strategies
3.1 HODLing (Long-Term Holding)
Concept: Buy and hold crypto for years regardless of short-term fluctuations.
Best for: Investors who believe in long-term blockchain growth.
Pros: Easy, stress-free, low trading fees.
Cons: Vulnerable to market crashes.
3.2 Day Trading
Concept: Opening and closing positions within a day.
Tools Used: Technical analysis, chart patterns, high liquidity coins.
Pros: Daily income potential.
Cons: Stressful, requires screen time, risky.
3.3 Swing Trading
Concept: Capturing medium-term price swings (days to weeks).
Example: Buying Bitcoin after a pullback and selling after a breakout.
Pros: Less stressful than day trading.
Cons: Requires patience, overnight risks.
3.4 Scalping
Concept: Making dozens or hundreds of trades daily for small profits.
Tools: Bots, high liquidity exchanges, technical indicators.
Pros: Can accumulate profits quickly.
Cons: High fees, mentally exhausting.
3.5 Trend Following
Concept: "The trend is your friend." Trade in the direction of momentum.
Indicators: Moving averages, MACD, Ichimoku Cloud.
Pros: Effective in trending markets.
Cons: Doesn’t work well in sideways (range-bound) markets.
3.6 Breakout Trading
Concept: Entering trades when price breaks a key support/resistance level.
Example: Buying Bitcoin when it breaks $30,000 resistance.
Pros: Can catch big moves early.
Cons: False breakouts are common.
3.7 Arbitrage
Concept: Exploiting price differences between exchanges.
Types:
Exchange Arbitrage (Binance vs Coinbase)
Triangular Arbitrage (using three pairs)
Pros: Low risk if executed fast.
Cons: Requires speed, high capital.
3.8 Copy Trading / Social Trading
Concept: Following trades of professional traders via platforms.
Pros: Easy for beginners.
Cons: Risk if trader performs badly.
3.9 Algorithmic & Bot Trading
Concept: Automated execution using pre-set rules.
Pros: No emotions, works 24/7.
Cons: Needs technical knowledge, market risk.
3.10 News-Based Trading
Concept: Trading based on major announcements (ETF approvals, regulations, partnerships).
Pros: Can profit from volatility.
Cons: Markets react unpredictably.
Chapter 4: Advanced Crypto Trading Strategies
4.1 Using Leverage
Borrowed funds to trade bigger positions.
Example: 10x leverage means 1% move = 10% profit/loss.
Warning: Extremely risky, beginners should avoid.
4.2 Hedging
Using futures/options to protect long-term holdings.
Example: Holding Bitcoin but shorting futures to protect downside.
4.3 Dollar-Cost Averaging (DCA)
Investing small amounts regularly over time.
Pros: Reduces impact of volatility.
Cons: Slower gains in bull markets.
4.4 Yield Farming & Staking
Earning passive income by locking tokens.
Pros: Steady income.
Cons: Smart contract risks, token devaluation.
Chapter 5: Trading Psychology & Risk Management
5.1 Emotions in Trading
Fear & greed drive most mistakes.
Overtrading, revenge trading, panic selling = account killers.
5.2 Building Discipline
Have a written trading plan.
Stick to stop-loss and take-profit levels.
Avoid FOMO (fear of missing out).
5.3 Risk-Reward Ratio
Aim for at least 1:2 risk-reward ratio (risk $100 to make $200).
Chapter 6: Practical Tips for Crypto Traders
Trade only with money you can afford to lose.
Keep records of trades (trading journal).
Use reliable exchanges with strong security.
Learn continuously—crypto evolves fast.
Diversify between Bitcoin, altcoins, and stablecoins.
Conclusion
Crypto trading offers incredible opportunities—but also extreme risks. Without a strategy, traders often fall prey to volatility, scams, or emotions. By learning and applying structured crypto trading strategies like HODLing, day trading, swing trading, scalping, and advanced techniques like arbitrage or hedging, traders can approach the market with confidence.
Success in crypto doesn’t come overnight. It’s built through education, discipline, and consistent execution. The right strategy—combined with risk management and emotional control—can turn crypto from a gamble into a rewarding investment journey.

Part 9 Trading Master Class With ExpertsOption Greeks in Depth
To truly master options, one must understand the Greeks. These mathematical tools describe how options react to different market factors.
Delta (Δ) – Price Sensitivity
Measures how much an option price changes if stock moves ₹1.
Call options: Delta between 0 and +1.
Put options: Delta between 0 and -1.
Example: If a call has delta = 0.5, and stock rises ₹10, option rises ₹5.
Gamma (Γ) – Acceleration of Delta
Delta itself changes as stock moves. Gamma measures this.
High gamma = higher sensitivity, riskier.
Near expiry, gamma becomes extreme.
Theta (Θ) – Time Decay
Options lose value as time passes (all else equal).
Theta tells how much an option loses daily.
Example: If theta = -5, option loses ₹5/day.
Sellers love theta (they earn decay). Buyers fear it.
Vega (ν) – Volatility Sensitivity
Measures how option reacts to 1% change in volatility.
High volatility = high premium.
Example: If Vega = 10, and implied volatility rises 1%, option price rises ₹10.
Rho (ρ) – Interest Rate Sensitivity
Measures impact of interest rate changes.
Less important in short-term trading.
📌 Takeaway: Greeks are like the dashboard of a car. Without them, you’re driving blind.

Trading Master Class With ExpertsBeginner-Friendly Option Trading Strategies
Let us now study some beginner-friendly option trading strategies in detail.
Covered Call Strategy
Best for: Investors who already own shares.
Market Outlook: Neutral to slightly bullish.
How it works:
Buy or hold 100 shares of a company.
Sell (write) a call option on the same stock.
Example:
You own Infosys shares bought at ₹1600.
You sell a call option at strike ₹1700 for ₹30 premium.
Outcomes:
If Infosys stays below ₹1700, you keep the ₹30 premium (profit).
If Infosys rises above ₹1700, you must sell shares at ₹1700. You still make profit because your cost was ₹1600.
Pros:
Generates steady income.
Low risk.
Cons:
Your profit is capped if stock rises sharply.
Educational takeaway: A covered call is like earning rent on a property you own.
Protective Put Strategy
Best for: Investors who want insurance for their portfolio.
Market Outlook: Bullish, but with fear of downside risk.
How it works:
Buy shares of a company.
Buy a put option for protection.
Example:
You buy TCS shares at ₹3600.
You purchase a put option with strike ₹3500 for ₹50.
If TCS falls to ₹3300, your shares lose ₹300. But your put option gains value, limiting your losses.
Pros:
Acts like insurance.
Protects against big losses.
Cons:
Premium cost reduces net return.
Educational takeaway: A protective put is like buying health insurance—you hope not to use it, but it provides safety.

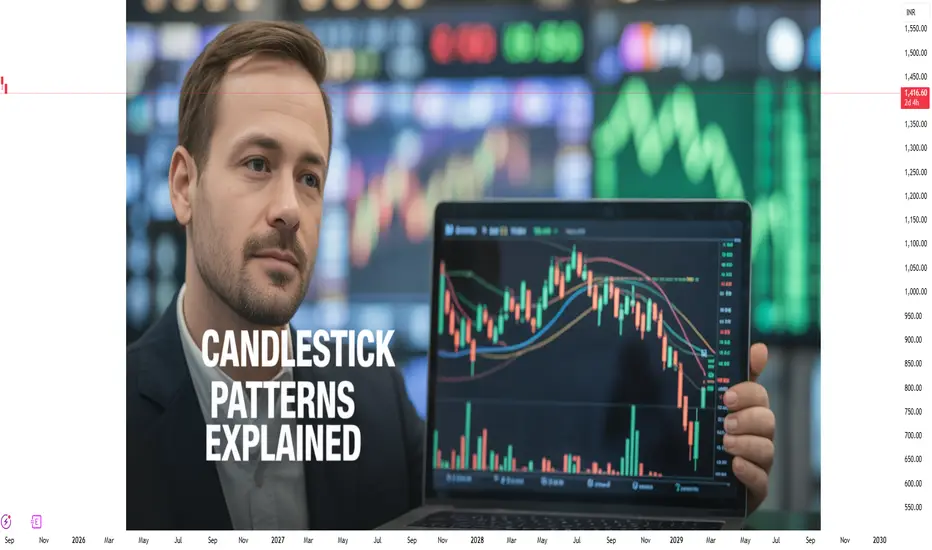
Candlestick Patterns Explained1. Introduction to Candlestick Patterns
1.1 What is a Candlestick?
A candlestick is a type of chart used to represent the price movement of an asset over a specific time period. Unlike traditional line charts that show only closing prices, candlestick charts display four crucial pieces of information:
Open price (O): The price at which the asset starts trading during the time frame.
Close price (C): The price at which the asset finishes trading.
High price (H): The highest price reached during the time frame.
Low price (L): The lowest price reached during the time frame.
Each candlestick consists of:
Body: The rectangular area between the open and close prices. A filled body (often red or black) represents a close lower than the open (bearish), while an empty or green body represents a close higher than the open (bullish).
Wicks/Shadows: The thin lines extending from the body, representing the high and low prices.
1.2 Why Candlestick Patterns Matter
Candlestick patterns reflect the psychology of the market. They show whether buyers or sellers are in control and help traders anticipate potential price movements. Patterns can indicate:
Trend continuation: The market is likely to keep moving in the same direction.
Trend reversal: The market may change direction soon.
Indecision: Neither buyers nor sellers have a clear advantage.
2. Types of Candlestick Patterns
Candlestick patterns are broadly categorized into two types:
Single-Candle Patterns: Formed by one candle, often signaling immediate market sentiment.
Multiple-Candle Patterns: Formed by two or more candles, providing stronger confirmation of trend direction or reversals.
3. Single-Candle Patterns
3.1 Doji
A Doji occurs when the open and close prices are almost equal, forming a very small body with long wicks. It signals market indecision and potential reversal.
Types of Doji:
Standard Doji: Open ≈ Close, wicks vary.
Long-Legged Doji: Long upper and lower shadows; extreme indecision.
Dragonfly Doji: Long lower shadow, little or no upper shadow; potential bullish reversal.
Gravestone Doji: Long upper shadow, little or no lower shadow; potential bearish reversal.
Example: After a strong uptrend, a Gravestone Doji may indicate the buyers are losing momentum.
3.2 Hammer and Hanging Man
Both have small bodies and long lower shadows, but their implications differ based on trend:
Hammer (Bullish Reversal): Appears after a downtrend. Shows that sellers pushed the price down, but buyers regained control.
Hanging Man (Bearish Reversal): Appears after an uptrend. Indicates sellers testing the market and potential reversal.
Tip: Always confirm with the next candle or technical indicators.
3.3 Shooting Star and Inverted Hammer
These are the opposite of Hammer and Hanging Man:
Shooting Star (Bearish Reversal): Appears after an uptrend, small body with long upper shadow. Indicates buyers tried to push prices up but failed.
Inverted Hammer (Bullish Reversal): Appears after a downtrend, small body with long upper shadow. Suggests buyers may be gaining control.
3.4 Spinning Top
A small body with long shadows on both sides. Reflects market indecision and weak trend momentum. Spinning tops often precede trend reversals if confirmed by the next candle.
4. Multiple-Candle Patterns
4.1 Engulfing Patterns
Engulfing patterns occur when one candle completely engulfs the previous candle's body, signaling strong momentum.
Bullish Engulfing: Appears after a downtrend. A large green candle engulfs a small red candle. Indicates buyers taking control.
Bearish Engulfing: Appears after an uptrend. A large red candle engulfs a small green candle. Indicates sellers gaining strength.
4.2 Harami Patterns
A Harami consists of a large candle followed by a smaller candle within the body of the first. It signals trend reversal or indecision.
Bullish Harami: Appears after a downtrend, small green candle within large red candle. Suggests buyers are entering.
Bearish Harami: Appears after an uptrend, small red candle within large green candle. Suggests selling pressure.
4.3 Tweezer Tops and Bottoms
Tweezer patterns are formed when two candles have equal highs or lows:
Tweezer Top (Bearish): Appears after an uptrend, equal highs indicate resistance.
Tweezer Bottom (Bullish): Appears after a downtrend, equal lows indicate support.
4.4 Morning Star and Evening Star
Three-candle reversal patterns:
Morning Star (Bullish Reversal): Downtrend → small-bodied candle → strong bullish candle. Indicates trend reversal upward.
Evening Star (Bearish Reversal): Uptrend → small-bodied candle → strong bearish candle. Indicates trend reversal downward.
4.5 Three White Soldiers and Three Black Crows
Strong trend continuation patterns:
Three White Soldiers (Bullish): Three consecutive green candles with higher closes, following a downtrend. Strong bullish signal.
Three Black Crows (Bearish): Three consecutive red candles with lower closes, following an uptrend. Strong bearish signal.
5. Candlestick Patterns in Trend Analysis
Candlestick patterns are more effective when combined with trend analysis:
Uptrend: Look for bullish patterns (Hammer, Bullish Engulfing, Morning Star).
Downtrend: Look for bearish patterns (Shooting Star, Bearish Engulfing, Evening Star).
Sideways Market: Look for indecision patterns (Doji, Spinning Top).
Tip: Patterns are not guarantees; they indicate probabilities. Always confirm with volume, support/resistance, or technical indicators like RSI, MACD, or moving averages.
6. Practical Trading Tips Using Candlestick Patterns
Confirm Patterns: Never trade based solely on one candlestick. Wait for confirmation from the next candle or trend indicators.
Combine with Support & Resistance: Candlestick patterns near key levels are more reliable.
Volume Matters: Patterns accompanied by high volume indicate stronger conviction.
Risk Management: Set stop-losses slightly beyond the wick extremes to protect against false signals.
Time Frames: Patterns work across all timeframes, but longer timeframes (daily/weekly) generally provide more reliable signals.
7. Common Mistakes Traders Make
Ignoring trend context: Trading reversal patterns against strong trends can lead to losses.
Over-relying on a single candle: Patterns should be confirmed with other indicators.
Misinterpreting Dojis or Spinning Tops: Context and location in the trend are critical.
Neglecting risk management: Even the strongest patterns can fail.
8. Summary
Candlestick patterns are a powerful tool for traders when used correctly. They visually depict market psychology and help forecast potential price movements. Key takeaways:
Single-Candle Patterns indicate immediate sentiment (Hammer, Doji, Shooting Star).
Multiple-Candle Patterns provide stronger signals (Engulfing, Morning Star, Three Soldiers).
Trend Confirmation increases reliability.
Support, Resistance, Volume, and Indicators enhance accuracy.
With practice, traders can read market sentiment quickly and make more informed decisions. Candlestick analysis is not a standalone solution but a vital part of a comprehensive trading strategy.
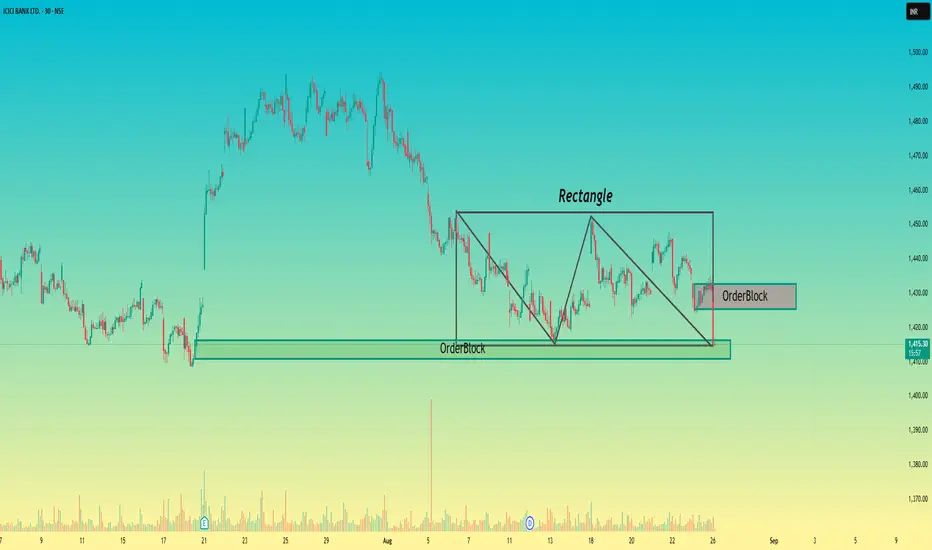
ICICI Bank: Key Battle Between Bulls and Bears Inside Rectangle📊 ICICI Bank (30-min chart) – Rectangle + Order Blocks
🔹 Major Demand Zone (Bullish Order Block)
Strong demand around ₹1,410–₹1,415 has been respected multiple times.
This zone continues to act as a base for buyers.
🔹 Rectangle Consolidation
Price is trapped in a rectangle range of ₹1,415–₹1,450.
Consolidation shows indecision before a breakout.
🔹 Bearish Order Block at ₹1,425
A bearish order block has formed near ₹1,425, creating selling pressure on pullbacks.
This zone is currently acting as a short-term resistance.
📌 Trading Plan
As long as price stays below ₹1,425, sellers may keep control.
Breakdown below ₹1,410 can extend downside toward ₹1,390–₹1,380.
On the other hand, a clean breakout above ₹1,435 will invalidate the bearish OB and flip structure bullish.
Above ₹1,435, targets open toward ₹1,450 → ₹1,470 → ₹1,490.
⚖️ Risk-Reward Setup
Bearish bias: Short entries near ₹1,425–₹1,430 with SL above ₹1,435.
Bullish bias: Long trades only above ₹1,435, targeting ₹1,450–₹1,490.
📍 Conclusion: ICICI Bank is consolidating in a rectangle. Key levels to watch are ₹1,410 support and ₹1,425 resistance. A breakdown below ₹1,410 favors sellers, while a breakout above ₹1,435 turns the trend bullish.
Option Trading 1. Introduction to Options Trading
Options trading is one of the most powerful tools in the financial markets. Unlike traditional stock trading, where you buy or sell shares directly, options allow you to control an asset without owning it outright. This gives traders flexibility, leverage, and a wide range of strategies for both profits and risk management.
At its core, an option is a contract that gives the buyer the right, but not the obligation, to buy or sell an underlying asset at a specific price (called the strike price) on or before a certain date (the expiration date).
The beauty of options lies in choice: you can profit whether markets are rising, falling, or even staying flat—if you know how to use them.
2. What is an Option?
An option is a derivative instrument, meaning its value is derived from the price of another asset (the “underlying”), such as:
Stocks (e.g., Reliance, Apple)
Indexes (e.g., Nifty, S&P 500)
Commodities (e.g., Gold, Oil)
Currencies
Two Main Types of Options:
Call Option – Gives the right to buy the underlying asset.
Put Option – Gives the right to sell the underlying asset.
Example:
A call option on Reliance with a strike price of ₹2500 expiring in one month gives you the right (not the obligation) to buy Reliance shares at ₹2500, regardless of the market price.
A put option with a strike of ₹2500 gives you the right to sell at ₹2500.

Icici trade ideaICICI 1436 is in 2nd leg. It shows sign of reversal to 1418 with resistance 1447,1459.
At 1418 is it is expected to reverse to 4th leg target 1481.

Part 4 Institutional Trading Types of Option Strategies
Here’s the heart of the discussion: strategies.
Single-Leg Strategies (Simple & Beginner-Friendly)
a) Long Call (Buying a Call)
View: Bullish
Risk: Limited to premium paid
Reward: Unlimited (theoretically)
Example: Buy Reliance 2800 CE @ ₹50 → If Reliance goes to 2900, profit = ₹50.
b) Long Put (Buying a Put)
View: Bearish
Risk: Limited to premium paid
Reward: Large downside profit potential
Example: Buy Nifty 22,000 PE → If Nifty falls, profit rises.
c) Covered Call
View: Neutral to mildly bullish
How it works: Hold stock + Sell a Call option
Goal: Earn income from option premium
Risk: Stock falls significantly.
d) Cash-Secured Put
View: Neutral to bullish
How it works: Sell a Put with enough cash to buy stock if assigned.
Goal: Collect premium or buy stock cheaper.

Part 2 Support And ResistanceWhy Options Exist?
Options exist to manage risk and to create trading opportunities. Think of them as financial insurance. Just like you pay a premium for car insurance to protect against damage, in options trading, investors pay a premium to protect themselves against adverse price moves.
For Hedgers: Options act as insurance. A stock investor can buy a put option to protect his portfolio if the market falls.
For Speculators: Options provide leverage. With small capital, traders can take large directional bets.
For Arbitrageurs: Options open opportunities to exploit price inefficiencies between the spot, futures, and options markets.
Key Terminologies in Option Trading
Before diving deep, let’s understand some essential terms:
Call Option: A contract that gives the buyer the right (but not the obligation) to buy an asset at the strike price before expiry.
Example: Buying a Reliance ₹2500 Call Option means you can buy Reliance shares at ₹2500 even if the market price rises to ₹2700.
Put Option: A contract that gives the buyer the right (but not the obligation) to sell an asset at the strike price before expiry.
Example: Buying a Nifty 19000 Put Option means you can sell Nifty at 19000 even if the market falls to 18500.
Premium: The price paid to buy the option contract.
Example: If a Nifty 20000 Call is trading at ₹150, that ₹150 is the premium.
Strike Price: The pre-decided price at which the option can be exercised.
Expiry Date: The last date on which the option contract is valid.
In-the-Money (ITM): Option that already has intrinsic value.
Example: Nifty at 20000 → 19500 Call is ITM.
Out-of-the-Money (OTM): Option that has no intrinsic value (only time value).
Example: Nifty at 20000 → 21000 Call is OTM.
At-the-Money (ATM): Option strike price is closest to current market price.
Lot Size: Options are traded in predefined lot sizes, not single shares.
Example: Bank Nifty option lot size = 15 units (as per 2025 rules).
Option Chain: A tabular representation showing available strikes, premiums, open interest, etc. for calls and puts.

Price Action Trading Strategies1. Introduction to Price Action Trading
In the world of trading, countless strategies exist—some rely heavily on indicators, some on algorithms, and others on fundamental data. But one timeless method stands apart: Price Action Trading.
At its core, price action trading is the art of making trading decisions solely based on the movement of price on the chart, without depending too much on lagging indicators like RSI, MACD, or moving averages. Instead, traders read the raw story of the market through candlestick structures, patterns, and levels.
Think of it as reading a book. Every candle tells a story:
Who is stronger—buyers or sellers?
Is the market trending or consolidating?
Is there a potential reversal or continuation?
This method has been used for decades by professional traders because price is the ultimate truth. Indicators may lag, news may be noisy, but price always reflects what’s happening in real time.
2. Core Principles of Price Action
Before diving into strategies, let’s build the foundation.
(a) Market Structure
Price moves in waves—higher highs & higher lows in an uptrend, lower highs & lower lows in a downtrend. Recognizing market structure helps you avoid trading against the dominant flow.
(b) Support and Resistance
These are the backbone of price action trading:
Support: A price level where demand is strong enough to stop a fall.
Resistance: A level where supply is strong enough to cap a rise.
Traders often mark these levels on daily, 4H, or 1H charts to identify potential entry zones.
(c) Supply and Demand Zones
Instead of flat lines, advanced traders look at zones (rectangular regions) where large buying/selling orders entered the market. Price often reacts strongly when revisiting these zones.
(d) Candlestick Psychology
Candlesticks show battle outcomes between bulls and bears. For example:
Long wick at bottom = buyers rejected lower prices.
Engulfing candle = strong reversal signal.
Understanding this psychology forms the essence of price action trading.
(e) Trendlines & Channels
Drawing trendlines helps in identifying trend continuation and potential breakout points. Price often respects channels before making strong moves.
3. Key Tools of Price Action
Unlike indicator-heavy traders, price action traders rely mainly on the chart itself. Key tools include:
Candlestick Patterns (Doji, Pin Bar, Engulfing, etc.)
Chart Patterns (Head & Shoulders, Double Top/Bottom, Triangles, Flags)
Breakouts & Retests
Volume Analysis (optional but powerful to confirm breakouts)
These tools are combined to form actionable strategies.
4. Popular Price Action Patterns
(a) Pin Bar (Rejection Candle)
Long wick + small body.
Signals rejection of a price level.
Example: A bullish pin bar at support indicates buyers defending the zone.
(b) Engulfing Pattern
A candle completely engulfs the previous one.
Bullish engulfing after a downtrend = reversal to upside.
Bearish engulfing after an uptrend = reversal to downside.
(c) Inside Bar
Small candle within the previous candle’s range.
Indicates indecision, often followed by strong breakout.
(d) Double Top & Double Bottom
Double Top: Price tests a resistance twice but fails → bearish reversal.
Double Bottom: Price tests support twice but fails → bullish reversal.
(e) Head and Shoulders
Classic reversal pattern indicating exhaustion of trend.
Head & Shoulders Top → bearish reversal.
Inverse Head & Shoulders → bullish reversal.
5. Price Action Trading Strategies
Now, let’s explore actionable strategies.
Strategy 1: Support & Resistance Bounce
Mark strong daily/weekly support and resistance.
Wait for price to test these levels.
Look for candlestick confirmation (pin bar, engulfing).
Trade in the direction of rejection.
👉 Example: Bank Nifty tests 45,000 support and forms bullish engulfing → buy with stop-loss below support.
Strategy 2: Breakout and Retest
Markets often consolidate before breaking out strongly.
Steps:
Identify a consolidation range.
Wait for breakout (above resistance / below support).
Don’t jump immediately—wait for retest of the broken level.
Enter trade in breakout direction.
👉 Example: Nifty breaks out of 20,000, comes back to retest 20,000 → strong buy.
Strategy 3: Trendline Trading
Draw a trendline connecting higher lows in an uptrend or lower highs in a downtrend.
Buy near trendline support in uptrend, sell near trendline resistance in downtrend.
Look for pin bars or engulfing candles as confirmation.
Strategy 4: Supply & Demand Zone Trading
Mark zones where strong rallies or falls originated.
Wait for price to revisit those zones.
Look for candlestick rejection.
Enter with stop-loss beyond zone.
👉 Example: Reliance stock rallies from ₹2,200 to ₹2,400. Mark demand zone at ₹2,200–₹2,220. When price revisits, buy again.
Strategy 5: Inside Bar Breakout
Find inside bar pattern (consolidation).
Place buy stop above high, sell stop below low.
Whichever breaks, enter trade.
Works best in trending markets.
Strategy 6: Fake Breakout (Stop Hunt Strategy)
Institutions often trigger stop-losses before moving price in real direction.
Spot false breakouts near key levels.
Enter in opposite direction after quick rejection.
👉 Example: Price breaks below support, instantly reverses with bullish engulfing → buy.
Strategy 7: Multi-Timeframe Price Action
Identify higher timeframe trend (daily/4H).
Drop to lower timeframe (15M/1H) for entry.
Align both trends for high probability setups.
Strategy 8: Range Trading
In sideways markets, mark horizontal support & resistance.
Buy near support, sell near resistance.
Exit at opposite boundary.
Strategy 9: Pullback Entry
In a trending market, avoid chasing moves.
Wait for pullback to support (uptrend) or resistance (downtrend).
Enter when trend resumes.
👉 Example: Nifty rallies, pulls back to 20EMA, forms bullish engulfing → buy continuation.
Strategy 10: Price Action with Volume
Combine volume with candlestick setups.
Breakout + high volume = strong move.
Pin bar rejection + high volume = reliable reversal.
6. Risk Management in Price Action Trading
No strategy works without proper risk control.
Always use stop-loss (below support for buys, above resistance for sells).
Risk only 1–2% of capital per trade.
Use risk-to-reward ratio (R:R) of at least 1:2.
Avoid overtrading—wait for high-quality setups.
7. Psychology in Price Action
Price action requires patience. Unlike indicator traders, price action traders must wait for price to tell its story.
Key psychological rules:
Don’t predict; react.
Avoid FOMO (fear of missing out).
Stick to your trading plan.
Journal every trade for review.
8. Advantages of Price Action Trading
Works across all markets (stocks, forex, commodities, crypto).
No dependency on lagging indicators.
Helps understand real market psychology.
Clean charts → better decision-making.
9. Limitations of Price Action
Subjective → two traders may draw different support/resistance.
Requires experience & screen time.
False signals in volatile markets.
Needs discipline to wait for confirmation.
10. Conclusion
Price action trading is a timeless and powerful method for understanding market movements. It doesn’t rely on fancy indicators but instead focuses on the raw truth: the price itself.
Whether you trade intraday, swing, or positional, mastering price action strategies—support/resistance, breakouts, pin bars, engulfing patterns, supply-demand zones—can give you an edge.
But remember: strategies alone don’t guarantee profits. Discipline, risk management, and patience are equally important. Price action is like learning a new language—the more you practice, the more fluent you become in reading the market’s story.
Part 3 Learn Institutional TradingCall Options & Put Options Explained
Options are of two types:
🔹 Call Option
Gives the right to buy an asset at a fixed price.
Buyers of call options are bullish (expect prices to rise).
👉 Example:
If Nifty is at 22,000 and you buy a 22,100 Call Option for ₹100 premium, you pay ₹100 × lot size (say 50) = ₹5,000.
If Nifty rises to 22,400, the 22,100 call is worth 300 points. Profit = (300 - 100) × 50 = ₹10,000.
If Nifty stays below 22,100, you lose only the premium ₹5,000.
🔹 Put Option
Gives the right to sell an asset at a fixed price.
Buyers of put options are bearish (expect prices to fall).
👉 Example:
If Bank Nifty is at 48,000 and you buy a 47,800 Put for ₹200 premium, lot size = 15.
If Bank Nifty falls to 47,000, option value = 800 points. Profit = (800 - 200) × 15 = ₹9,000.
If Bank Nifty stays above 47,800, you lose only premium = ₹3,000.
So:
Call = Bullish bet.
Put = Bearish bet.

Icici bank possible BATICICI 1430 is showing a possibility of BAT pattern formation with support 1417.
Resistance at 1456
Volume suggests panic selling

Part 7 Trading Master Class Calls & Puts with Real-Life Examples
Call Option Example
Suppose Reliance stock is trading at ₹2,500.
You buy a Call Option with strike price ₹2,600, paying a premium of ₹50.
If Reliance goes to ₹2,800, your profit = (2800 - 2600 - 50) = ₹150 per share.
If Reliance stays below 2600, you lose only the premium = ₹50.
A call option = bullish bet (you expect prices to rise).
Put Option Example
NIFTY is at 22,000.
You buy a Put Option strike 21,800, premium ₹80.
If NIFTY falls to 21,200 → Profit = (21800 - 21200 - 80) = ₹520 per lot.
If NIFTY rises above 21,800, you lose only ₹80.
A put option = bearish bet (you expect prices to fall).
Why Traders Use Options
Options are powerful because they allow:
Leverage – Control large value with small money (premium).
Example: Buying Reliance stock directly at ₹2,500 may cost ₹2.5 lakh (100 shares). But buying a call option may cost just ₹5,000.
Hedging – Protect portfolio from losses.
Example: If you hold Infosys shares, you can buy a put option to protect against downside.
Speculation – Bet on market direction with limited risk.
Income generation – Selling options (covered calls, cash-secured puts) generates steady income.

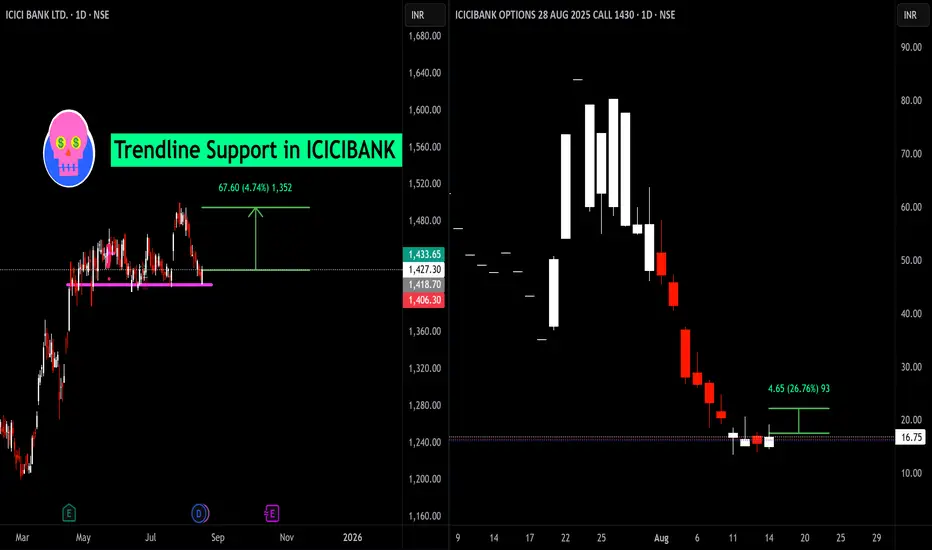
Trendline Support and Options Reaction in ICICI Bank📈 ICICI Bank at Major Support!
ICICI Bank is testing a crucial trendline support zone around ₹1,418–₹1,427 after a lengthy pullback. Historically, this level has held strong, showing multiple bounces — making it a key area for traders to watch.
Support Level: ₹1,418–₹1,427
Potential Upside: The chart highlights a recovery zone towards ₹1,433 and beyond, with a bounce of ₹67.6 (approx. 4.74%) possible if support holds firm.
🟢 Options Perspective: 1430 CE (August Expiry)
The ICICI Bank 1,430 August call option has shown significant volatility:
Current Premium: ₹16.75
Recent Change: +₹4.65 (+26.76%) on a single session!
Paer 3 Learn Institutional Trading Options Trading Strategies
Basic Strategies
Long Call → Buy call, bullish.
Long Put → Buy put, bearish.
Covered Call → Own stock + sell call for income.
Protective Put → Own stock + buy put for protection.
Intermediate Strategies
Straddle: Buy Call + Put at same strike (bet on volatility).
Strangle: Buy Call (higher strike) + Put (lower strike).
Bull Call Spread: Buy low strike call + sell higher strike call.
Bear Put Spread: Buy put + sell lower strike put.
Advanced Strategies
Iron Condor: Range-bound strategy selling OTM call + put spreads.
Butterfly Spread: Profit from low volatility near strike.
Ratio Spreads: Adjust risk/reward with multiple options.
Margin Requirements & Leverage
Option buyers: Pay only premium (small capital).
Option sellers (writers): Need large margin (higher risk).
NSE SPAN + Exposure margin system determines requirements.
For example, selling 1 lot of Bank Nifty option may require ₹1.5–2 lakh margin depending on volatility.

Part 2 Support And ResistanceHow Options Work in Trading
Imagine a stock is trading at ₹1,000.
You believe it will rise to ₹1,100 in a month. You could:
Buy the stock: You need ₹1,000 per share.
Buy a call option: You pay a small premium (say ₹50) for the right to buy at ₹1,000 later.
If the stock rises to ₹1,100:
Stock profit = ₹100
Call option profit = ₹100 (intrinsic value) - ₹50 (premium) = ₹50 net profit (but with much lower capital).
This leverage makes options attractive but also risky — if the stock doesn’t rise, your premium is lost.
Categories of Options Strategies
Options strategies can be divided into three main categories:
Directional Strategies – Profit from price movements.
Non-Directional (Neutral) Strategies – Profit from sideways markets.
Hedging Strategies – Protect existing positions.

Technical Indicators Mastery1. Introduction to Technical Indicators
In the world of financial trading, technical indicators are mathematical calculations based on historical price, volume, or open interest data. Traders use them to forecast future price movements, confirm trends, identify potential entry/exit points, and manage risk.
Technical indicators are not magic predictions—they are tools that help interpret market data and support informed decision-making. Their real value lies in:
Spotting trend direction (uptrend, downtrend, sideways)
Identifying momentum and overbought/oversold conditions
Measuring volatility for risk control
Detecting market volume shifts for confirmation
Timing entries and exits
There are hundreds of indicators, but most fall into five major categories:
Trend-following indicators (e.g., Moving Averages, MACD)
Momentum indicators (e.g., RSI, Stochastic)
Volatility indicators (e.g., Bollinger Bands, ATR)
Volume-based indicators (e.g., OBV, Volume Profile)
Market strength indicators (e.g., ADX, Aroon)
2. Understanding How Indicators Work
Every indicator is calculated using price data (open, high, low, close) and sometimes volume data. The formulas vary from simple averages to complex algorithms.
Example:
Simple Moving Average (SMA) = Sum of closing prices over n periods ÷ n
RSI = Measures the ratio of average gains to average losses over a period
They can be displayed:
Directly on the price chart (e.g., Moving Averages, Bollinger Bands)
In a separate indicator window below the chart (e.g., RSI, MACD histogram)
Key Rule: Indicators should be used in context—price action and market structure remain the foundation.
3. Trend-Following Indicators
Trend-following indicators help traders align with the market’s dominant direction rather than guessing tops and bottoms.
3.1 Moving Averages (MA)
SMA (Simple Moving Average): Smooths out price action for clearer trends.
EMA (Exponential Moving Average): Gives more weight to recent prices, reacts faster to changes.
Usage: Identify trend direction, dynamic support/resistance.
Example Strategy: Buy when price crosses above the 50 EMA, sell when it crosses below.
3.2 MACD (Moving Average Convergence Divergence)
Consists of MACD line, signal line, and histogram.
Signals:
MACD crossing above signal line = bullish
MACD crossing below signal line = bearish
Works well in trending markets but can give false signals in choppy conditions.
3.3 Parabolic SAR
Dots plotted above or below price.
Dots below price = uptrend, dots above price = downtrend.
Good for trailing stop-loss placement.
3.4 Supertrend
Combines ATR (volatility) and trend.
Turns green in bullish phase, red in bearish phase.
Often used in intraday trading for clarity.
4. Momentum Indicators
These measure the speed of price movement—helping traders catch the strongest trends and spot potential reversals.
4.1 RSI (Relative Strength Index)
Scale from 0 to 100.
Above 70 = overbought (possible reversal or pullback)
Below 30 = oversold (possible bounce)
Divergence between RSI and price can indicate trend exhaustion.
4.2 Stochastic Oscillator
Compares closing price to its price range over a set period.
%K and %D lines generate buy/sell signals via crossovers.
Effective in sideways markets for spotting turning points.
4.3 CCI (Commodity Channel Index)
Measures deviation from the average price.
Above +100 = strong bullish momentum.
Below -100 = strong bearish momentum.
4.4 Williams %R
Similar to Stochastic but inverted scale.
Ranges from 0 (overbought) to -100 (oversold).
5. Volatility Indicators
Volatility reflects market excitement or uncertainty. These indicators help with position sizing, stop placement, and detecting breakouts.
5.1 Bollinger Bands
Three lines: SMA (middle) and two bands at ± standard deviation.
Price hugging upper band = strong uptrend.
Bands squeezing together = low volatility (possible breakout).
5.2 ATR (Average True Range)
Measures average price range over a period.
Larger ATR = higher volatility.
Used to set stop-loss distances based on market conditions.
5.3 Keltner Channels
Similar to Bollinger Bands but use ATR for band width.
Better for trend-following strategies.
6. Volume-Based Indicators
Volume is the fuel of price movement—no fuel, no sustained move.
6.1 OBV (On-Balance Volume)
Cumulative volume measure that rises when price closes higher and falls when price closes lower.
Divergence from price can signal upcoming reversals.
6.2 Volume Profile
Shows volume traded at specific price levels, not time.
Helps identify high volume nodes (support/resistance) and low volume areas (potential breakout zones).
6.3 Chaikin Money Flow
Combines price and volume to measure buying/selling pressure.
7. Market Strength Indicators
These measure the underlying power of a trend.
7.1 ADX (Average Directional Index)
Scale from 0 to 100.
Above 25 = strong trend, below 20 = weak trend.
Doesn’t show direction—only strength.
7.2 Aroon Indicator
Aroon Up and Aroon Down measure time since highs/lows.
Crossovers indicate potential trend changes.
8. Combining Indicators for Better Accuracy
No single indicator is foolproof.
Traders often combine complementary indicators:
Trend + Momentum: 50 EMA + RSI
Trend + Volatility: MACD + Bollinger Bands
Volume + Price Action: Volume Profile + Price Structure
Golden Rule: Avoid indicator overload—stick to 2–3 well-chosen tools.
9. Common Mistakes with Indicators
Overfitting: Using too many indicators leading to analysis paralysis.
Lagging effect: Indicators often react after price has moved—accept this as part of trading.
Ignoring market context: Using RSI in strong trends can lead to false reversals.
No backtesting: Always test an indicator’s performance in your market/timeframe.
10. Practical Trading Strategies Using Indicators
10.1 Moving Average Crossover
Buy when 50 EMA crosses above 200 EMA (Golden Cross).
Sell when 50 EMA crosses below 200 EMA (Death Cross).
10.2 RSI Divergence
Price makes higher high, RSI makes lower high → bearish divergence.
Price makes lower low, RSI makes higher low → bullish divergence.
10.3 Bollinger Band Breakout
Wait for a squeeze → trade in direction of breakout.
Combine with volume for confirmation.
10.4 MACD Trend Following
Use MACD to ride trends, exit when histogram momentum fades.
Conclusion
Mastering technical indicators is about understanding their logic, selecting the right tools, and applying them with discipline.
Indicators don’t replace skill—they enhance it. The most successful traders combine:
Price action
Risk management
Market psychology
with carefully chosen indicators.
By practicing, backtesting, and refining, you turn indicators from mere lines on a chart into a precision decision-making toolkit.