Institutional Trading1. Introduction
Institutional trading refers to the buying and selling of financial securities by large organizations such as banks, pension funds, hedge funds, mutual funds, insurance companies, sovereign wealth funds, and proprietary trading firms. These institutions trade in massive volumes, often involving millions of dollars in a single transaction.
Unlike retail traders, who typically trade through standard brokerage accounts, institutions operate with advanced infrastructure, direct market access, complex strategies, and regulatory privileges that allow them to execute trades with greater efficiency and lower costs.
Institutional traders are not only participants in the market — they shape the market. Their trades can influence prices, liquidity, and even the broader economic sentiment. Understanding how institutional trading works is essential for any serious trader or investor because institutions often set the tone for market trends.
2. Who Are Institutional Traders?
Institutional traders are professionals managing money on behalf of large organizations. Let’s break down the major categories:
a) Hedge Funds
Trade aggressively for profit, often using leverage, derivatives, and high-frequency strategies.
Example: Bridgewater Associates, Citadel, Renaissance Technologies.
They might take both long and short positions, exploiting market inefficiencies.
b) Mutual Funds
Manage pooled investments from retail investors.
Aim for long-term growth, income, or a balanced approach.
Example: Vanguard, Fidelity.
c) Pension Funds
Manage retirement savings for employees.
Focus on stability, long-term returns, and risk management.
Example: CalPERS (California Public Employees' Retirement System).
d) Sovereign Wealth Funds
State-owned investment funds managing surplus reserves.
Example: Norway Government Pension Fund Global, Abu Dhabi Investment Authority.
e) Insurance Companies
Invest premium income in bonds, equities, and other assets.
Require safe, predictable returns to meet policyholder obligations.
f) Investment Banks & Prop Trading Firms
Conduct proprietary trading using their own capital.
Example: Goldman Sachs, JPMorgan Chase.
3. Characteristics of Institutional Trading
Large Trade Sizes
Orders can be worth millions or billions.
Executed in blocks to avoid market disruption.
Sophisticated Strategies
Algorithmic trading, statistical arbitrage, market-making, options strategies.
Access to Better Pricing
Due to volume and relationships with brokers, they get lower commissions and tighter spreads.
Regulatory Framework
Must comply with SEC, SEBI, FCA, or other market regulators.
Have compliance teams to ensure adherence to laws.
Direct Market Access (DMA)
Can place trades directly into exchange order books.
4. How Institutional Trades Differ from Retail Trades
Feature Retail Trading Institutional Trading
Trade Size Small (few thousand USD) Massive (millions to billions)
Execution Through brokers, often at market rates Direct access, negotiated prices
Tools Limited charting, basic platforms Advanced analytics, AI, proprietary systems
Speed Milliseconds to seconds Microseconds to milliseconds
Market Impact Minimal Can move prices significantly
5. How Institutional Orders Are Executed
Because large trades can move prices, institutions often split orders into smaller parts using strategies such as:
a) VWAP (Volume Weighted Average Price)
Executes trades in line with market volume to minimize price impact.
b) TWAP (Time Weighted Average Price)
Spreads execution over a fixed time period.
c) Iceberg Orders
Only a fraction of the total order is visible to the market at any given time.
d) Algorithmic Trading
Automated execution using complex algorithms.
e) Dark Pools
Private exchanges where large orders can be matched without revealing them publicly.
Reduces market impact but has transparency concerns.
6. Institutional Trading Strategies
1. Fundamental Investing
Analyzing company financials, economic indicators, and industry trends.
Example: Pension funds buying blue-chip stocks for decades-long holding.
2. Quantitative Trading
Using mathematical models and statistical analysis.
Example: Renaissance Technologies using predictive algorithms.
3. High-Frequency Trading (HFT)
Microsecond-level trading to exploit tiny price discrepancies.
Requires ultra-low latency systems.
4. Event-Driven Strategies
Trading based on mergers, earnings announcements, political changes.
Example: Merger arbitrage.
5. Sector Rotation
Shifting funds into outperforming sectors.
Often tied to macroeconomic cycles.
6. Smart Money Concepts
Using liquidity, order flow, and price action to anticipate retail moves.
7. Institutional Footprints in the Market
Institutions leave behind clues in the market:
Unusual Volume Spikes – sudden jumps may indicate accumulation or distribution.
Block Trades – large off-market transactions recorded.
Option Flow – heavy institutional positions in specific strikes and expiries.
Retail traders often watch these footprints to follow institutional sentiment.
8. Tools & Technology Used by Institutions
Bloomberg Terminal – real-time data, analytics, and trading execution.
Refinitiv Eikon – market research and analysis.
Custom Trading Algorithms – developed in Python, C++, or Java.
Colocation Services – placing servers next to exchange data centers to minimize latency.
AI & Machine Learning – predictive analytics, sentiment analysis.
9. Advantages Institutions Have
Capital Power – Can hold positions through drawdowns.
Information Access – Analysts, insider corporate access (within legal limits).
Lower Costs – Reduced commissions due to scale.
Execution Speed – Direct market connections.
Market Influence – Ability to move prices in their favor.
10. Risks in Institutional Trading
Liquidity Risk
Large positions are hard to exit without impacting prices.
Counterparty Risk
If trading OTC (over-the-counter), the other party may default.
Regulatory Risk
Sudden rule changes affecting strategies.
Reputational Risk
Large losses can harm public trust (e.g., Archegos Capital collapse).
Systemic Risk
Large institutions failing can trigger market crises (e.g., Lehman Brothers in 2008).
Conclusion
Institutional trading is the backbone of global markets. Institutions have the resources, technology, and strategies to influence prices and liquidity in ways retail traders cannot.
For a retail trader, understanding institutional behavior can provide a significant edge. Watching their footprints — through volume, order flow, filings, and market structure — can help align your trades with the big players rather than against them.
The difference between trading with institutional flows and trading against them can be the difference between consistent profits and constant losses.
Trade ideas
Algorithmic trading 1. Introduction to Algorithmic Trading
Algorithmic trading, often called algo trading or automated trading, is the process of using computer programs to execute trades in financial markets according to a predefined set of rules.
These rules can be based on price, volume, timing, market conditions, or mathematical models. Once set, the algorithm automatically sends orders to the market without manual intervention.
In simple terms:
Instead of sitting in front of a trading screen and clicking “buy” or “sell,” you tell a machine exactly what conditions to look for, and it trades for you.
It’s like giving your brain + discipline to a computer — minus the coffee breaks, panic, and impulsive decisions.
1.1 Why Algorithms?
Humans are prone to:
Emotional bias (fear, greed, hesitation)
Slow reaction times
Fatigue and inconsistency
Computers, in contrast:
Execute instantly (microseconds or nanoseconds)
Follow rules 100% consistently
Handle multiple markets at once
Backtest ideas over years of data within minutes
This explains why algo trading accounts for 70%–80% of trading volume in developed markets like the US and over 50% in Indian markets for certain instruments.
1.2 The Core Components
Every algorithmic trading system consists of:
Strategy Logic – The rules that trigger trades (e.g., moving average crossover, statistical arbitrage).
Programming Interface – The language/platform (Python, C++, Java, MetaTrader MQL, etc.).
Market Data Feed – Real-time price, volume, and order book data.
Execution Engine – Connects to broker/exchange to place orders.
Risk Management Module – Stops, limits, and capital allocation rules.
Performance Tracker – Monitors profit/loss, drawdowns, and execution quality.
2. How Algorithmic Trading Works – Step by Step
Let’s break it down:
Idea Generation
Define a hypothesis: “I think when the 50-day moving average crosses above the 200-day MA, the stock will trend upward.”
Strategy Design
Turn the idea into exact rules: If MA50 > MA200 → Buy; If MA50 < MA200 → Sell.
Coding the Strategy
Program in Python, C++, R, or a broker’s native scripting language.
Backtesting
Run the algorithm on historical data to see how it would have performed.
Paper Trading (Simulation)
Trade in real time with virtual money to test live conditions.
Execution in Live Markets
Deploy with real money, connected to exchange APIs.
Monitoring & Optimization
Adjust based on performance, slippage, and market changes.
2.1 Example of a Simple Algorithm
Pseudocode:
sql
Copy
Edit
If Close Price today > 20-day Moving Average:
Buy 10 units
If Close Price today < 20-day Moving Average:
Sell all units
The computer checks the rule every day (or every minute, or millisecond, depending on design).
3. Types of Algorithmic Trading Strategies
Algo trading is not one-size-fits-all. Traders and funds design algorithms based on their objectives, timeframes, and risk appetite.
3.1 Trend-Following Strategies
Logic: “The trend is your friend.”
Tools: Moving Averages, MACD, Donchian Channels.
Example: Buy when short-term average crosses above long-term average.
Pros: Simple, works in trending markets.
Cons: Suffers in sideways/choppy markets.
3.2 Mean Reversion Strategies
Logic: Prices eventually revert to their mean (average).
Tools: Bollinger Bands, RSI, z-score.
Example: If stock falls 2% below its 20-day average, buy expecting a bounce.
Pros: Works well in range-bound markets.
Cons: Can blow up if the “mean” shifts due to fundamental changes.
3.3 Statistical Arbitrage
Logic: Exploit price inefficiencies between correlated assets.
Example: If Reliance and TCS usually move together but Reliance lags by 1%, buy Reliance and short TCS expecting convergence.
Pros: Market-neutral, less affected by overall market trend.
Cons: Requires high-frequency execution and deep statistical modeling.
3.4 Market-Making Algorithms
Logic: Provide liquidity by continuously posting buy and sell quotes.
Goal: Earn the bid-ask spread repeatedly.
Risk: Adverse selection during sharp market moves.
3.5 Momentum Strategies
Logic: Stocks that move strongly in one direction will continue.
Tools: Breakouts, Volume Surges.
Example: Buy when price breaks a 50-day high with high volume.
3.6 High-Frequency Trading (HFT)
Executes in microseconds.
Focuses on ultra-short-term inefficiencies.
Requires co-location servers near exchanges for speed advantage.
3.7 Event-Driven Algorithms
React to corporate actions or news:
Earnings releases
Mergers & acquisitions
Dividend announcements
Often combined with natural language processing (NLP) to scan news feeds.
4. Technologies Behind Algo Trading
4.1 Programming Languages
Python – Most popular for beginners & research.
C++ – Preferred for HFT due to speed.
Java – Stable for large trading systems.
R – Strong in statistical modeling.
4.2 Data
Historical Data – For backtesting.
Real-Time Data – For live execution.
Level 2/Order Book Data – For order flow analysis.
4.3 APIs & Broker Platforms
REST APIs – Easy to use but slightly slower.
WebSocket APIs – Low latency, real-time streaming.
FIX Protocol – Industry standard for institutional trading.
4.4 Infrastructure
Cloud Hosting – AWS, Google Cloud.
Dedicated Servers – For low latency.
Co-location – Servers physically near exchange data centers.
5. Advantages of Algorithmic Trading
Speed – Executes in microseconds.
Accuracy – Removes manual entry errors.
Backtesting – Test before risking real money.
Consistency – No emotional bias.
Multi-Market Trading – Monitor dozens of assets simultaneously.
Scalability – Once built, can trade large portfolios.
6. Risks & Challenges in Algo Trading
6.1 Market Risks
Model Overfitting: Works perfectly on past data but fails live.
Regime Changes: Strategies die when market structure shifts.
6.2 Technical Risks
Connectivity Issues
Data Feed Errors
Exchange Downtime
6.3 Execution Risks
Slippage – Orders filled at worse prices due to latency.
Front Running – Competitors' algorithms act faster.
6.4 Regulatory Risks
Many countries have strict algo trading regulations:
SEBI in India requires pre-approval for certain algos.
SEC & FINRA in the US enforce strict monitoring.
7. Backtesting & Optimization
7.1 Steps for Backtesting
Choose historical data range.
Apply your strategy rules.
Measure key metrics:
CAGR (Compound Annual Growth Rate)
Sharpe Ratio
Max Drawdown
Win/Loss Ratio
7.2 Common Pitfalls
Look-Ahead Bias: Using future data unknowingly.
Survivorship Bias: Ignoring stocks that delisted.
Over-Optimization: Tweaking too much to fit past data.
8. Case Study – Moving Average Crossover Algo
Imagine we test a 50-day vs 200-day MA crossover strategy on NIFTY 50 from 2010–2025.
Capital: ₹10,00,000
Buy Rule: MA50 > MA200 → Buy
Sell Rule: MA50 < MA200 → Sell
Results:
CAGR: 11.2%
Max Drawdown: 18%
Trades: 42 over 15 years
Win Rate: 57%
Conclusion: Low trading frequency, steady returns, low drawdown — suitable for positional traders.
Final Thoughts
Algorithmic trading is not a magic money machine — it’s a discipline that combines mathematics, programming, and market knowledge.
When done right, it can offer speed, precision, and scalability far beyond human capability.
When done wrong, it can cause lightning-fast losses.
The game has evolved from shouting in the trading pit to coding in Python. The traders who adapt, learn, and innovate will keep winning — whether they sit in a Wall Street skyscraper or a small home office in Mumbai.
Global Factors & Commodities Impact Introduction
In today’s hyperconnected world, no market or economy functions in isolation. Global factors—from geopolitics to central bank decisions—exert profound influence on economies, financial markets, currencies, and especially commodities. Commodities, being the raw backbone of industrial production and human consumption, respond swiftly and often dramatically to global shifts.
Understanding the interplay between global factors and commodity prices is essential for traders, investors, policymakers, and analysts alike. This document presents a detailed exploration of how key global dynamics affect commodities and how in turn, those commodities shape macroeconomic and financial landscapes.
I. Understanding Commodities and Their Role
Commodities are basic goods used in commerce, interchangeable with other goods of the same type. These are broadly categorized into:
Hard Commodities: Natural resources like oil, gas, gold, copper.
Soft Commodities: Agricultural products like wheat, coffee, sugar, cotton.
Commodities as Economic Indicators
Barometers of economic health: Rising industrial metals like copper signal strong manufacturing, while falling oil prices may suggest a slowdown.
Safe-haven assets: Gold typically rallies during geopolitical tension or financial instability.
Inflation hedges: Commodities often rise in inflationary periods as raw material costs increase.
II. Key Global Factors Influencing Commodities
Let’s explore the major global macro factors and how they influence the commodities market:
1. Geopolitical Events
a) War, Tensions, and Conflict
Wars in resource-rich regions (e.g., Middle East) disrupt oil supply, causing prices to spike.
Tensions in Eastern Europe (like the Russia-Ukraine war) impacted natural gas, wheat, and fertilizer prices.
b) Sanctions and Trade Restrictions
US sanctions on Iran or Russia impact global energy flows.
Export bans (e.g., Indonesia on palm oil, India on wheat) cause global supply shortages.
2. Monetary Policy & Central Banks
a) US Federal Reserve Policy
Fed rate hikes strengthen the dollar, making commodities (priced in USD) more expensive globally, which suppresses demand and prices.
Lower interest rates can spur commodity demand due to cheaper credit.
b) Global Liquidity and Inflation
High global liquidity often leads to speculative inflows in commodities.
Inflation leads to increased interest in commodities as an inflation hedge (e.g., gold, oil).
3. US Dollar Index (DXY)
Commodities are dollar-denominated:
Stronger USD = commodities become costlier for foreign buyers → demand drops → prices fall.
Weaker USD = makes commodities cheaper globally → boosts demand → prices rise.
There’s a strong inverse correlation between DXY and commodities like crude oil, copper, and gold.
4. Global Economic Growth & Recession
a) Growth Phases
Industrial growth in China or India boosts demand for base metals (copper, zinc).
Infrastructure development increases demand for energy and materials.
b) Recessionary Trends
Slowdowns cause demand to collapse, reducing prices.
Oil prices fell sharply during COVID-19-induced global lockdowns.
5. Climate and Weather Patterns
a) Natural Disasters & Droughts
Hurricanes in the Gulf of Mexico disrupt oil production.
Droughts in Brazil affect coffee and sugar output.
b) El Niño / La Niña
These cyclical weather patterns alter rainfall and crop yields globally, heavily affecting soft commodities.
6. Technological Changes & Energy Transition
Green energy transition increases demand for lithium, cobalt, nickel (used in EV batteries).
Decline in fossil fuel investments can lead to long-term supply constraints even as demand persists.
7. Global Supply Chains & Shipping
Port congestion, container shortages, or shipping route blockades (e.g., Suez Canal) raise transportation costs and delay supply of commodities.
COVID-19 and its aftermath heavily disrupted supply chains, affecting availability and prices of everything from semiconductors to steel.
8. Speculation & Financialization
Hedge funds and institutional investors increasingly use commodity futures for diversification or speculation.
Large inflows into commodity ETFs can drive prices independent of actual supply-demand fundamentals.
III. Case Studies: How Global Factors Moved Commodity Markets
Case Study 1: Russia-Ukraine War (2022–2023)
Crude Oil: Brent soared above $130/bbl due to fear of Russian supply disruptions.
Natural Gas: European gas prices skyrocketed due to dependency on Russian pipelines.
Wheat & Corn: Ukraine, being a global grain exporter, saw blocked exports, leading to food inflation globally.
Fertilizers: Russia is a major potash exporter; sanctions caused fertilizer shortages and global agricultural stress.
Case Study 2: COVID-19 Pandemic (2020)
Oil Collapse: WTI futures turned negative in April 2020 due to oversupply and zero demand.
Gold Rally: Fears of economic collapse, stimulus packages, and inflation boosted gold past $2000/oz.
Copper and Industrial Metals: After initial crash, recovery driven by Chinese infrastructure stimulus boosted prices.
Case Study 3: China's Economic Boom (2000s–2010s)
China’s meteoric growth led to a commodity supercycle.
Demand from real estate and infrastructure drove up prices of:
Iron ore
Copper
Coal
Oil
Global mining and metal exporting nations like Australia, Brazil, and South Africa benefited immensely.
IV. Commodities’ Feedback on the Global Economy
Just as global events influence commodities, the price and availability of commodities influence the global economy:
1. Inflation Driver
High commodity prices lead to cost-push inflation.
Example: Crude oil spikes increase transportation, manufacturing, and plastic costs.
2. Trade Balance Impacts
Commodity-importing nations (like India for oil) suffer higher deficits when prices rise.
Exporters (like Saudi Arabia, Australia) benefit from higher revenue and forex reserves.
3. Interest Rate Policy
Central banks may hike rates to control inflation caused by commodity spikes.
Commodity-driven inflation can trigger stagflation, forcing tough monetary decisions.
4. Consumer Spending
Fuel and food price inflation reduces disposable income, hurting demand for discretionary goods.
5. Corporate Profit Margins
Industries reliant on raw materials (FMCG, auto, infrastructure) face margin pressure with rising input costs.
V. Sector-Wise Impact of Commodities
1. Energy Sector
Oil & Gas companies benefit from rising crude prices.
Refining margins and exploration investments become attractive.
2. Metals & Mining
Companies like Vedanta, Hindalco benefit from higher prices of aluminum, copper, etc.
Steel sector tracks iron ore and coking coal prices.
3. Agriculture
Fertilizer, sugar, edible oil, and agrochemical companies see profits swing with crop and soft commodity trends.
4. Transportation and Logistics
High fuel prices hurt airlines, shipping, and logistics firms.
Global supply bottlenecks also affect these industries directly.
VI. Key Commodities and Their Global Sensitivities
1. Crude Oil
Prone to OPEC decisions, Middle East tensions, US shale output.
Benchmark for energy inflation.
2. Gold
Sensitive to interest rates, dollar strength, and geopolitical tension.
Hedge against currency devaluation and inflation.
3. Copper
Dubbed “Doctor Copper” due to its predictive power for global growth.
Used extensively in construction, electronics, EVs.
4. Natural Gas
Seasonal demand (winter heating), pipeline issues, and storage levels dictate prices.
LNG is reshaping global gas trade patterns.
5. Wheat, Corn, and Soybeans
Affected by droughts, wars, and export policies.
Also influenced by biofuel policies (e.g., corn for ethanol).
6. Lithium, Nickel, Cobalt
Critical for battery manufacturing.
Demand surging due to EV and renewable energy expansion.
VII. Emerging Trends in Commodity Markets
1. Green Commodities Boom
Demand for rare earths, lithium, and graphite surging due to energy transition.
2. Decentralized Supply Chains
Countries diversifying supply sources to reduce risk of disruptions (e.g., China+1 strategy).
3. Digital Commodities Platforms
Blockchain and AI-based trading platforms increasing transparency and liquidity in physical commodity markets.
4. ESG Impact
Environmental and social governance (ESG) concerns influencing investment in mining and fossil fuels.
Restrictions on dirty industries affect future supply potential.
VIII. Strategies for Traders & Investors
A. Hedging with Commodities
Institutional investors use commodities to hedge equity, bond, and inflation risks.
B. Trading through Derivatives
Futures, options, and commodity ETFs enable exposure to price movements.
C. Following Macro Themes
Aligning trades with prevailing global trends (e.g., buying lithium during EV boom).
D. Currency-Commodities Interplay
Monitoring USD, INR, and other forex trends for insights into commodity direction.
E. Sentiment & News Monitoring
Quick reactions to breaking geopolitical or economic news can create trading opportunities.
IX. Conclusion
Commodities form the bedrock of the global economy, and their prices act as both signals and triggers for macroeconomic trends. As we've seen, a wide range of global factors—monetary policy, geopolitical events, dollar strength, supply-chain dynamics, and technological shifts—all converge to influence commodity markets.
In turn, the direction of commodities affects everything from inflation and interest rates to corporate profitability and trade balances. Therefore, understanding the interlinked feedback loop between global factors and commodities is essential for anyone navigating the financial world—be it a retail investor, policymaker, fund manager, or trader.
In the era of globalization and real-time information flow, commodities have become not just economic inputs but macroeconomic indicators, capable of shaking up entire industries and shifting the course of national economies. As we move forward into a world shaped by climate change, deglobalization, digital transformation, and geopolitical flux, commodities will remain at the center of global financial narratives.

Crucial Levels to Watch for ICICI BankICICI Bank has resistance near ₹1500 and strong support around ₹1300. Monitor these levels closely. If ₹1500 is broken, the next targets are ₹1638 and near ₹1700.

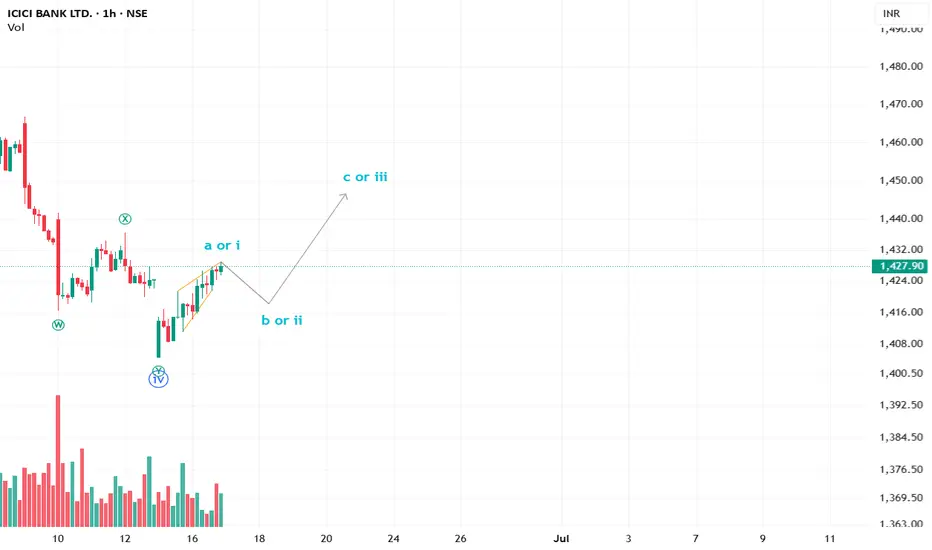
ICICIBANK can follow this path? Clues on the wayA beautiful leading diagonal in ICICI bank reflecting Wave a or i. We can see a minor downside tomorrow and an upside short-term move for a good options trade.
ICICI bank : Go long 1390-85Keep adding this bank giant with long term investment view - enter with small quantity @ 1400, 1370 holding sl 1250
We may expect it 2000, 2200 in around a year.
Accumulation strategy might workin such a big stocks.

ICICI bank Good short CandidateICICI Bank has formed an Ending Diagonal Pattern near its recent highs, typically signaling a potential reversal in trend. This pattern is often observed in the final stages of an uptrend and suggests exhaustion in bullish momentum.
Following the completion of the diagonal, the stock has broken down below the lower trendline, confirming the bearish setup. Furthermore, it has already completed a retest of the breakdown level, which strengthens the validity of the reversal signal.
From a trading perspective, this setup offers a favorable risk-reward ratio for initiating short positions, especially with a clearly defined invalidation level (above the retest zone) and a potential downside target aligned with prior support levels or Fibonacci retracement zones.
Summary:
Pattern: Ending Diagonal (Bearish)
Status: Breakdown and retest completed
Outlook: Short bias with favorable risk-reward
Watch levels: Retest zone (resistance), key support for profit booking

Icici in Buy zoneIcici 1425 is in buy zone.
After liquidity clearance it is showing positive movement
Volume supports the same.
We expect Icici could retest 1450 with support 1412 and possibility to break the resistance zone.

Time To Book Your Profit in ICICI BankHere is a detailed overview of **ICICI Bank's Business Model**:
---
## 🏦 **ICICI Bank: Company Overview**
* **Full Name:** Industrial Credit and Investment Corporation of India Bank
* **Established:** 1994 (as a bank; ICICI was originally founded in 1955)
* **Headquarters:** Mumbai, Maharashtra, India
* **Type:** Public Sector Bank (Private Sector Commercial Bank)
* **Listing:** NSE & BSE (India), NYSE (US – ADR)
* **CEO & MD (2024):** Sandeep Bakhshi
* **Tagline:** *“Hum Hai Na, Khayal Apka”*
---
## 🔷 **1. Core Business Segments**
| Segment | Description |
| --------------------------------- | --------------------------------------------------------------------------- |
| **Retail Banking** | Services for individuals – savings accounts, loans, credit cards, insurance |
| **Corporate & Wholesale Banking** | Banking for large businesses and corporates – working capital, loans, forex |
| **Treasury Operations** | Investments, trading in bonds, forex, derivatives |
| **Rural & Agriculture Banking** | Loans and financial inclusion products for rural India |
| **International Banking** | NRI services, overseas branches (UK, Canada, Dubai, Singapore, etc.) |
---
## 🔷 **2. Revenue Model**
ICICI Bank earns through a mix of **interest-based** and **non-interest income**:
| Revenue Stream | Source |
| -------------------- | ------------------------------------------------------------------------------------ |
| **Interest Income** | Loans to retail, corporate, SME, and agriculture customers |
| **Fee-Based Income** | Charges on cards, ATM, forex, processing, and insurance commissions |
| **Treasury Income** | Investments in government securities, derivatives, and forex |
| **Cross-Selling** | Distribution of insurance (via ICICI Prudential), mutual funds (via ICICI AMC), etc. |
> 🧾 **FY24 Revenue:** ₹125,000+ crore
> 💰 **Net Profit (FY24):** ₹41,000+ crore
> 🏦 **Net Interest Margin (NIM):** \~4.5%
---
## 🔷 **3. Key Products & Services**
### 🔹 **Retail Banking**
* Savings & Current Accounts
* Home Loans, Car Loans, Personal Loans
* Credit Cards (Coral, Rubyx, Amazon Pay ICICI)
* Digital Banking: iMobile app, internet banking
### 🔹 **Corporate & SME Services**
* Working Capital Loans
* Cash Management
* Forex & Trade Finance
* Supply Chain Financing
### 🔹 **Insurance & Investments**
* Life Insurance (via ICICI Prudential)
* General Insurance (via ICICI Lombard)
* Mutual Funds & Portfolio Services (ICICI Prudential AMC)
---
## 🔷 **4. Key Customer Segments**
| Segment | Description |
| -------------------------------------- | ----------------------------------------------------- |
| **Retail Customers** | Salaried professionals, self-employed, students, NRIs |
| **Corporate Clients** | Large listed companies, MSMEs, MNCs |
| **Rural Clients** | Farmers, SHGs, rural businesses |
| **High Net-Worth Individuals (HNWIs)** | Private banking & wealth management |
---
## 🔷 **5. Key Partners**
* **Subsidiaries**: ICICI Prudential Life, ICICI Lombard, ICICI Securities, ICICI AMC
* **Fintech Partners**: PhonePe, Google Pay, Razorpay, Paytm
* **Technology Providers**: Infosys (Finacle), IBM, Microsoft
* **Regulators**: RBI, SEBI, IRDAI
---
## 🔷 **6. Cost Structure**
* Employee costs
* IT infrastructure and branch operations
* Risk provisioning (for bad loans)
* Marketing and distribution
* Compliance & regulatory costs
---
## 🔷 **7. Distribution Channels**
* **Physical Branches:** \~5,900+ across India
* **ATMs:** \~17,000+
* **Digital Channels:** iMobile app, internet banking, WhatsApp banking
* **Phone Banking & Relationship Managers**
> ICICI is among India’s most digital-first banks with **\~90% transactions** happening via digital channels.
---
## 🔷 **8. Competitive Advantages**
* Strong digital ecosystem (early adopter of mobile & internet banking)
* Universal bank model with end-to-end services
* Strong retail and SME franchise
* Diversified income streams from subsidiaries
* High asset quality and robust capital adequacy
---
## 🔷 **9. Challenges**
* Competition from fintechs and neo-banks
* Regulatory risks (RBI tightening norms)
* Cybersecurity and data privacy
* Interest rate and credit risk cycles
* High exposure to retail credit (in case of economic slowdown)
---
## 🔷 **10. Business Model Canvas (Summary)**
| **Component** | **Details** |
| -------------------------- | ------------------------------------------------------------- |
| **Key Partners** | Subsidiaries, fintechs, payment platforms |
| **Key Activities** | Lending, deposit-taking, digital banking, investment services |
| **Value Proposition** | End-to-end financial services, secure digital platforms |
| **Customer Segments** | Retail, SMEs, Corporates, NRIs |
| **Customer Relationships** | Long-term, digital-first, personalized |
| **Channels** | Branches, iMobile app, website, contact centers |
| **Revenue Streams** | Interest income, fees, investment returns |
| **Cost Structure** | Branch operations, tech infrastructure, employee costs |
---
## 📈 **Subsidiaries of ICICI Group**
| Subsidiary | Domain |
| ------------------------- | --------------------------------- |
| **ICICI Prudential Life** | Life Insurance |
| **ICICI Lombard** | General Insurance |
| **ICICI Securities** | Stock Broking, Investment Banking |
| **ICICI Prudential AMC** | Mutual Funds |
| **ICICI Bank UK, Canada** | International Banking |
---
thanks
ICICI bank ready for fresh ATH buy on dip near support How My Harmonic pattern projection Indicator work is explained below :
Recent High or Low :
D-0% is our recent low or high
Profit booking zone: D13% -D15% is
range if break them profit booking start on uptrend or downtrend but only profit booking, trend not changed
SL reversal zone : SL 23% and SL 25% is reversal zone if break then trend reverse and we can take reverse trade
Target : T1, T2, T3, T4 and .
Are our Target zone

ICICIBANKChart formed false breakout on rsi yesterday currently trading at 50% fib range from last swing low , possible bounce from current levels with SL candle closing below

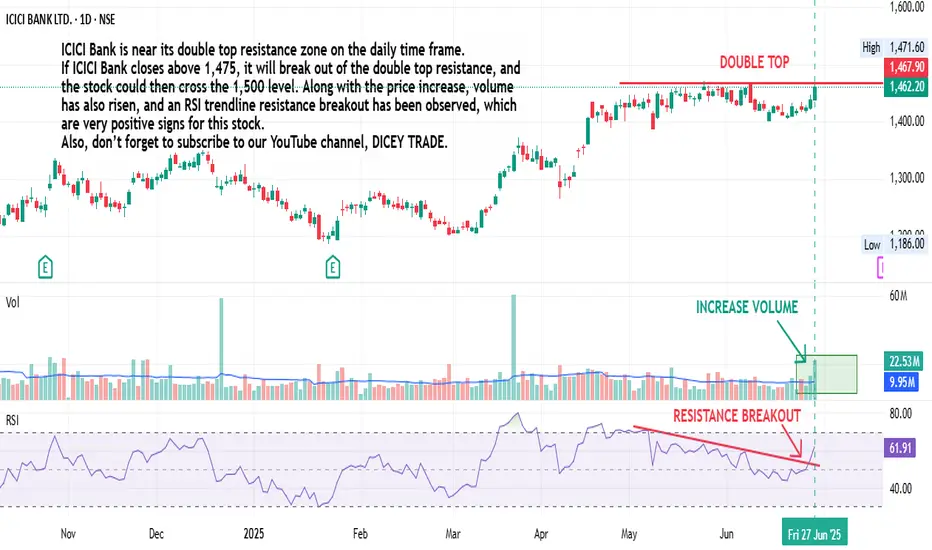
ICICI BANK Double Top Breakout: Is a Major Price Surge Ahead? ICICI Bank is near its double top resistance zone on the daily time frame. If ICICI Bank closes above 1,475, it will break out of the double top resistance, and the stock could then cross the 1,500 level. Along with the price increase, volume has also risen, and an RSI trendline resistance breakout has been observed, which are very positive signs for this stock. Also, don’t forget to subscribe to our YouTube channel, DICEY TRADE.
ICICI Bank - Trend change ICICI Bank: A Bullish Pulse Beats Stronger
After weeks of consolidation, ICICI Bank seems to be scripting a new chapter on the charts. A classic Double Bottom pattern has emerged on the 1-hour timeframe, signaling a potential trend reversal from its recent downtrend. What’s more, the price has confidently crossed above the 50 EMA, validating early bullish intent with a neat retracement that hints at healthy market structure.
The real story, though, is in the volume. On the daily chart, elevated volumes are whispering the tale of accumulation—perhaps the smart money is taking positions ahead of a breakout?
If the current momentum sustains and we see a confirmed breakout above the neckline, targets of ₹1,450 and beyond are well within reach. The setup feels like a coiled spring—technicals aligning with intent.

Icici in beraish trendIcici 1424 is bearish trend . Volume suggests weak bull strength. Resistance at 1447. Target 1396,1346.
On Valuation it is at fair value of 1438. With 12% returns it has potential to reach 1610 in 1 year time frame.

ICICI BANK – Strong Momentum Breakout | BTST + Swing SetupICICI BANK – Strong Momentum Breakout | BTST + Swing Setup Active
CMP: ₹1,427.10 | Chart: 5-min | Date: June 22, 2025
📌 Observations:
Sharp rally from ₹1,406 to ₹1,434 during the day—18+ point move
Volume surge seen during breakout phase post 2:30 PM – volume spiked from avg to 1.07M+
Price retested breakout zone around ₹1,425 and held—sign of strength & accumulation
Overall structure shows clean higher highs and higher lows formation
📈 Levels to Watch
Support Zones:
₹1,421 – breakout retest zone
₹1,407 – volume base
Resistance / Targets:
₹1,435 – intraday high
₹1,452 – short-term swing target
₹1,470 – 3–4 day potential breakout target
💡 Trade Setup
🔹 BTST / Intraday
📌 Entry: CMP ₹1,427.10 or minor dip to ₹1,424
🎯 Target: ₹1,435–₹1,440
🛑 SL: ₹1,418
🔹 3–4 Day Swing
📌 Entry: Any dip toward ₹1,420
🎯 Target 1: ₹1,452
🎯 Target 2: ₹1,470
🛑 SL: ₹1,407
📊 Indicators Confirming Move:
Volume Surge confirms institutional buying
Clean price structure — ideal for follow-through buying
RSI (not shown) previously cooled from overbought → now in bullish momentum zone
✅ Summary
📈 Price–volume breakout confirmed
🧠 Dip buying opportunity above ₹1,420
⏳ Ideal for intraday + short swing hold
🔔 Watch ₹1,435 zone closely tomorrow — price acceptance = continuation
📅 Review After: 9:50 AM, June 23
📉 Invalidation Below: ₹1,418 (tight) / ₹1,407 (swing)
#ICICIBANK #BTST #SwingTrading #BreakoutStock #Banking #TradingViewIndia #MomentumTrade #VolumeAnalysis #StockMarketIndia

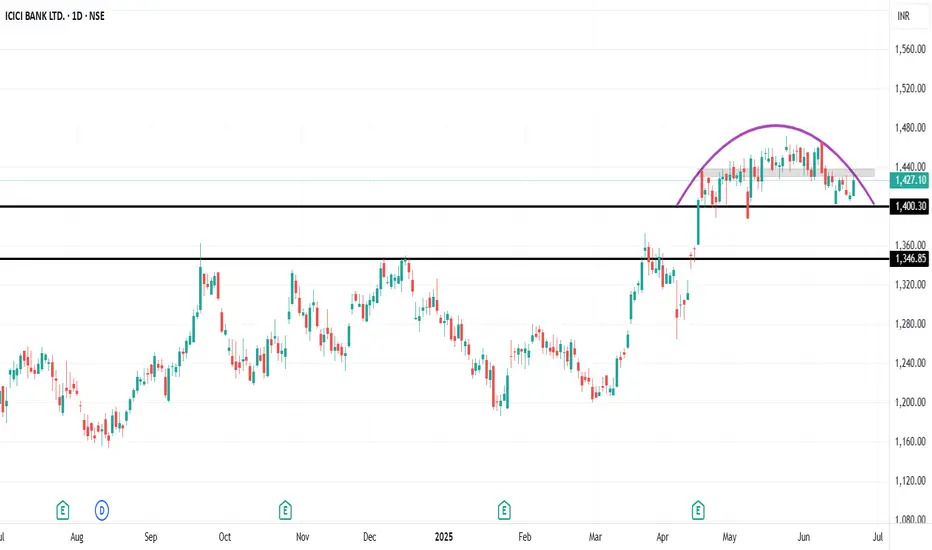
Icici round top patternICICI 1427 is showing round top pattern. If unable to pass through 1440 we shall expect ICICI to break the neck support 1400 and drop to 1326 which could be considered for entry.
On Fy25 EPS of 76.5 it is trading around 19.9 PE where Industrial PE is 13. With an average PE of 18 from 2023, its fair value is at 1300.
ICICIBK (BREAKOUT COMING $OON)he double bottom is a classic bullish reversal pattern in technical analysis. It resembles the letter "W", forming after a downtrend when the price hits a support level twice before breaking out upwards.
Key Features:
- Two distinct lows at roughly the same price level.
- A peak (neckline) between the two lows.
- Breakout confirmation when the price moves above the neckline.
Trading Strategy:
- Entry: Traders often enter a long position once the price breaks above the neckline.
- Stop-loss: Placed below the second bottom to manage risk.
- Target price: Typically measured by the distance between the neckline and the bottoms, projected upwards.
Would you like an example of how this pattern plays out in real market conditions?

ICICI Bank Ltd_Inside Bar Formed on DTFICICI Bank is in a low volatility contraction phase. Watch for a breakout from the inside bar range — the move could be sharp due to the tight setup.
Note :- Above view is only for educational purpose, no any buy or sell recommendations.

ICICI BANK SHORT - AT ANY UPSIDEPrice Rising, Strong Resistance @1464...Continuously unable to cross this level.
Price increasing but RSI showing decline. Negative Divergence on RSI.
Target 1385
Final Target 1350.
ICICI bank is bull or bear?One daily timeframe ICICI Bank clearly formed bull flag pattern, which means upward price movement can see in upcoming days , followed by a period of consolidation.
First resitance can be seen near 1466 followed by some consolidation.
We can plan buy trad with SL 1430.
If price break 1470 then it will create its new high.

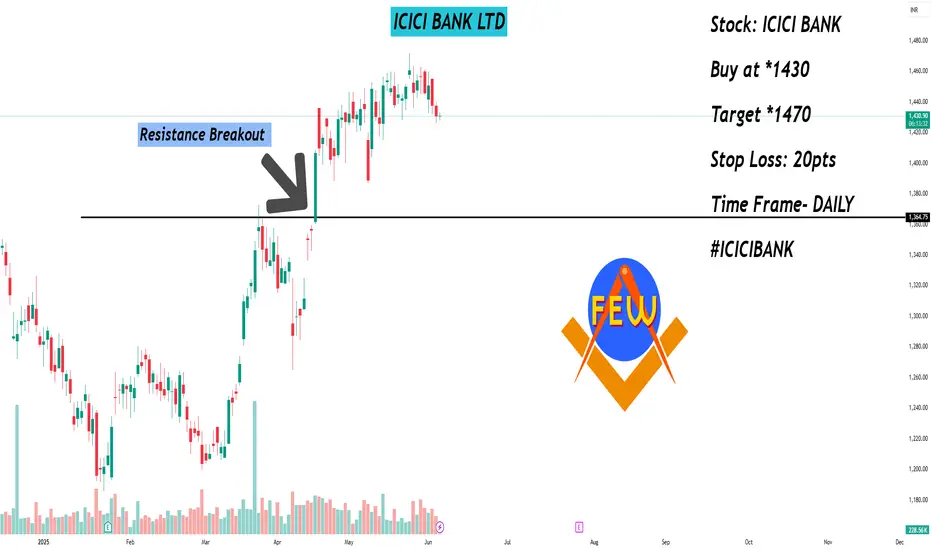
ICICI BANK LTDStocks to Focus on 5th Jun 2025
Stock: ICICI BANK
Buy at *1430
Target *1470
Stop Loss: 20pts
Time Frame- DAILY
#ICICIBANK
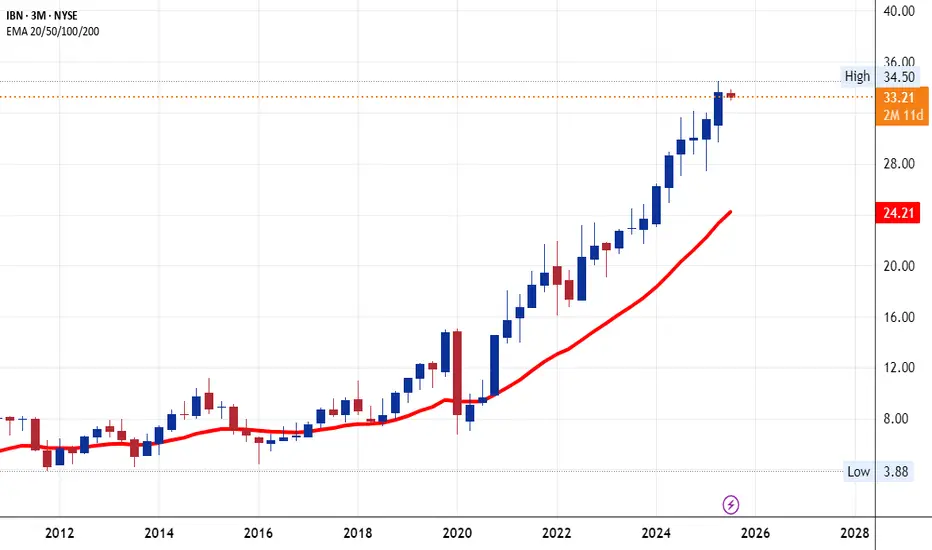
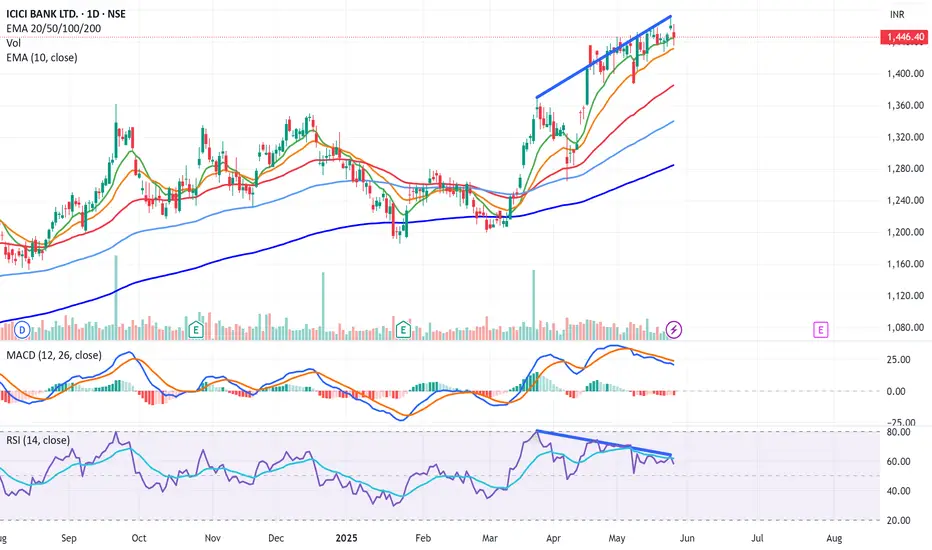
ICICI Bank Powers to Lifetime High Within a Strong Bullish ChannTopic Statement:
ICICI Bank is on a robust bull run, steadily advancing within a strong uptrending channel.
Key Points:
* The stock is moving upwards in a strong bullish uptrending channel, making channel-based trading highly effective
* It is currently trading at its lifetime high, reflecting continued strength and investor optimism
* The price has highly overextended above the 200-day EMA, indicating the stock is highly overbought and may be poised for a cooling-off phase

Technical Class 1Technical analysis is based on the fundamental idea that the price of a security moves in patterns or trends. Another essential assumption is that all fundamental considerations are reflected in the security price, which is a core concept of technical stock research.
