Trading with Automated Systems1. Introduction to Automated Trading Systems
An automated trading system (ATS) is a computer program that follows pre-defined instructions to execute trades in the financial markets. These instructions—based on price, time, indicators, or mathematical models—allow traders to open and close position
Next report date
—
Report period
—
EPS estimate
—
Revenue estimate
—
1.265 EUR
1.41 B EUR
17.19 B EUR
About Mahindra & Mahindra Ltd.
Sector
Industry
CEO
Anish Dilip Shah
Website
Headquarters
Mumbai
Founded
1945
ISIN
USY541641194
FIGI
BBG000BSDLW9
Mahindra & Mahindra Ltd. is a holding company, which engages in the manufacturing of automotive vehicles. It operates through the following segments: Automotive, Farm Equipment, Auto Investment, Farm Investments, and Industrial Businesses and Consumer Services’ segment. The Automotive segment comprises of the sale of automobiles, spare parts, and related services. The Farm Equipment segment involves in the sale of tractors and spare parts. The Auto Investment segment pertains with investments in automotive related subsidiaries, associates and joint ventures. The Farm Investments segment refers to the investments in farm equipment related subsidiaries, associates and joint ventures. The Industrial Businesses and Consumer Services’ segment deals with investments in other than automotive & farm related subsidiaries, associates and joint ventures. The Others segment includes agri, construction equipment, powerol, and spares business unit. The company was founded by Jagdish Chandra Mahindra, Kailash Chandra Mahindra, and Ghulam Mohammed on October 2, 1945, and is headquartered in Mumbai, India.
Related stocks
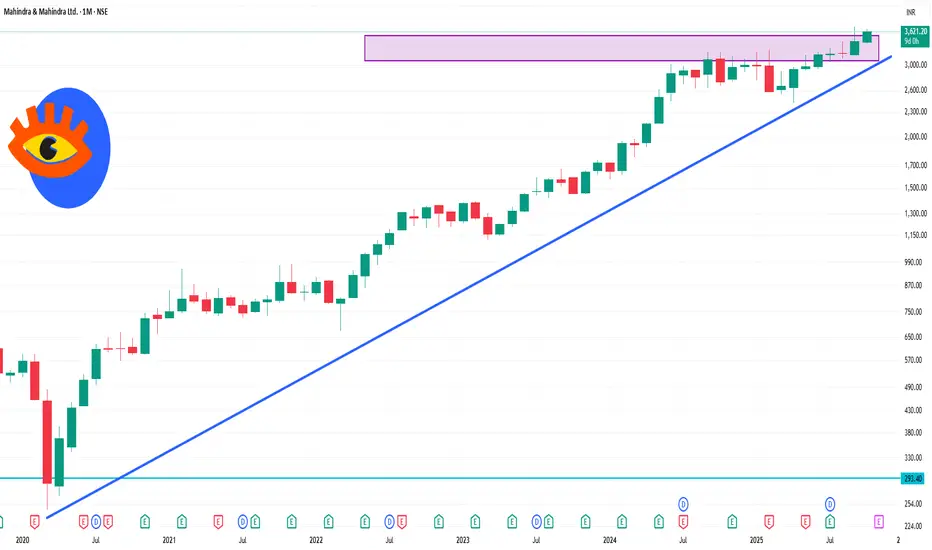
M&MM&M looks strong, if it sustains this price zone, there’s a good probability of an upside move.
The market structure is bullish, and price is trading above all key EMAs, supporting a continuation bias.
Keep it on your watchlist for paper trading.
✅ If you like my analysis, please follow me here a

Mahindra & Mahindra's Inverse Head & Shoulders BreakoutMahindra & Mahindra's Inverse Head & Shoulders Breakout Signals Bullish Momentum with RSI Above 70
Mahindra & Mahindra Ltd. (M&M), currently trading around ₹3,648, is exhibiting a classic inverse head and shoulders pattern on its hourly chart—a bullish reversal setup that often precedes upward pric

M&M 1 Month Time Frame 📊 Monthly Technical Overview
Current Price: ₹3,621.20
52-Week Range: ₹2,425.00 – ₹3,723.80
Recent High: ₹3,723.00 (September 9, 2025)
📈 Market Sentiment
The recent GST tax cut on SUVs with engines over 1500 cc has positively impacted Mahindra's sales, particularly for models like the Scorpio an
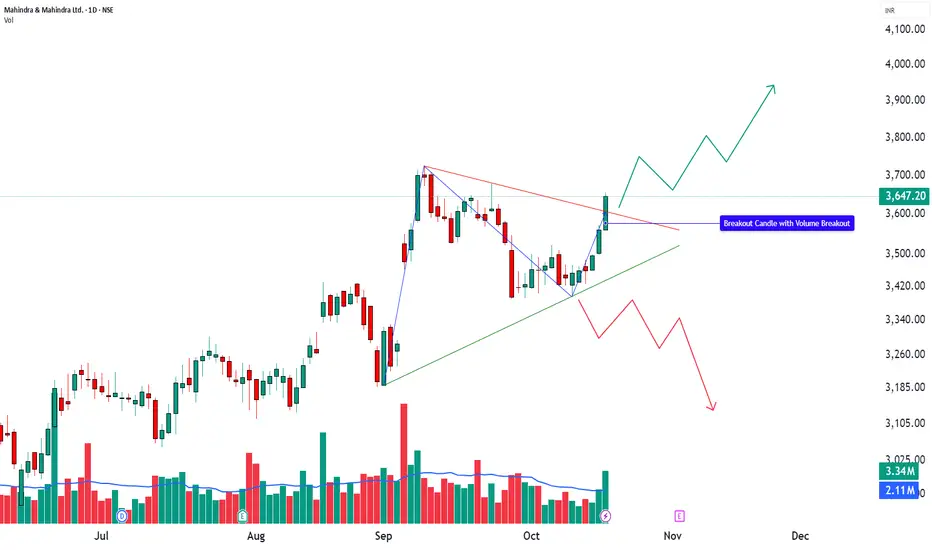
M&M Breaks Out with Volume Support | Structure Meets Momentum________________________________________
🚙 MAHINDRA & MAHINDRA LTD (NSE: M&M) | CMP ₹3,647.20 (+2.43%)
Sector: Auto | Date: 19 Oct 2025
________________________________________
🔹 Price Action:
M&M posted a strong bullish candle, closing near day’s high at ₹3,647.20 with gains of +2.43%.
Volume surge
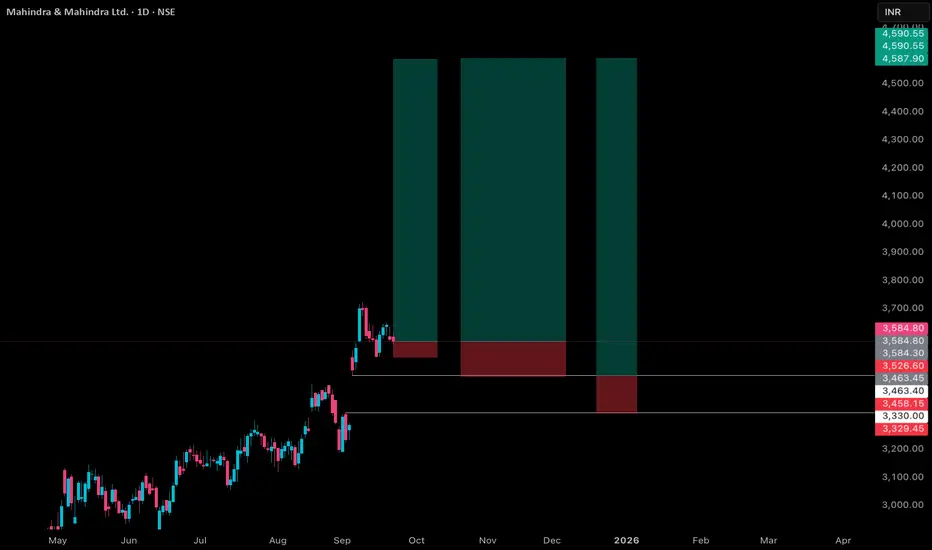
Mahindra & Mahindra Price ActionMahindra & Mahindra (M&M) closed today at ₹3,584.8, showing a slight decline of about 0.2% from the previous close. The stock traded in a range between ₹3,569 and ₹3,616 during the session, indicating sideways movement with moderate volatility. Despite the minor pullback, M&M remains well above its
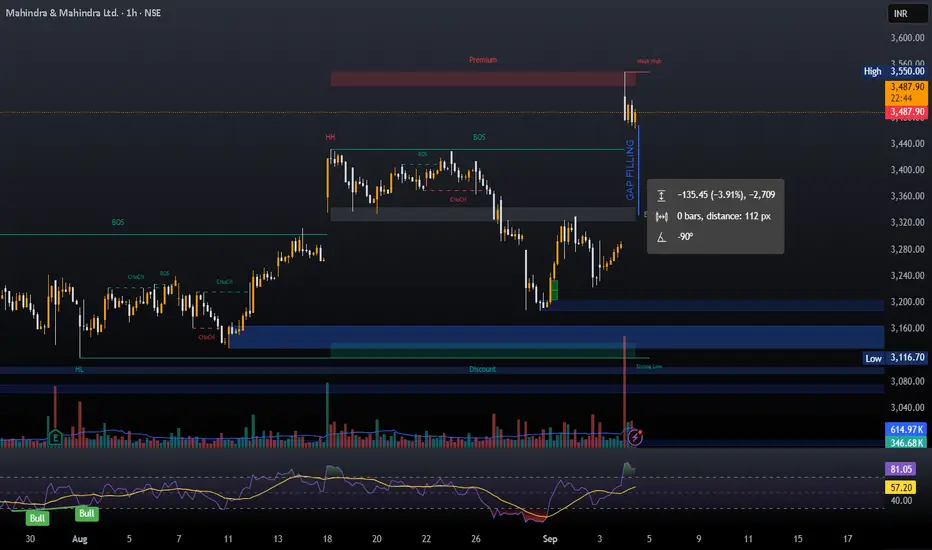
M&M ShortThe GST news has already been factored in and M&M was already trading at its al tie high. A gap up at all time high always gives an opportunity for a sell trade for the gap filling. One can look for sell in M&M with 3550 as resistance zone. Keep track of this chart and see if this concept works or n
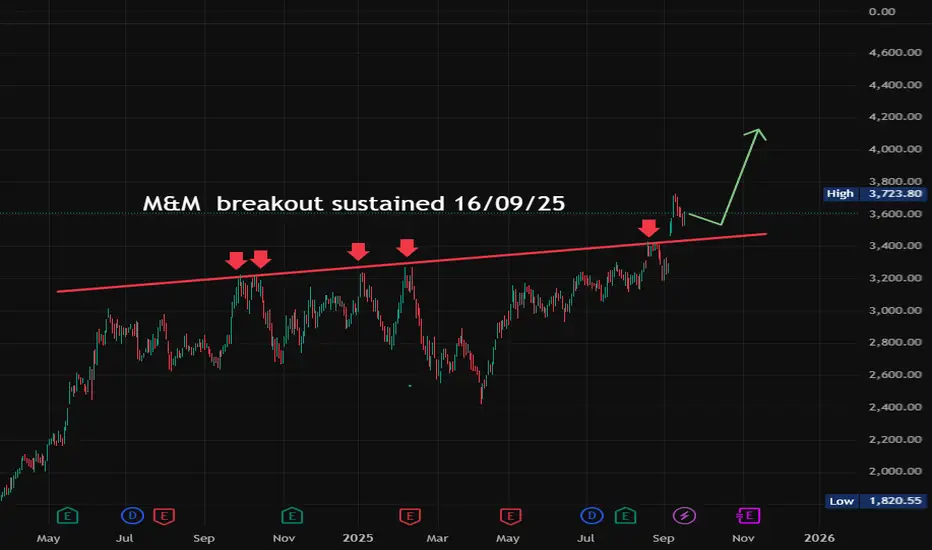
M&M breakout sustained 16/09/25Symbol : M&M , Exchange : NSE India M&M gap-up opened, broke the trend line, and after hitting strong resistance at that trend line on September 4, 2025, sustained successfully. The resistance line formed on September 30, 2024, was tested 5 times with price reversals each time. M&M's trend conti
10 Most Powerful Candlestick Patterns Every Trader Must Know1. Doji – The Candle of Indecision
A Doji looks like a cross (+). This happens when the open and close price are almost the same.
What it means: Neither buyers nor sellers are in full control. Market is confused.
When it matters:
After a strong uptrend → could mean trend reversal (bears may take
A simple Shorting Opportunity in Mahindra & MahindraMahindra & Mahindra has been consolidating under a triangular Pattern, which has given break down.
It can go down further as per the width of the triangle.
Please refer chart for more details.

See all ideas
Displays a symbol's price movements over previous years to identify recurring trends.
757MML26
Mahindra & Mahindra Limited 7.57% 25-SEP-2026Yield to maturity
—
Maturity date
Sep 25, 2026
955MML2063
Mahindra & Mahindra Limited 9.55% 04-JUL-2063Yield to maturity
—
Maturity date
Jul 4, 2063
See all MOM bonds