Trading with Automated Systems1. Introduction to Automated Trading Systems
An automated trading system (ATS) is a computer program that follows pre-defined instructions to execute trades in the financial markets. These instructions—based on price, time, indicators, or mathematical models—allow traders to open and close positions automatically without manual input. The main objective of automation is to improve consistency and remove the psychological barriers that often affect manual trading decisions.
The system can operate across multiple asset classes such as equities, commodities, forex, derivatives, and cryptocurrencies. It can analyze multiple charts simultaneously, detect trading opportunities, and place trades within milliseconds—something human traders cannot match.
2. How Automated Trading Works
Automated trading is based on algorithms—sets of rules or formulas that define how and when trades are made. The process usually involves several steps:
Strategy Development:
Traders define a strategy using technical indicators (like moving averages, RSI, MACD) or statistical models (like mean reversion, momentum, or arbitrage).
Coding the Algorithm:
Once the rules are defined, they are coded into a trading platform (such as MetaTrader, NinjaTrader, or Python-based systems) using programming languages like MQL, Python, or C++.
Backtesting:
The system is tested on historical market data to evaluate its performance, profitability, drawdown, and accuracy.
Optimization:
Parameters are adjusted to improve the system’s performance while avoiding “overfitting,” where the model works only for historical data but fails in live markets.
Execution:
Once tested, the system is deployed for live trading. It monitors the market continuously and executes trades automatically when the defined conditions are met.
Monitoring and Maintenance:
Even though the system is automated, traders must monitor its performance to ensure technical stability and make adjustments when market conditions change.
3. Key Components of Automated Trading Systems
Automated systems rely on several essential components for successful operation:
Trading Algorithm: The heart of the system, it defines when to buy or sell based on predefined rules.
Market Data Feed: Provides real-time price, volume, and order book information.
Execution Engine: Places orders in the market and ensures fast, accurate execution.
Risk Management Module: Sets stop losses, take profits, and position sizing limits to control exposure.
Backtesting Engine: Tests strategies on historical data to evaluate performance.
Broker API: Connects the system to the trading platform for real-time order execution.
Each component must work in harmony to ensure the system performs efficiently, reliably, and safely.
4. Advantages of Automated Trading
1. Speed and Efficiency:
Algorithms can process vast amounts of data and execute trades in milliseconds. This speed is crucial in markets where price fluctuations happen within seconds.
2. Emotion-Free Trading:
Human emotions—fear, greed, and impatience—often lead to mistakes. Automated systems eliminate these factors, ensuring decisions are made purely based on logic and data.
3. Consistency and Discipline:
Since the system follows rules without deviation, it ensures trading consistency and discipline.
4. Backtesting Capability:
Traders can test their strategies on past data before risking real capital, allowing them to refine and validate their approaches.
5. Diversification:
Automated systems can trade multiple assets simultaneously, spreading risk across different instruments and markets.
6. 24/7 Operation:
In global markets like forex and crypto, automated systems can operate continuously without breaks, capturing opportunities even when traders are offline.
5. Risks and Challenges in Automated Trading
Despite its benefits, automated trading also has potential drawbacks:
1. Technical Failures:
Power outages, internet disruptions, or server failures can interrupt trade execution, leading to losses.
2. Over-Optimization:
Traders may “curve fit” their strategies to historical data, creating systems that perform well in testing but fail in real-time markets.
3. Market Volatility:
Sudden market shifts or black swan events can cause large losses if the system cannot adapt quickly.
4. Lack of Human Judgment:
Automated systems follow logic blindly and may miss contextual market information or news events that impact price movements.
5. Cost and Complexity:
Developing and maintaining advanced trading algorithms requires technical skills and can be expensive due to data feeds, servers, and platform costs.
6. Latency and Slippage:
Even minor execution delays can cause slippage—where trades occur at a slightly different price than expected, impacting profitability.
6. Types of Automated Trading Strategies
Trend-Following Systems:
These strategies identify and trade in the direction of prevailing market trends using indicators like moving averages and breakouts.
Mean Reversion Strategies:
They assume prices will revert to their average level after deviation and trade accordingly.
Arbitrage Strategies:
Exploit price differences between assets or markets to earn risk-free profits.
Scalping Strategies:
Involve executing a large number of trades to capture small price movements.
High-Frequency Trading (HFT):
Uses powerful computers to execute thousands of trades per second, capitalizing on minute price inefficiencies.
News-Based Trading:
Algorithms analyze economic reports or sentiment data to make quick trades based on market reactions.
Machine Learning-Based Trading:
AI-driven models learn from data patterns to predict price movements and adjust dynamically to market changes.
7. Platforms and Tools for Automated Trading
There are several platforms designed for algorithmic trading:
MetaTrader 4/5: Widely used in forex, supports automated trading through Expert Advisors (EAs).
NinjaTrader: Suitable for futures and equities with advanced charting tools.
Interactive Brokers API: Offers professional-grade access for institutional traders.
TradingView (with Pine Script): Enables custom strategy scripting and backtesting.
Python and R: Common programming languages used for custom algorithm development.
QuantConnect, AlgoTrader, and MetaStock: Cloud-based or hybrid solutions for quantitative traders.
8. Risk Management in Automated Systems
No trading system is perfect, and risk management is crucial. Automated systems should integrate the following controls:
Stop-Loss Orders: Automatically limit losses if prices move unfavorably.
Take-Profit Orders: Lock in profits once a target is achieved.
Position Sizing: Allocate capital proportionally to reduce exposure.
Diversification: Spread investments across assets to mitigate systemic risk.
Periodic Review: Regularly monitor system performance and adjust parameters as needed.
Proper risk control ensures long-term survival even when markets behave unpredictably.
9. The Future of Automated Trading
The future of automated trading is being shaped by artificial intelligence (AI), machine learning (ML), and big data analytics. These technologies allow systems to adapt dynamically, detect hidden patterns, and evolve based on market conditions. Quantum computing may further transform trading by enabling complex computations in real time.
Furthermore, decentralized finance (DeFi) and blockchain-based platforms are introducing smart contract trading bots, expanding automation beyond traditional financial markets. As technology evolves, automation will become more accessible, transparent, and efficient.
10. Conclusion
Automated trading systems have transformed financial markets by combining data analytics, computing power, and strategic precision. They allow traders to operate with discipline, efficiency, and emotion-free execution. However, automation is not a “set-and-forget” solution—it demands rigorous testing, constant monitoring, and sound risk management.
When used wisely, automated trading enhances performance, minimizes human errors, and provides a competitive edge in a fast-moving global marketplace. As technology continues to evolve, the integration of AI, machine learning, and blockchain will make automated trading even more intelligent, adaptive, and powerful—reshaping how both retail and institutional investors participate in the financial world.
Trade ideas
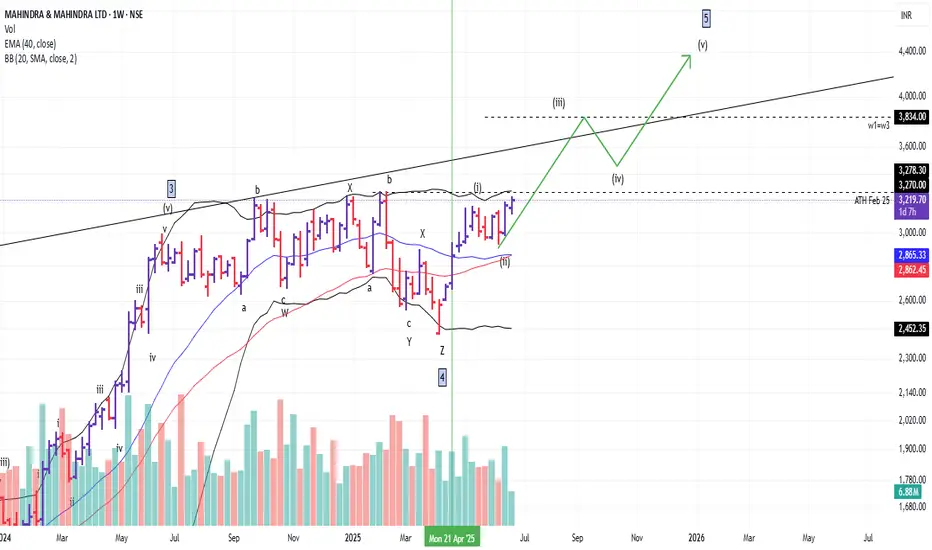
M&MM&M looks strong, if it sustains this price zone, there’s a good probability of an upside move.
The market structure is bullish, and price is trading above all key EMAs, supporting a continuation bias.
Keep it on your watchlist for paper trading.
✅ If you like my analysis, please follow me here as a token of appreciation :)
in.tradingview.com/u/SatpalS/
📌 For learning and educational purposes only, not a recommendation. Please consult your financial advisor before investing.

Mahindra & Mahindra's Inverse Head & Shoulders BreakoutMahindra & Mahindra's Inverse Head & Shoulders Breakout Signals Bullish Momentum with RSI Above 70
Mahindra & Mahindra Ltd. (M&M), currently trading around ₹3,648, is exhibiting a classic inverse head and shoulders pattern on its hourly chart—a bullish reversal setup that often precedes upward price movement. Coupled with a Relative Strength Index (RSI) reading above 70, the stock is showing signs of strong momentum, though traders must tread with technical precision.
With the inverse head and shoulders pattern completing and RSI above 70, Mahindra & Mahindra is technically poised for a bullish move. Traders should monitor price action closely, use disciplined stop-losses, and avoid over-leveraging. This setup favors momentum traders and short-term swing positions, especially if volume confirms the breakout.

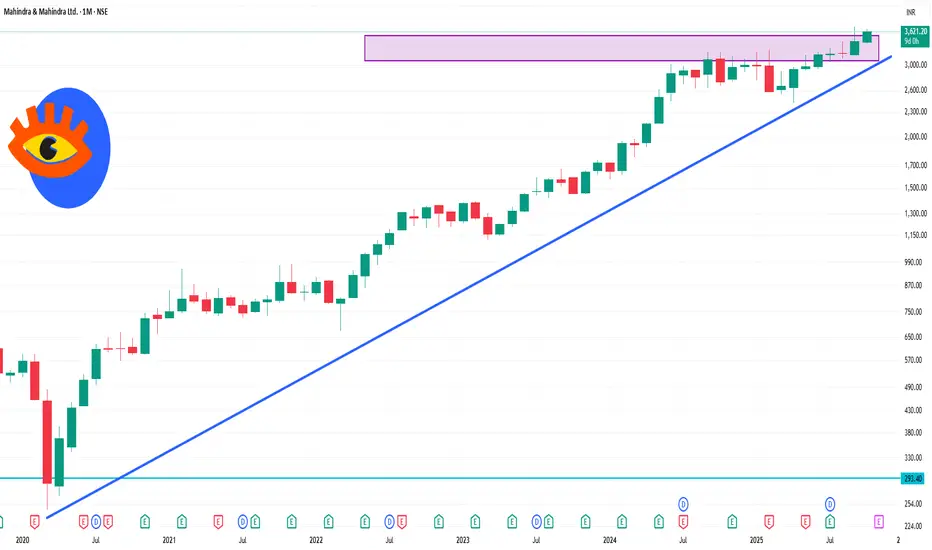
M&M 1 Month Time Frame 📊 Monthly Technical Overview
Current Price: ₹3,621.20
52-Week Range: ₹2,425.00 – ₹3,723.80
Recent High: ₹3,723.00 (September 9, 2025)
📈 Market Sentiment
The recent GST tax cut on SUVs with engines over 1500 cc has positively impacted Mahindra's sales, particularly for models like the Scorpio and XUV700. September 2025 saw a 10% year-on-year increase in SUV sales to dealers, and the first nine days of the Navratri festival recorded a more than 60% year-on-year sales increase.
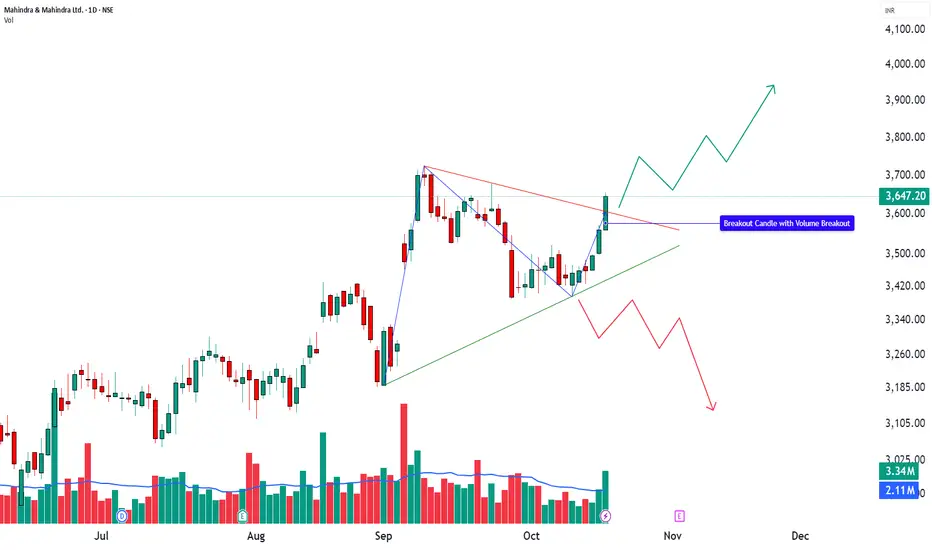
M&M Breaks Out with Volume Support | Structure Meets Momentum________________________________________
🚙 MAHINDRA & MAHINDRA LTD (NSE: M&M) | CMP ₹3,647.20 (+2.43%)
Sector: Auto | Date: 19 Oct 2025
________________________________________
🔹 Price Action:
M&M posted a strong bullish candle, closing near day’s high at ₹3,647.20 with gains of +2.43%.
Volume surged to 3.34M shares, nearly 2.2× the 20-day average volume (2.10M) — a clear sign of institutional and HNI participation.
The stock confirmed a bullish breakout above ₹3,656, marking a shift from a phase of consolidation to one of expansion.
________________________________________
🔹 Technical Analysis:
Momentum indicators are clearly aligned in favour of the bulls, confirming strength across multiple parameters. RSI (65.55) has broken above its midline, signalling momentum expansion, while MACD (9) shows a positive crossover that reinforces directional conviction. CCI (129.03) reflects sustained trend acceleration, and though Stochastic (96.65) remains in overbought territory, it supports ongoing breakout momentum. The VWAP at ₹3,629.84 acts as an immediate dynamic support, maintaining short-term control with buyers. Additionally, a Bollinger Band breakout accompanied by a BBSqueeze-Off indicates expanding volatility — often a precursor to a strong continuation phase when combined with rising volume and structural breakout confirmation.
________________________________________
🔹 Chart Analysis:
M&M broke out from a symmetrical triangle structure, ending a multi-week consolidation phase.
The breakout candle formed with a wide body and heavy volume, closing near the high — a typical sign of breakout conviction.
Price structure shows higher lows and rising volume, confirming trend continuation rather than exhaustion.
________________________________________
🔹 Key Levels:
Resistance: 3,682 / 3,717 / 3,778
Support: 3,586 / 3,525 / 3,490
VWAP: 3,629.84
A short-term pullback toward VWAP or ₹3,586 could act as a healthy retest before continuation.
Holding above ₹3,525 will keep the structure intact, maintaining bullish control.
________________________________________
🔹 STWP Trade Analysis:
Bias: Bullish
Breakout Level: ₹3,656
Intraday Support: ₹3,619
Swing Support: ₹3,456
Intermediate Support: ₹3,421
Momentum: Strong
Trend: Bullish
Risk: Low
Volume: High
📌 Observation: The breakout candle supported by rising volume and MACD confirmation signals a trend continuation setup with clearly defined risk zones.
________________________________________
🔹 HNI Trade Setup:
Fresh HNI accumulation seen around ₹3,647–₹3,656, supported at ₹3,501, and additional buying interest visible near ₹3,639 with support at ₹3,475.
This structure indicates layered accumulation, suggesting that larger players are positioning within the consolidation rather than chasing price above resistance.
________________________________________
🔹 Final Outlook:
Momentum: Strong | Trend: Bullish | Risk: Low | Volume: High
M&M’s structure indicates a breakout-driven continuation phase backed by volume and indicator alignment.
As long as price holds above ₹3,525, the trend bias remains bullish, with scope for upside toward ₹3,717–₹3,778 in the near term.
A dip toward VWAP or EMA supports would represent healthy price normalization, not weakness.
________________________________________
🔹 Learning Note (Educational Purpose):
This setup showcases how volume + structure + indicator confluence confirms a genuine breakout.
It also demonstrates how smart money accumulates during compression, not after expansion — a crucial lesson for breakout traders.
M&M provides a textbook example of how post-consolidation breakouts evolve into expansion phases.
________________________________________
🔹 STWP Mentor Note:
“Momentum isn’t about chasing; it’s about recognizing conviction early.
M&M’s breakout is a fine example of structure, participation, and patience working in perfect rhythm — where price doesn’t just move, it evolves with purpose.”
________________________________________
───────────────────────────────────────────────
⚠️ **DISCLOSURE & DISCLAIMER (SEBI-Compliant)**
───────────────────────────────────────────────
📘 **Purpose:**
This content is created **solely for educational and informational purposes** to help readers understand market structure, price action, and technical analysis.
It does **not constitute investment advice**, research recommendation, or a solicitation to buy or sell any security.
👤 **Author Disclosure:**
The author is **not a SEBI-registered investment adviser or research analyst.**
All chart studies, price levels, and observations are based on publicly available data (e.g., **NSE India**, **TradingView**) and are presented purely for **learning illustration**.
📊 **Position Status:**
No active position in * * at the time of publication.
“The author may sometimes trade in the securities discussed, but such trades are independent and shared here only for educational understanding.”
⚠️ **Risk Disclosure:**
Trading and investing involve financial risk. Market movements can be unpredictable, and losses may exceed invested capital.
Readers are strongly advised to consult a **SEBI-registered investment adviser** before making any trading or investment decisions.
🧠 **Responsibility Clause:**
By engaging with this post, you acknowledge that you are **solely responsible for your own trading or investment decisions**, and that this content is intended only for **market education and awareness**.
───────────────────────────────────────────────
💬 **Did You Find This Useful?**
If this analysis helped you understand price structure or market psychology better:
🔼 **Boost** to support transparent & structured financial education.
✍️ **Comment** your insights, observations, or questions — let’s learn together.
🔁 **Share** this post with learners and aspiring traders who value discipline.
📚 **Follow @STWP** for more structured, educational breakdowns on stocks & setups.
🚀 *Stay Calm. Stay Clean. Trade With Patience.*
💡 *Trade Smart | Learn Zones | Be Self-Reliant.*
───────────────────────────────────────────────
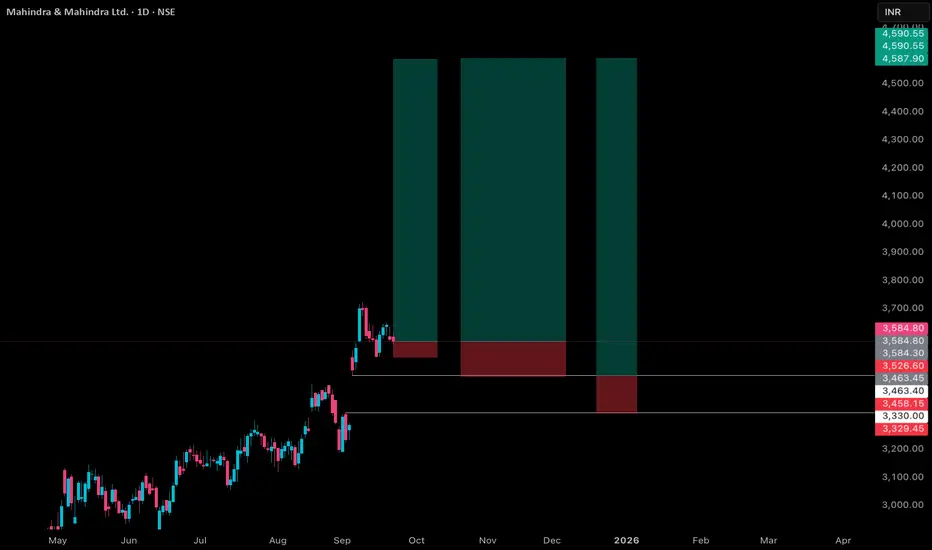
Mahindra & Mahindra Price ActionMahindra & Mahindra (M&M) closed today at ₹3,584.8, showing a slight decline of about 0.2% from the previous close. The stock traded in a range between ₹3,569 and ₹3,616 during the session, indicating sideways movement with moderate volatility. Despite the minor pullback, M&M remains well above its 50-day and 200-day moving averages, supporting its medium-term upward trend.
The stock exhibits strong fundamentals with an EPS of ₹122.13 and a price-to-earnings ratio near 29.35, reflecting reasonable valuation relative to its earnings. Return on capital employed (ROCE) stands around 13.9%, and the company has a consistent track record of delivering sales and profit growth at healthy compounded annual rates over recent years.
Key support levels to watch are ₹3,550 and ₹3,500, while resistance lies near the recent session high at ₹3,616 and extends toward the 52-week high vicinity near ₹3,724. Momentum indicators show mild consolidation, suggesting that a break above resistance could lead to renewed buying interest.
Overall, M&M is in a stable position with a constructive outlook, balancing between short-term consolidation and medium- to long-term targets driven by robust business performance and diversified presence across automotive and industrial segments.
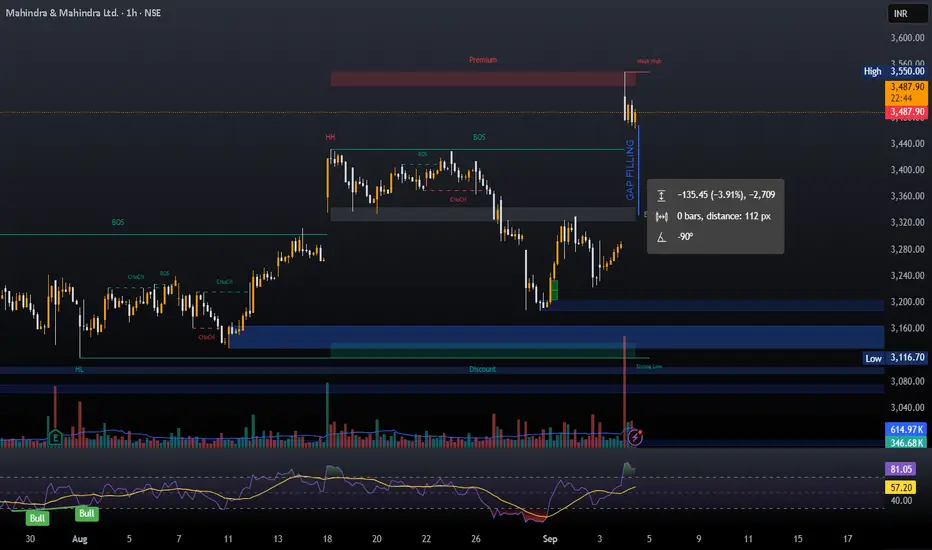
M&M ShortThe GST news has already been factored in and M&M was already trading at its al tie high. A gap up at all time high always gives an opportunity for a sell trade for the gap filling. One can look for sell in M&M with 3550 as resistance zone. Keep track of this chart and see if this concept works or not. Follow for more such concepts.
Jai Shree Ram.
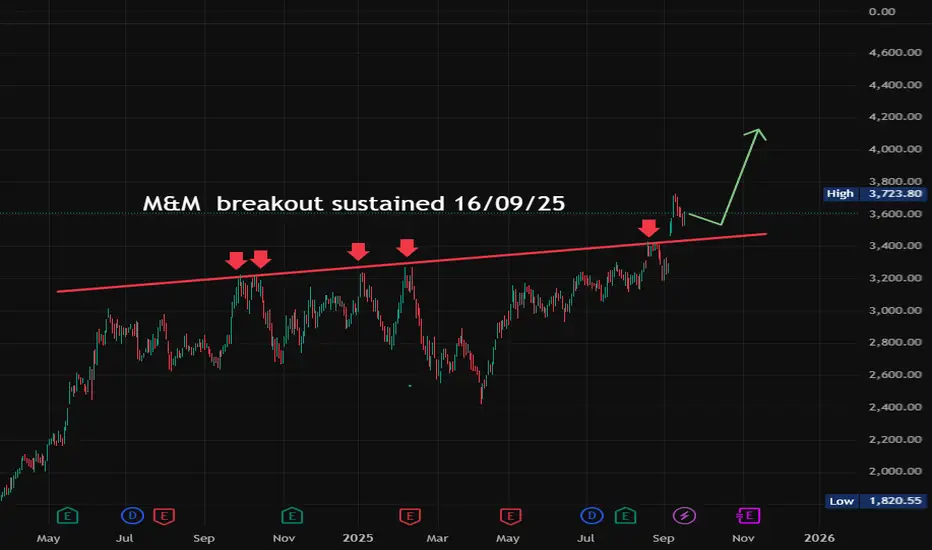
M&M breakout sustained 16/09/25Symbol : M&M , Exchange : NSE India M&M gap-up opened, broke the trend line, and after hitting strong resistance at that trend line on September 4, 2025, sustained successfully. The resistance line formed on September 30, 2024, was tested 5 times with price reversals each time. M&M's trend continues upward.
10 Most Powerful Candlestick Patterns Every Trader Must Know1. Doji – The Candle of Indecision
A Doji looks like a cross (+). This happens when the open and close price are almost the same.
What it means: Neither buyers nor sellers are in full control. Market is confused.
When it matters:
After a strong uptrend → could mean trend reversal (bears may take control).
After a strong downtrend → could mean bulls are coming back.
Types of Doji:
Standard Doji – neutral, just indecision.
Dragonfly Doji – long bottom shadow → buyers may soon dominate.
Gravestone Doji – long upper shadow → sellers may soon dominate.
Example: Imagine a stock rises for 7 days. On the 8th day, a Doji appears. This tells traders: “The rally may be slowing. Watch carefully.”
Tip: Doji alone is not enough. Always confirm with the next candle.
2. Hammer – A Bullish Reversal Signal
A Hammer looks like a hammer: a small body at the top with a long bottom shadow (at least 2x body size).
What it means: Sellers pushed the price down, but buyers fought back strongly and closed near the top. Bulls are gaining strength.
When it matters: Appears at the bottom of a downtrend, hinting at reversal.
Example: A stock keeps falling for 5 days. On the 6th day, a hammer forms near a support level. Next day, price rises. This confirms reversal.
Tip: Best when confirmed with high trading volume.
3. Inverted Hammer – A Hidden Bullish Clue
The Inverted Hammer looks like an upside-down hammer (small body at bottom, long top shadow).
What it means: Buyers tried to push higher, sellers resisted, but buyers showed strength. Could mean downtrend is weakening.
When it matters: Appears at the end of a downtrend, often followed by bullish candles.
Example: After a long fall, an inverted hammer forms. Next day, a strong green candle appears. This often signals a reversal.
Tip: Always wait for the next candle confirmation.
4. Shooting Star – The Bearish Reversal
The Shooting Star is the opposite of the Inverted Hammer, but it appears after an uptrend.
What it means: Buyers tried to push higher, but sellers pushed the price back down. Bears are taking over.
When it matters: Appears at the top of an uptrend, often signaling reversal.
Example: A stock keeps rising. Then a shooting star forms. Next day, a red candle follows → bearish reversal confirmed.
Tip: Stronger if it forms near resistance levels.
5. Bullish Engulfing – Buyers Take Control
The Bullish Engulfing is a two-candle pattern. A small red candle is followed by a larger green candle that engulfs it completely.
What it means: Buyers are now stronger than sellers.
When it matters: Appears after a downtrend, signaling reversal to the upside.
Example: A stock keeps falling. Then a small red candle is followed by a big green one. Price often rises further.
Tip: The bigger the green candle, the stronger the signal.
6. Bearish Engulfing – Sellers Dominate
The Bearish Engulfing is the opposite of Bullish Engulfing. A small green candle is followed by a big red candle that engulfs it.
What it means: Sellers have taken control.
When it matters: Appears after an uptrend, signaling possible reversal.
Example: A stock rises for 10 days. Then a small green candle is swallowed by a big red candle. Often, this is the start of a decline.
Tip: Stronger near resistance zones.
7. Morning Star – A Strong Bullish Reversal
The Morning Star is a three-candle pattern:
Large red candle.
Small candle (red or green, showing indecision).
Large green candle closing above the midpoint of the first red candle.
What it means: Sellers are losing control, buyers are coming back strong.
When it matters: Appears at the bottom of a downtrend.
Example: A stock keeps falling. Then a red candle, a doji, and a strong green candle appear. Trend reverses upward.
Tip: Works best with high volume on the third candle.
8. Evening Star – The Bearish Counterpart
The Evening Star is the opposite of Morning Star:
Large green candle.
Small candle (indecision).
Large red candle closing below the midpoint of the first green candle.
What it means: Buyers are exhausted, sellers are taking control.
When it matters: Appears at the top of an uptrend.
Example: Stock rises for days, then a green candle, a doji, and a big red candle form. Often, this signals a bearish trend.
Tip: Stronger when seen near resistance.
9. Harami – The Subtle Warning
A Harami is when a small candle forms inside the body of the previous candle.
Bullish Harami: Small green inside large red → sellers weakening.
Bearish Harami: Small red inside large green → buyers weakening.
What it means: Trend may be slowing down. Could signal reversal or pause.
When it matters: Works best when combined with support/resistance zones.
Example: After a long rally, a large green candle appears. Next day, a small red candle forms inside it → bearish harami. Price may fall next.
Tip: Always wait for the next candle for confirmation.
10. Three White Soldiers & Three Black Crows
These are powerful multi-candle patterns.
Three White Soldiers: 3 strong green candles in a row, each closing higher.
Meaning: Strong bullish momentum.
Context: After a downtrend → reversal upward.
Three Black Crows: 3 strong red candles in a row, each closing lower.
Meaning: Strong bearish momentum.
Context: After an uptrend → reversal downward.
Example: After a fall, three green candles appear → bulls taking over.
Tip: Be cautious of overbought/oversold levels.
How to Use These Patterns in Real Trading
Candlestick patterns are powerful, but they are not magic. Here’s how to use them properly:
Combine with Support & Resistance – Patterns near key zones are stronger.
Check Volume – Higher volume makes signals more reliable.
Look at Bigger Timeframes – A pattern on daily charts is more powerful than on 5-minute charts.
Use Indicators Together – Combine with RSI, MACD, or Moving Averages.
Risk Management – Always use stop-loss. Patterns can fail.
Common Mistakes to Avoid
Trading only based on one pattern.
Ignoring overall market trend.
Not waiting for confirmation.
Forgetting volume analysis.
Overtrading every signal.
Conclusion
Candlestick patterns are the language of the market. If you learn to read them, you can understand what buyers and sellers are planning.
The 10 most powerful patterns — Doji, Hammer, Inverted Hammer, Shooting Star, Bullish Engulfing, Bearish Engulfing, Morning Star, Evening Star, Harami, and Three Soldiers/Three Crows — are essential for any trader.
They don’t guarantee profits, but when combined with support/resistance, volume, and indicators, they become a strong weapon in trading.
Remember: trading is about probabilities, not certainties. Candlesticks help tilt the odds in your favor.
A simple Shorting Opportunity in Mahindra & MahindraMahindra & Mahindra has been consolidating under a triangular Pattern, which has given break down.
It can go down further as per the width of the triangle.
Please refer chart for more details.

Any correction is a buying opportunityM&M CMP 3696
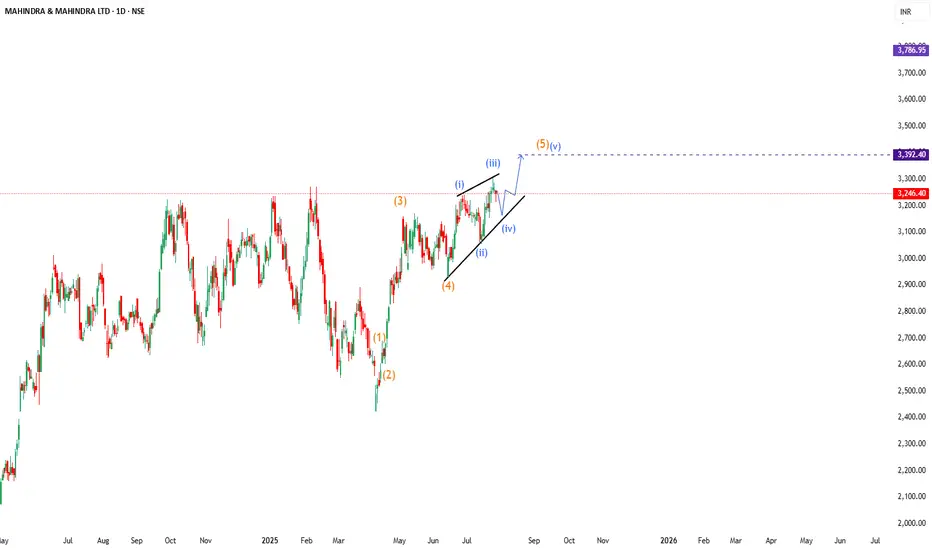
Elliott- The stock has reached its first resistance at 3735. A three wave correction should happen from here. Which will again be a buying opportunity. AS the next tgt is at 4200 and then the final tgt of 4600.
Fibs- the correction to 50% at 2416 from a higher swing is strength.

Currency Trading (Forex Trading)1. Introduction to Currency Trading
Currency trading, also called foreign exchange trading or forex trading, is the global marketplace where national currencies are bought and sold against each other. It is the largest and most liquid financial market in the world, with a daily trading volume exceeding $7 trillion (according to BIS 2022 report).
Unlike stock markets, which operate in specific exchanges (like the NYSE or NSE), forex is a decentralized market that operates 24 hours a day, five days a week, spanning across global financial hubs: Sydney, Tokyo, London, and New York.
The main purpose of forex trading is:
Facilitating international trade and investment – businesses need currency exchange.
Speculation and profit-making – traders attempt to profit from price fluctuations.
Hedging – corporations and investors manage currency risk.
2. History of Currency Trading
To understand modern forex, let’s go back in time:
Gold Standard Era (1870s – 1914): Currencies were pegged to gold. Stable but restrictive.
Bretton Woods System (1944 – 1971): Post-WWII, the US dollar was pegged to gold, and other currencies were pegged to the dollar. This system collapsed in 1971 when the US ended gold convertibility.
Free-Floating Exchange Rates (1971 onwards): Major currencies started floating freely, driven by supply and demand.
Digital and Online Forex (1990s – present): With the internet and trading platforms, forex became accessible to retail traders worldwide.
Today, forex is a technology-driven global marketplace where even small investors can trade currencies with a click.
3. Basics of Currency Pairs
Currencies are traded in pairs, since one currency is exchanged for another.
Example: EUR/USD = 1.1000
This means 1 Euro = 1.10 US Dollars.
If you think the Euro will strengthen, you buy EUR/USD.
If you think the Euro will weaken, you sell EUR/USD.
Categories of Currency Pairs:
Major Pairs: Most traded, always include the USD (e.g., EUR/USD, GBP/USD, USD/JPY).
Minor Pairs (Crosses): Don’t include USD (e.g., EUR/GBP, AUD/NZD).
Exotic Pairs: Combine a major currency with one from an emerging economy (e.g., USD/INR, EUR/TRY).
4. How the Forex Market Works
Forex operates on an OTC (Over-the-Counter) model – no central exchange. Instead, it works via a network of:
Banks & Central Banks (liquidity providers).
Hedge Funds, Corporations, and Governments (large participants).
Retail Brokers who provide platforms for individuals.
Market Sessions:
Sydney Session: Opens the week, low liquidity.
Tokyo Session: Active Asian trading.
London Session: Very liquid, overlaps with Asia and US.
New York Session: High volatility, overlaps with London.
Because of these time zones, the forex market is effectively open 24/5.
5. Key Players in Currency Trading
Central Banks: Control money supply and interest rates, e.g., US Federal Reserve, ECB, RBI.
Commercial Banks: Provide liquidity, facilitate global trade.
Hedge Funds & Institutions: Speculate with billions of dollars.
Corporations: Hedge currency risk for imports/exports.
Retail Traders: Individuals trading via brokers.
6. Why Do People Trade Currencies?
Speculation: Profit from price changes.
Hedging: Protect against currency fluctuations.
Diversification: Alternative to stocks and commodities.
Accessibility: Low entry cost, leverage availability.
7. Key Concepts in Forex Trading
(a) Bid & Ask Price
Bid Price: Price at which market buys from you.
Ask Price: Price at which market sells to you.
Spread: Difference between bid and ask (broker’s fee).
(b) Pips & Lots
Pip (Percentage in Point): Smallest price movement (e.g., 0.0001 in EUR/USD).
Lot: Standard unit of trading (100,000 units of base currency).
Standard Lot = 100,000
Mini Lot = 10,000
Micro Lot = 1,000
(c) Leverage & Margin
Leverage: Allows traders to control large positions with small capital (e.g., 1:100).
Margin: Deposit required to open a leveraged trade.
(d) Long & Short Positions
Long (Buy): Betting on currency appreciation.
Short (Sell): Betting on currency depreciation.
8. Fundamental Analysis in Forex
Fundamental analysis examines economic, political, and financial factors that influence currencies.
Key Drivers:
Interest Rates: Higher rates attract capital → stronger currency.
Inflation: High inflation → weaker currency.
GDP Growth: Strong economy → strong currency.
Employment Data: (e.g., US Non-Farm Payrolls).
Trade Balance: Surplus strengthens currency, deficit weakens it.
Geopolitics: Wars, elections, policy shifts affect currencies.
Example: If the US Federal Reserve raises interest rates, the USD often strengthens.
9. Technical Analysis in Forex
Traders also rely on charts and indicators to predict price moves.
Common Tools:
Candlestick Patterns: e.g., Doji, Engulfing.
Support & Resistance Levels.
Trendlines & Channels.
Indicators: Moving Averages, RSI, MACD, Bollinger Bands.
Chart Patterns: Head & Shoulders, Triangles, Flags.
Technical analysis helps traders time entries and exits more precisely.
10. Types of Currency Trading
(a) Spot Trading
Immediate exchange of currencies at current market price.
Most common type for retail traders.
(b) Forward Contracts
Agreement to exchange currency at a future date, fixed rate.
Used for hedging.
(c) Futures Contracts
Standardized contracts traded on exchanges (e.g., CME).
Regulated and transparent.
(d) Options
Right (but not obligation) to buy/sell currency at a set price.
Used for hedging and speculation.
(e) CFDs (Contracts for Difference)
Popular in retail forex.
No physical delivery of currency, only speculation on price changes.
Conclusion
Currency trading is a dynamic, global, and highly liquid market that offers immense opportunities and risks. It plays a vital role in the global economy by enabling trade, investment, and financial stability.
For traders, success in forex requires:
Solid understanding of fundamentals and technicals.
Strict risk management.
Strong psychological discipline.
While the potential rewards are high, forex trading is not a shortcut to riches. It’s a skill-based profession that requires patience, practice, and continuous learning.

M&M FLAG PATTERN BREAKOUTM&M Breaking flag pattern on daily chart
with huge volume,good volume building last week
MACD crossover done
RSI bullish around 70
trading above 20 ema
target1 3600 target2 4000
retest level around 3300,sl 3050
DO YOUR OWN ANALYSIS BEFORE INVESTING

M&M Bullish ViewProbability of M&M making fresh highs in wave 5. wave 3 of wave 5 is likely to start. Targets as shown in path
Divergence SecretsOption Trading in India
India has seen a boom in retail options trading.
1. Exchanges
NSE (National Stock Exchange): Leader in index & stock options.
BSE (Bombay Stock Exchange): Smaller but growing.
2. Popular Underlyings
Nifty 50 Options (most liquid).
Bank Nifty Options (very volatile).
Stock Options (Infosys, Reliance, HDFC Bank, etc.).
3. SEBI Regulations
Compulsory margin requirements.
Weekly index expiries (Thursday).
Physical settlement of stock options at expiry.
Option trading is a double-edged sword. It can create wealth through leverage, hedging, and smart strategies. But it can also destroy capital if misused without understanding risks.
The secret is balance:
Learn the basics.
Practice with small positions.
Respect risk management.
Master volatility and Greeks.
If stocks are like playing cricket, options are like playing 3D chess—complex, dynamic, but highly rewarding for disciplined traders.

M&M (Mahindra & Mahindra)It's been a while since M&M is testing this resistance.
Looking strong, moving above key EMAs, good volume, continuously contracting near the resistance. If it sustains this level then it may give a good upside move.
Keep eyes on it.
Must use SL, it always safeguard your Capital.
✅ If you like my analysis, please follow me as a token of appreciation :)
in.tradingview.com/u/SatpalS/
📌 For learning and educational purposes only, not a recommendation. Please consult your financial advisor before investing.
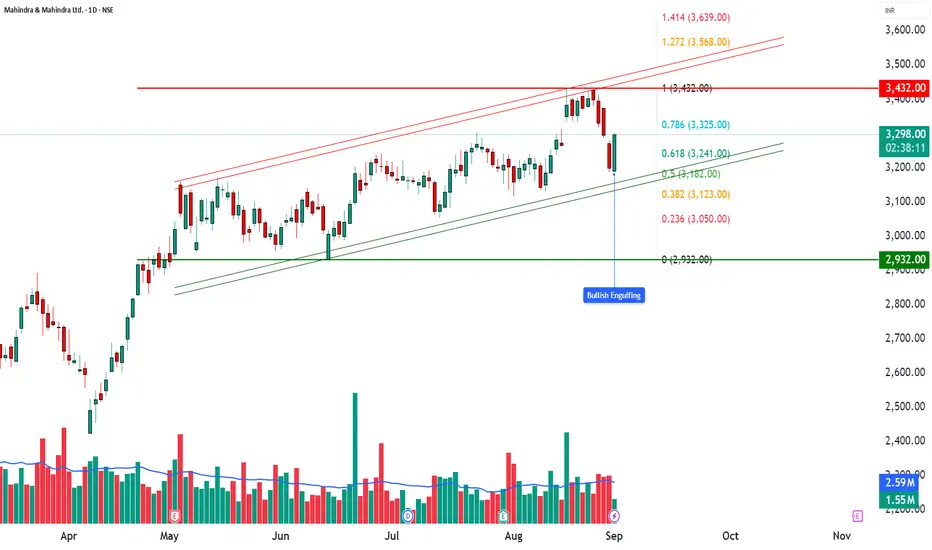
M&M | How to Trade a Bullish Engulfing in a Rising Channel🚘 M&M | How to Trade a Bullish Engulfing in a Rising Channel
📊 Stock: Mahindra & Mahindra Ltd (M&M)
⏳ Timeframe: Daily
📈 Chart Pattern: Rising Channel
🕯 Candlestick Pattern: Bullish Engulfing
________________________________________
🔹 Pattern Overview
M&M is currently trading within a Rising Channel, a structure that often reflects sustained bullish momentum. On the latest daily chart, a Bullish Engulfing candlestick has been formed, signaling renewed buying interest after a brief phase of consolidation.
________________________________________
The setup looks stronger with a Bullish Marubozu and an Open = Low candle, showing aggressive demand from the open. Price is holding well above VWAP, confirming bullish bias. A BB Squeeze Off signals volatility expansion ahead, while the recent false breakdown indicates sellers got trapped and buyers are back in control.
________________________________________
🔹 Key Levels to Watch
Resistance Zones: 3335 – 3374 – 3445
Support Zones: 3224 – 3152 – 3113
________________________________________
🔹 Technical Indicators Snapshot
RSI is at 52, sitting in the neutral zone but leaving room for upside momentum if buying picks up. The MACD shows a bearish crossover, which is an early caution signal to watch. CCI at -14 indicates neutral sentiment with no strong bias, while Stochastic at 55 is mid-range, suggesting neither overbought nor oversold conditions at the moment.
________________________________________
🔹 Candle Analysis
Candle 1 (Yesterday): High 3280 | Low 3187
Candle 2 (Today): High 3302.10 | Low 3191.10
👉 The today’s candle engulfed the previous session’s body, confirming the Bullish Engulfing pattern.
________________________________________
🔹 Trading View (Educational Insight Only)
A Bullish Engulfing inside a Rising Channel generally indicates continuation of the prevailing uptrend. If price manages to probably sustain above the 3335–3374 zone, it may signal strength for further upside. On the other hand, if the stock probably slips below the 3224–3152 support zone, it could lead to short-term profit booking.
________________________________________
📌 “All price levels mentioned are as observed at the time of writing and may change with market movements. Readers are advised to track live prices before making any trading or investment decision.”
⚠️ Disclaimer – Please Read Carefully
The information shared here is meant purely for learning and awareness. It is not a buy or sell recommendation and should not be taken as investment advice. I am not a SEBI-registered investment advisor, and all views expressed are based on personal study, chart patterns, and publicly available market data.
Trading — whether in stocks or options — carries risk. Markets can move unexpectedly, and losses can sometimes exceed the money you have invested. Past performance or past setups do not guarantee future results.
If you are a beginner, treat this as a guide to understand how the market works — practice on paper trades before risking real money. If you are experienced, always assess your own risk, position sizing, and strategy suitability before entering trades.
Consult a SEBI-registered financial advisor before making any real trading decision. By engaging with this content, you acknowledge full responsibility for your trades and investments.
💬 Found this useful?
🔼 Give this post a Boost to help more traders discover clean, structured learning.
✍️ Drop your thoughts, questions, or setups in the comments — let’s grow together!
🔁 Share with fellow traders and beginners to spread awareness.
👉 “If you liked this breakdown, follow for more clean, structured setups with discipline at the core.”
🚀 Stay Calm. Stay Clean. Trade With Patience.
Trade Smart | Learn Zones | Be Self-Reliant 📊
GST Rate Cut and Its Impact on M&MGST Rate Cut Proposal: The Indian government is on the verge of reducing GST on cars, two-wheelers, three-wheelers, trucks, and buses from the current 28% down to 18%. The new recommendations seek to eliminate the 12% and 28% slabs, retaining only 5% (for essentials and EVs) and 18% for most internal combustion engine (ICE) vehicles. Luxury cars may have a new 40% bracket.
Projected Impact:
According to Nomura, this GST reduction could generate a “multiplier effect” on demand, resulting in a 10–15% increase in auto sales, with Mahindra & Mahindra and Maruti Suzuki positioned to benefit the most. Popular Mahindra models like the Bolero and XUV700 could see immediate price cuts (Bolero by approximately 10%, XUV700 by approximately 7%), thereby improving affordability and volume.
Anticipated margin improvement for OEMs like M&M could be as much as 1–1.5 percentage points if they maintain current discount structures after the tax cut; if the reductions are passed on, consumers benefit directly through price drops.
M&M Stock – GST Cue
GST Impact: The government is set to reduce GST on cars and SUVs from 28% to 18%, likely before Diwali 2025. This policy benefits Mahindra & Mahindra directly by lowering vehicle prices and potentially spurring demand.
Buying Price: M&M is consolidating near ₹3,375–₹3,385. Immediate supports are at ₹3,360 and ₹3,345—ideal zones for accumulation.
Target: With positive tax news and strong technical momentum, short- to medium-term upside targets are ₹3,500, ₹3,600, and possibly ₹4,000, if the uptrend continues
GST cuts are a strong fundamental trigger. Buying near ₹3,360–₹3,385 with a medium-term target of ₹3,500–₹3,600, and a stop loss below ₹3,320, is a favorable trading strategy for M&M amid these cues.
Disclaimer: lnkd.in
Wave Theory Applied , Ending Diagonal Pattern I have been Using Wave Theory for over a 20 Years in my Life and every time I see Patterns
which are logical & Self Explanatory I know what i am looking at ,
In this pattern Friends i see an Ideal pattern which ends the Motive wave after an strong
momentum in its prices ,
I have always said market repeat in itself , I wonder how people interoperation would be
This is education content if you have any Questions please feel free to comment below i will try
to explain
Good luck
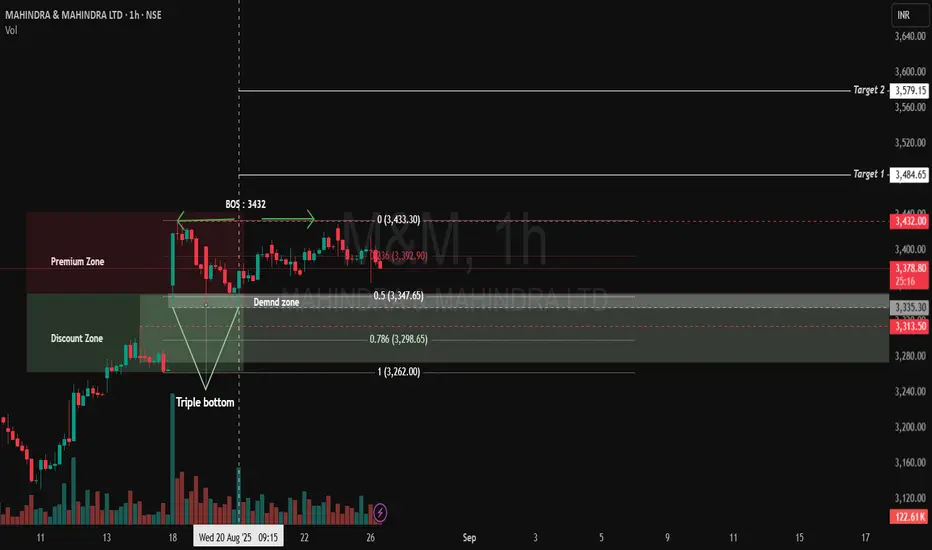
M&M Short term Swing trade with 1:3.5 RRIf Nifty holds its current level of 24,600 and is not bearish for next two-three trading sessions then
there are high chances that this setup will work and buyers will take control in M&M.
It is a supply & demand + Trend + Liquidity Trap based setup.
The setup looks good but the only concern is the overall market sentiment so take your risk accordingly.
Good Risk to Reward for first Target is 1:3.5
Let me know if you have any questions or doubts.
Happy to help!
Gaurav.

M&M _ Rising Wedge Formation📊 M&M – Technical & Educational Snapshot
Ticker: NSE: M&M | Sector: 🚙 Auto
CMP: ₹2,7XX (as of 16 Aug 2025)
Rating (for learning purpose): ⭐⭐⭐⭐
Pattern Observed: 📉 Rising Wedge Formation (Bearish Reversal Case Study)
🔑 Key Reference Levels (For Learning)
Support / Breakdown Zone: Lower wedge trendline
Resistance / Rejection Zone: Upper wedge trendline
Bearish Projection (Case Study): ~₹2,410
Bullish Continuation (Alternative View): ~₹3,300
📌 Pattern Observations
✅ Price forming higher highs & higher lows but within converging trendlines
✅ Momentum slowing → smaller swings inside wedge
✅ Typical bearish reversal structure (confirmation needed)
✅ Volume + RSI divergence can add conviction
📝 STWP Trade Analysis (Educational Illustration Only)
1️⃣ Bearish Breakdown (Primary Scenario)
Observation: Breakdown below wedge support often studied as bearish signal
Stop Loss (Learning Reference): Above upper wedge / recent swing high
Downside potential: ₹2,410 (measured move projection)
2️⃣ Bullish Breakout (Alternative Scenario)
Observation: Breakout above wedge resistance may lead to continuation
Stop Loss (Learning Reference): Below wedge / recent swing low
Upside potential: ₹3,300
📊 Risk Management & Confirmation
Traders typically wait for daily close outside wedge boundaries
Volume confirmation is key → spikes above average strengthen the move
RSI divergence often adds confidence to the setup
📌 Summary (Learning View Only)
The M&M Rising Wedge is a classic reversal study.
Key lesson: A wedge pattern teaches how slowing momentum can shift market control — but confirmation with volume + price close is essential before validating either direction.
⚠️ Disclaimer – Please Read Carefully
The information shared here is meant purely for learning and awareness. It is not a buy or sell recommendation and should not be taken as investment advice. I am not a SEBI-registered investment advisor, and all views expressed are based on personal study, chart patterns, and publicly available market data.
Trading — whether in stocks or options — carries risk. Markets can move unexpectedly, and losses can sometimes be larger than the money you have invested. Past performance or past setups do not guarantee future results.
If you are a beginner, treat this as a guide to understand how the market works — practice on paper trades before risking real money. If you are an experienced trader, remember to assess your own risk, position sizing, and strategy suitability before entering any trade.
Consult a SEBI-registered financial advisor before making any real trading decision.
By reading, watching, or engaging with this content, you acknowledge that you take full responsibility for your own trades and investments.
________________________________________
💬 Found this useful?
🔼 Give this post a Boost to help more traders discover clean, structured learning.
✍️ Drop your thoughts, questions, or setups in the comments — let’s grow together!
🔁 Share with fellow traders and beginners to spread awareness.
✅ Follow simpletradewithpatience for beginner-friendly setups, price action insights & disciplined trading content.
🚀 Stay Calm. Stay Clean. Trade With Patience.
Trade Smart | Learn Zones | Be Self-Reliant 📊
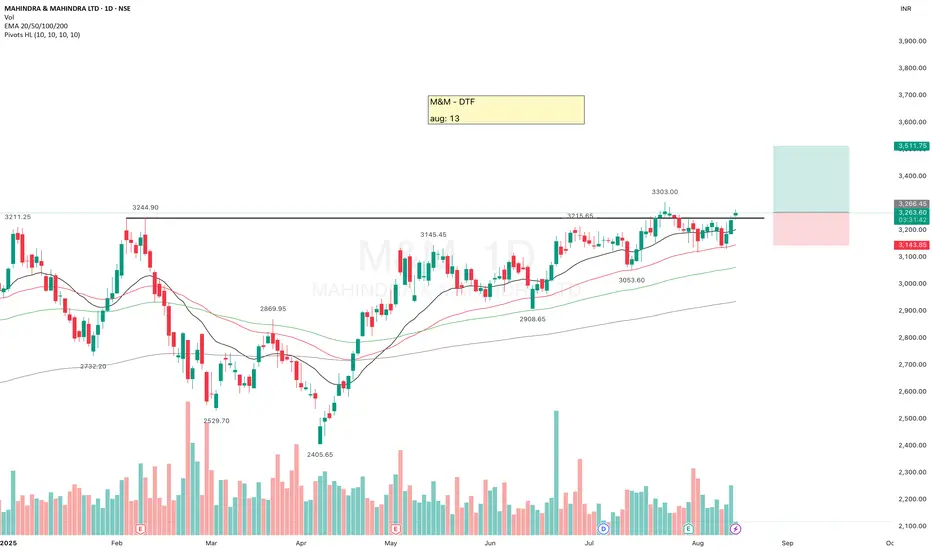
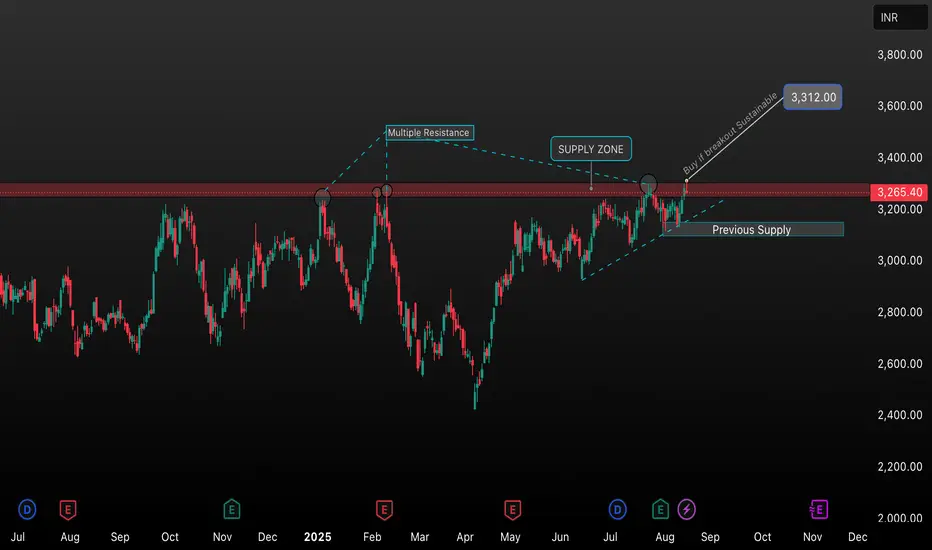
M&M Key Resistance Breakout – Supply Zone AnalysisThis chart highlights the crucial price action of M&M around the 3,265–3,300 INR supply zone. The region has acted as multiple resistance points in the past, making it a significant barrier for bulls. The current move shows a potential breakout above this supply zone, with a breakout target projected towards 3,312 INR. Traders should watch for a sustained close above this level for possible long opportunities. The previous supply now turns into a potential support level, strengthening the bullish bias if retested successfully.
Key Levels:
• Resistance/Supply Zone: 3,265–3,300 INR
• Breakout Target: 3,312 INR
• Support (Previous Supply): Around 3,200 INR
Trading Plan:
Wait for confirmation of a sustained breakout above the supply zone. If the price holds above, consider a buy entry targeting 3,312 with a stop loss below the previous supply.
Feel free to edit/shorten this for your specific style or requirements!
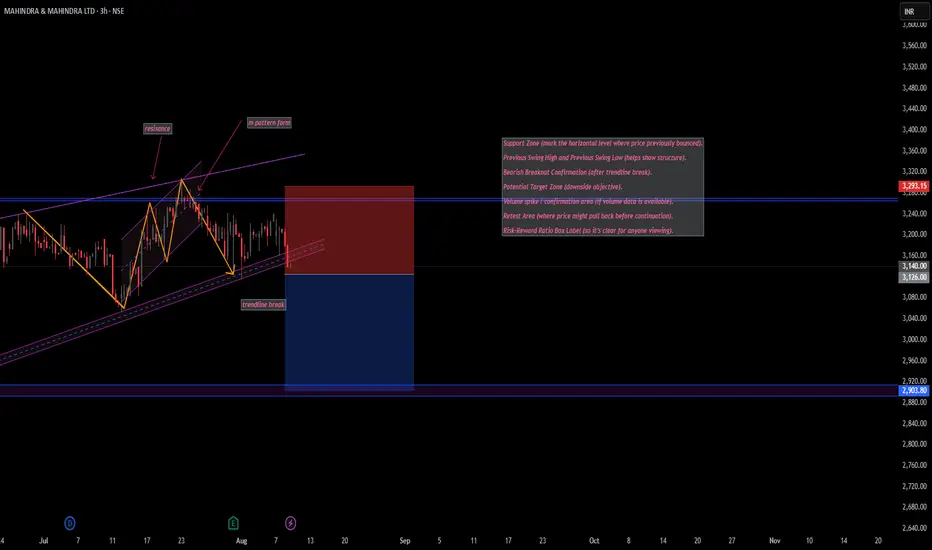
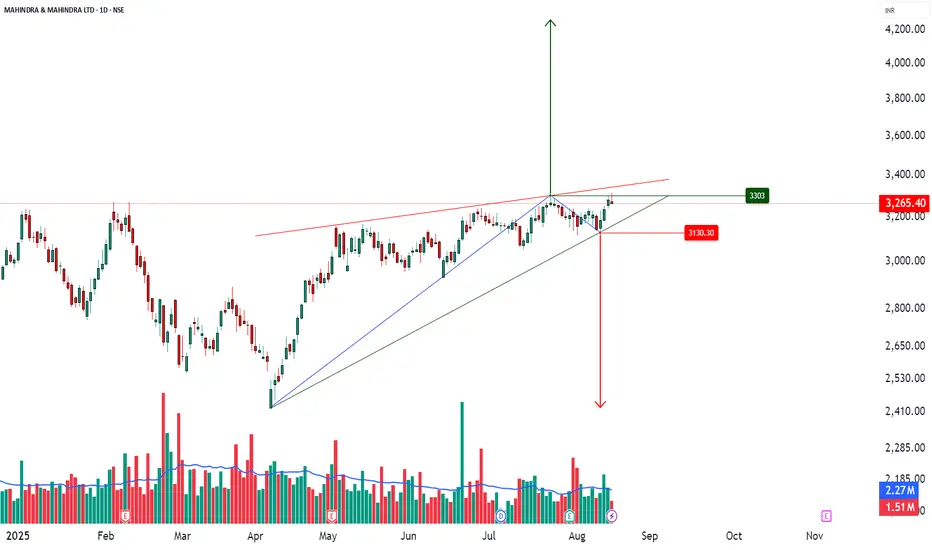
Mahindra & Mahindra – Trendline Breakout Signals Potential Downs📉 Mahindra & Mahindra – Bearish Setup Analysis
Pattern Formation: A clear M pattern has formed near the major resistance zone around ₹3,293, indicating potential trend exhaustion.
Trendline Break: Price has decisively broken the rising trendline, signaling a shift from bullish to bearish momentum.
Support Zone: Next strong support lies near ₹2,903, which is also the target zone based on the M pattern breakdown.
Risk–Reward: Short entry considered around ₹3,140 with stop-loss above ₹3,293 (resistance zone) and target near ₹2,903 offers a favorable R:R setup.
Market Structure: Recent lower highs and lower lows after the M pattern support the bearish bias.
Confirmation: Watch for a possible pullback/retest towards the broken trendline before further downside movement.
Summary:
If the breakdown sustains below the trendline, M&M could see further downside towards ₹2,903. A failed breakdown (price closing back above ₹3,200) would invalidate this bearish setup.