Reliance Industries Ltd. - Stock AnalysisDate : 30-Nov-2025
LTP : Rs. 1,567.50
Technical View:
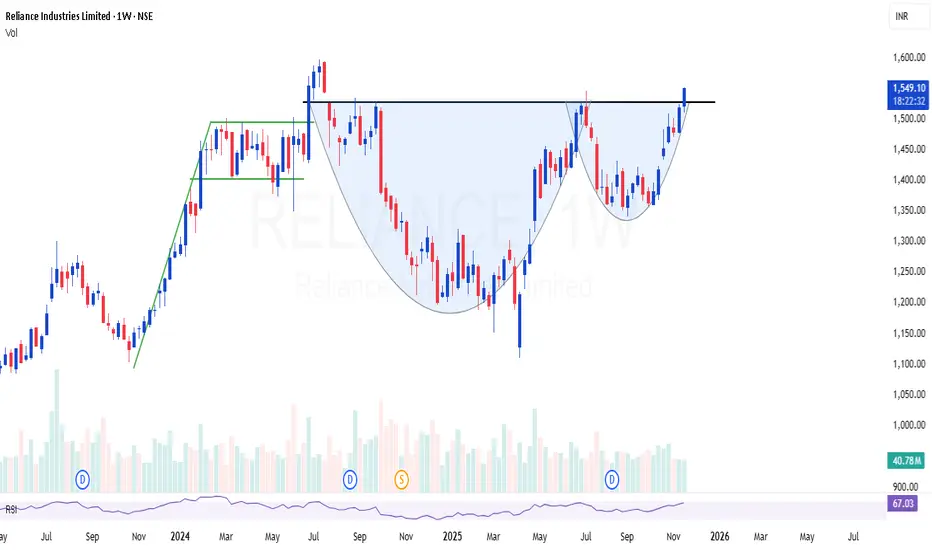
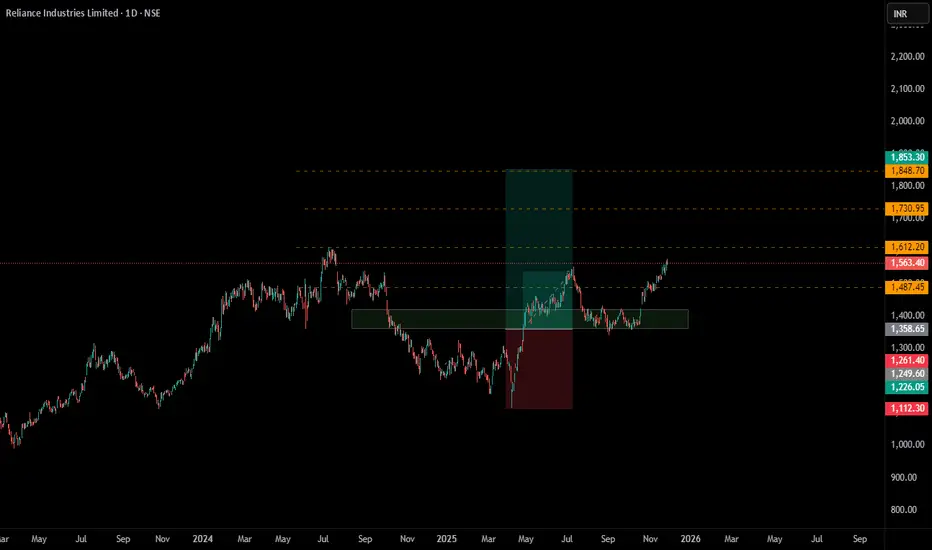
• NSE:RELIANCE is in primary uptrend since Apr 2025 and currently trading through it's secondary uptrend since 16-Oct-2025.
• After touching the high of 1,551 on 9-Jul-2025, it has retraced 14% to 1,340.60 level.
• NSE:RELIANCE has formed a Rounding Bottom Pattern and has breakout from it's neckline with higher than average volume on 26-Nov-2025. The Rounding Bottom Neckline is marked as 1st Resistance (R1) in chart and is placed at 1,551.
• NSE:RELIANCE is trading above 20 DEMA and 50 DEMA since last few weeks.
• MACD is trading at 30.91 and RSI is trading at 72.71.
• NSE:RELIANCE is looking bullish from here onwards.
• Resistance Levels: (R2) Rs. 1,608 --> (R3) Rs. 1,680 --> (R4) Rs. 1760
• Support Level: Rs. 1,461
If you have liked this analysis, please Like/Boost this idea and follow me for more ideas.
Disclaimer : I am not a SEBI registered analyst/consultant and not recommending anyone to take any BUY or SELL position in stock market. Investing in stock market is risky and one should do a self analysis and validation before investing in stock market. My ideas are published for learning purpose only and are available to everyone at no cost/charge.
Trade ideas

Reliance Industries Price Action Projection for Dec 2025This projection is made on the basis of Andrews Pitchfork Tool
It helps projecting the price targets.
I have taken 1300 as the starting point as this was the breakout in April. Price went on to make a higher high of 1542 in July. It and made a higher low 1375 by mid-october.
The projections are made as per intersection of vertical green arrow with pitchfork for knowing the probable targets.
Keep SL of 5 points below the pullback support & major suport shown.
Happy trading!

Algorithmic and Momentum Trading Rising1. What Is Algorithmic Trading?
Algorithmic trading (or algo-trading) refers to using computer-coded rules to automate buying and selling of financial assets. These rules can be based on price, volume, statistical models, timing, or complex machine-learning algorithms.
Key characteristics include:
Speed: Orders are executed in microseconds.
Consistency: Trades follow predefined rules, removing psychological biases.
Scalability: Algorithms can execute thousands of trades across multiple exchanges simultaneously.
Cost efficiency: Minimizes impact cost, slippage, and human error.
Algo-trading today accounts for 50–70% of equity trades in developed markets and is growing rapidly in emerging markets such as India.
2. Momentum Trading as a Subset
Momentum trading is a strategy that capitalizes on price continuation—the idea that assets that have been rising tend to continue rising, and those falling often continue falling.
Momentum algos typically look for:
Strength or weakness in price trends
Breakouts above resistance or breakdowns below support
Relative strength vs. benchmark
Volume surges
Volatility expansion
Trend acceleration
Because momentum signals can be quantified mathematically, they are ideal for automation. This has made momentum algos a core part of many funds, including quant funds, hedge funds, and proprietary trading desks.
3. Why Algorithmic and Momentum Trading Are Growing
A. Explosion in Computing Power
Advances in processing speed and cloud computing make it easy to run complex models and execute trades at lightning speeds. What once required supercomputers can now be done on commercial servers.
B. Availability of Big Data
High-frequency tick data, order book depth, alternative data, social sentiment, and satellite imagery have become widely accessible. Algorithms thrive on such datasets.
C. Lower Transaction Costs
Brokerage fees, exchange fees, and data costs have decreased. Automation reduces human labour cost, making quant trading highly economical.
D. Rise of Quant Funds
Hedge funds like AQR, Renaissance Technologies, D.E. Shaw, and others have popularized quantitative and momentum-driven strategies. Many smaller funds now replicate similar frameworks.
E. Regulatory Push
Many regulators promote transparency and electronic trading (e.g., India’s NSE/BSE). New platforms and API-based access encourage algorithmic participation.
F. Growth of Retail APIs
Retail traders increasingly use brokers offering:
Kite Connect
Interactive Brokers API
Upstox API
TD Ameritrade API
This democratises algorithmic execution, once available only to institutions.
4. How Algorithmic and Momentum Trading Work
Step 1: Signal Generation
The algorithm identifies opportunities using rules such as:
20-DMA crossing 50-DMA
RSI crossing above 60
Price breaking above 200-day high
VWAP deviations
Regression-based predictions
Machine learning-based forecasts
Step 2: Position Sizing
The algo determines how much to buy or sell based on:
Account equity
Risk limits
Stop loss placement
Market volatility
Portfolio exposure
Step 3: Execution Algorithms
These algorithms break orders into smaller parts and execute optimally:
VWAP (Volume Weighted Average Price)
TWAP (Time Weighted Average Price)
POV (Percentage of Volume)
Smart order routing across exchanges
Step 4: Risk Management
Algo trading uses automatic controls such as:
Dynamic stop loss
Max daily drawdown
Volatility filtering
Circuit breaker detection
Reversion flags
Step 5: Trade Exit
Momentum strategies exit when:
Trend weakens
Price hits stop loss or target
Reversal signals appear
Momentum score declines
5. Market Impact of Rising Algo and Momentum Trading
A. Improved Liquidity
Algorithms supply continuous buying and selling volumes, narrowing bid-ask spreads. High-frequency market makers especially contribute to deep order books.
B. Faster Price Discovery
Information is absorbed into prices almost instantly because algos constantly react to new data. Markets become more efficient.
C. Increased Short-Term Volatility
While overall efficiency improves, short bursts of volatility—often triggered by momentum algos—can cause rapid market swings. Examples include:
Flash crashes
Sudden spikes during economic data releases
Momentum cascades
D. Herd Behaviour
Many momentum algorithms follow similar market signals (e.g., breakout, trend following). When they activate simultaneously, they may amplify trends.
E. Reduced Human Discretion
Traditional discretionary traders are increasingly replaced by quant models. Human-executed trades are slower, costlier, and often less accurate.
6. Advantages of Momentum and Algorithmic Trading
1. Discipline and Removal of Emotions
Algorithms follow rules precisely, avoiding psychological biases like fear, greed, and impulsiveness.
2. Backtesting and Optimization
Strategies can be validated on historical data before deployment, reducing risks of poor performance.
3. Ability to Trade Multiple Markets
A single algorithm can trade:
Equity
Futures
Commodities
FX
Crypto
Global indices
simultaneously.
4. Speed and Precision
Algorithms can react to micro-changes in price faster than any human.
5. Increased Profit Potential
Momentum strategies excel in trending markets and can capture large directional moves with speed and accuracy.
7. Challenges and Risks
Despite its advantages, algorithmic and momentum trading face significant risks.
A. Over-Optimization
Strategies that are fine-tuned on past data may fail in real markets (“curve-fitting”).
B. Market Structure Dependence
Momentum strategies often struggle in:
Sideways markets
Sudden reversals
High-volatility whipsaws
C. Technology Risk
Server failure, broker downtime, API issues, or hardware malfunction can lead to significant losses.
D. Liquidity Shocks
When multiple momentum strategies unwind simultaneously, they can cause rapid market collapse.
E. Regulatory Scrutiny
Regulators monitor algos for:
Spoofing
Layering
Excessive order modifications
Market manipulation
F. Competition
As more traders adopt similar strategies, profit margins decrease (“alpha decay”).
8. The Future of Algorithmic and Momentum Trading
The next stage of evolution will be driven by:
1. Artificial Intelligence & Deep Learning
AI models learn complex, non-linear patterns beyond traditional momentum indicators.
2. Alternative Data
Satellite images, IoT sensors, credit card spending patterns, and sentiment analysis are increasingly used for momentum prediction.
3. Autonomous Trading Systems
Systems capable of adapting and evolving in real-time without manual input will dominate high-frequency markets.
4. Retail Algo Revolution
With easy API access, retail algo adoption is accelerating, especially in markets like India, the US, and Europe.
5. Integration with Options & Derivatives
Momentum algos are moving into options-based volatility strategies, hedging models, and automated spreads.
Conclusion
Algorithmic and momentum trading are rapidly reshaping global financial markets. They provide speed, efficiency, precision, and scalability that human traders cannot match. While they improve liquidity and price discovery, they also introduce new challenges such as flash crashes, herd behaviour, and technological risks.
As technology continues to evolve—through AI, big data, and cloud computing—algorithmic trading will become even more dominant. Momentum strategies, supported by sophisticated analytics and automation, are likely to remain one of the most powerful and widely used trading approaches in the modern financial landscape.
Reliance is breaking out for huge upside targetsReliance has made a Cup and Handle pattern
Recently Reliance has given the breakout and tragets of cup and handle is coming 1900-2000
Reliance is also in 3rd wave of elliott wave
Thank You !

RELIANCE LONG TRADETRADE SETUP: Reliance long trade on weekly time frame
Logic: Reliance is in continous uptrend, a dip to the marked weekly level around 1500 can be seen as opportunity to buy.
If taken in futures during entry consider entering in far month expiry.
Maintain stoploss as marked and position sizing.

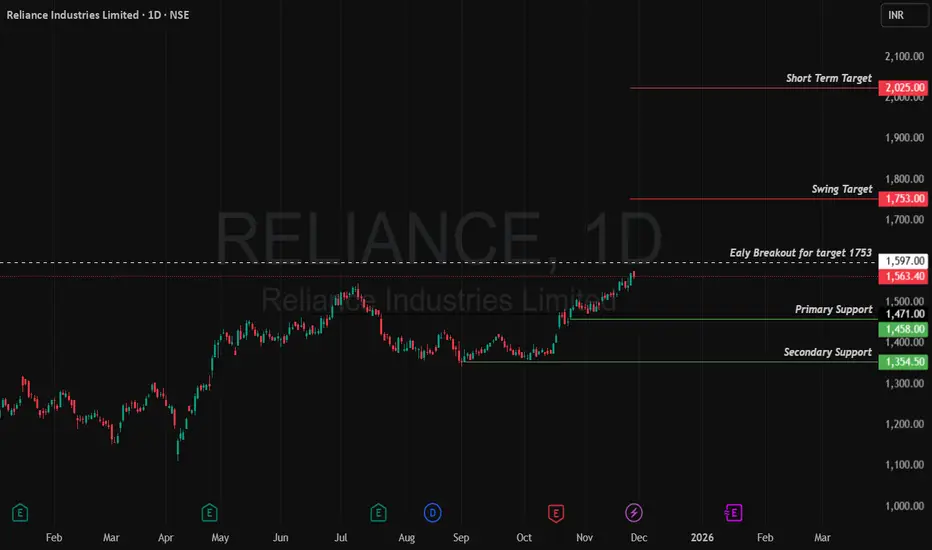
Reliance bullish setup, supported by strong price price actionReliance is entering a structurally bullish phase, driven by momentum across its core verticals and supported by a clean technical breakout structure. The stock is acting as a market leader in the current cycle, participating in the next leg of India’s energy–digital–consumption growth theme. Its recent move toward a 52-week high reflects relative strength and outperformance versus the broader index
Opening angle
Reliance continues to position itself as a core market leader, driving India’s integrated transformation across energy, telecom, digital services, and organised retail. The recent up-move is not just a technical breakout but is supported by improving fundamentals and multi-sector momentum.
Data-backed drivers of the bullish view
Strong year-to-date price performance and notable market-cap addition, reflecting institutional accumulation.
A clean technical breakout structure with higher highs and higher lows, confirming a trend-following setup.
Telecom tailwinds remain intact as ARPU continues to scale, supported by broadband penetration, enterprise solutions, and potential tariff hikes, which act as near-term earnings catalysts.
Retail growth remains robust, backed by Q3 FY25 store additions, healthy revenue growth, and margin expansion, reinforcing Reliance’s position as a dominant consumer platform.
The O2C business shows signs of margin improvement, aided by favourable spreads and stabilising global demand.
Investments in new energy capex (solar, hydrogen, storage ecosystems) add a medium- to long-term rerating layer to the overall business.
Sectorial framing
Reliance functions as a multi-sector proxy for India’s economic cycle:
Energy: O2C + renewables and cleaner fuels
Telecom/Digital: broadband, enterprise solutions, digital transformation
Retail: organised consumption, offline + online integration
Bullish View (Primary Bias)
Buy Above: ₹1597 (Early Breakout Zone)
Target 1 (Swing): ₹1753
Target 2 (Short-Term): ₹2025
SL: ₹1471 (Primary Support)
Disclaimer: tinyurl.com
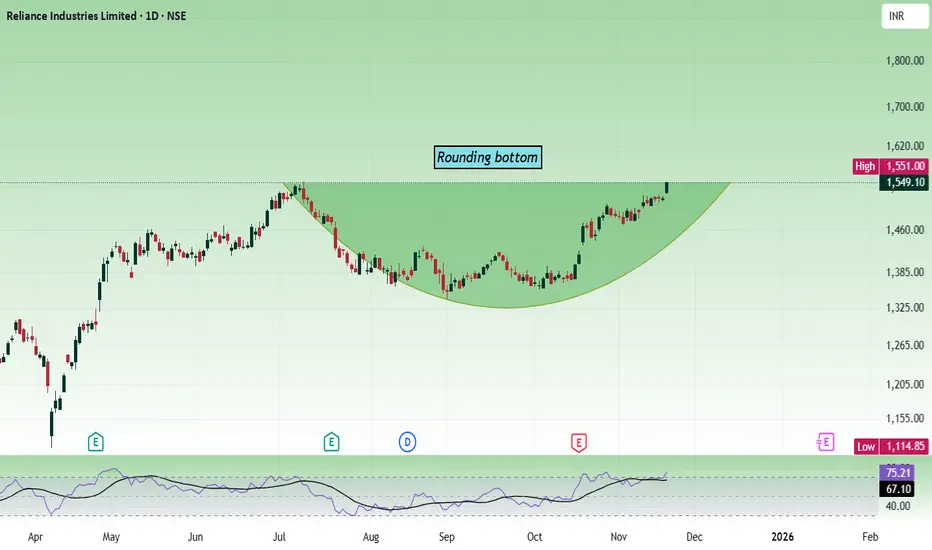
Reliance - Multi time frame analysis...We are going to see the daily and weekly charts. It's beautiful to see how the patterns are aligning.
The daily chart shows, the price has formed a rounding bottom, and right now it is testing the rounding bottom resistance/high.
The weekly chart shows, the price is nearing the cup and handle pattern resistance, which is around the zone 1600. Support is at 1350.
Any dip can be used as a buying opportunity as long as the price is above 1350.
As per the daily chart, we can enter above 1520 with the stop loss of 1470 for the targets 1560, 1590, 1615, 1640, 1676 and 1712. If the price has enough bullish strength, it can test the 1800 and then the 2000 zone.
Always do your analysis before taking any trade.
Part 6 Learn Institutional TradingWhy Trade Options?
Options offer several strategic advantages:
a. Hedging
Investors use options to protect their portfolio. For example, buying a put option can insure against a fall in stock prices, similar to buying insurance.
b. Speculation
Traders can bet on price movements—up, down, or even sideways—using options.
c. Income Generation
Many traders sell options (covered calls, cash-secured puts) to earn regular premiums.
d. Leverage
Options allow control of large positions with a relatively small amount of capital.

Introduction to DivergenceShould You Trade Options?
Options are powerful tools, but they require:
Understanding of market structure
Technical or quantitative edge
Patience and discipline
Clear strategy
Risk management
If you want leverage and flexibility, options are excellent.
If you want consistency and low risk, focus on credit spreads or hedged selling.

Why People Don’t Believe in Compounding Until It’s Too Late?Hello Traders!
Compounding is the most powerful wealth-building force in finance, and yet, most people ignore it.
Not because it doesn’t work, but because it works slowly in the beginning and too fast later.
By the time people realize how powerful compounding really is, they’ve already lost years they can never get back.
Let’s break down why this happens and what you can learn from it.
1. Compounding Looks Boring in the Beginning
In the first few years, compounding feels slow, almost invisible.
You invest, wait, and see very small growth, so people lose interest.
But compounding is like planting a tree: nothing happens for a long time… then everything happens at once.
Early years test your patience. Later years reward it.
2. People Want Fast Results, Not Slow Success
Most traders and investors chase quick profits, because excitement feels better than discipline.
Compounding requires consistency, which feels “boring” compared to high-risk trades.
This impatience makes people break the process before results can appear.
Compounding is slow at first, but permanent later.
3. The Growth Is Invisible Until It Explodes
Compounding does almost nothing for years, then suddenly grows exponentially.
By the time people understand how powerful it is, they’re already 10–15 years behind.
This is why older investors say, “I wish I started earlier.”
The curve is flat… until it goes vertical.
4. Lack of Discipline Breaks the Magic
Skipping contributions here and there reduces future growth dramatically.
Touching invested money destroys compounding momentum.
Consistency, not intelligence, creates compounding returns.
You don’t need to be brilliant. You need to be consistent.
5. People Underestimate Time More Than Money
You can always earn more money, but you can’t earn more time.
The earlier you start, the stronger compounding becomes.
A 25-year-old investing small amounts beats a 40-year-old investing large amounts.
Time is the real multiplier.
Rahul’s Tip:
Compounding doesn’t reward the smartest or richest.
It rewards the most patient.
If you start early, stay consistent, and let time do the heavy lifting, your future wealth becomes unavoidable.
Conclusion:
People don’t believe in compounding because it doesn’t give instant gratification.
But the moment they understand how powerful exponential growth truly is, it’s usually too late.
Start early. Stay patient. Let years, not emotions, build your wealth.
If this post shifted your mindset about long-term investing, like it, comment your thoughts, and follow for more clarity-focused finance lessons!
RELIANCEThis is my future setup for my Reliance industries stock. This is only for educational purposes of Trend analysis.

Cadnle Patterns Mistakes Traders Make With Candle Patterns
Mistake 1: Trading Every Pattern
Not every hammer means buy; not every engulfing means reversal.
Mistake 2: Ignoring the Trend
Trend is king. Patterns against trend are less reliable.
Mistake 3: No Confirmation
Waiting for confirmation improves accuracy.
Mistake 4: Overlooking Market Structure
Support/resistance is more powerful than candle patterns.
Mistake 5: Using Candles Alone
Combine with other tools for best results.

Reliance: Channel Breakdown Below 1535Details:
Asset: Reliance Industries Ltd (RELIANCE)
Breakdown Level: 1535
Potential Targets: 1470, lower levels if selling pressure continues
Stop Loss: 1570
Timeframe: Short-term
Rationale:
Reliance has broken below the key channel support at 1535, indicating a shift toward bearish momentum. If the price continues to sustain below this level, further downside toward 1470 or even lower levels is likely.
Market Analysis:
Technical Setup: Clean channel breakdown with strong bearish candles forming.
Momentum: Weakness observed across multiple timeframes, confirming selling pressure.
Risk Management:
Stop loss at 1570 to avoid getting trapped in any pullback.
Risk-Reward Ratio:
Favorable for short positions with clear breakdown and defined targets.
Monitor for continued weakness and volume confirmation to validate the bearish move.

RELIANCE LONGobserving this study on reliance at demand level for quick scalps.
please study the levels and observe.
reliance gave ltf confirmation and amazing reaction

RELIANCE AT A CRITICAL ZONEBeautiful Chart of Reliance in weekly timeframe and is at an interesting level from where it can go either side.
At weekly levels symmetrical formation of a rally for 3 weeks followed by a bearish engulfing and then crash.
Breakout
If Reliance breaks the high of 1580 the trend will be bullish and 2085 is in horizon in couple of months
Breakdown
If reliance breaks the level of 1535 and further breaks 1485 then it will go down again to the 1120 levels.
Time is of essence.

RELIANCE INDUSTRIES- CUP AND HANDLERELIANCE INDUSTURED POISED FOR A RUN BASED ON
1) SWING STRUCTURE
2) FIBO LEVELS
3) CUP AND HANDLE PATTERN
Any dip should be considered as buying opportunity.
Impact of Geopolitical Risks on Indian Financial MarketsIntroduction
Geopolitical risks have emerged as a significant determinant of financial market behavior across the globe. Defined as the potential for political, social, or military events to disrupt the stability of economies and financial markets, these risks can profoundly impact investor sentiment, capital flows, and asset prices. India, as one of the fastest-growing emerging economies, is particularly sensitive to geopolitical developments due to its strategic location, dependency on energy imports, and integration with global trade networks. From regional conflicts in South Asia to global trade tensions, geopolitical events create volatility in Indian financial markets and influence both domestic and international investors’ decision-making processes.
Channels Through Which Geopolitical Risks Affect Markets
The impact of geopolitical risks on Indian financial markets occurs through several interlinked channels:
Investor Sentiment and Market Volatility:
Geopolitical instability can trigger uncertainty among investors, leading to sudden sell-offs in equity markets. Fear of potential disruptions in economic activity prompts investors to adopt risk-averse strategies, often reallocating capital to safe-haven assets such as gold, U.S. Treasury securities, or currencies like the Swiss Franc. In India, major geopolitical shocks have historically led to heightened volatility in the Bombay Stock Exchange (BSE) and the National Stock Exchange (NSE).
Foreign Institutional Investment (FII) Flows:
India relies significantly on foreign institutional investors (FIIs) to provide liquidity and drive equity market growth. Geopolitical tensions can prompt FIIs to withdraw or reduce investments in emerging markets due to perceived risks, adversely affecting stock indices. For instance, conflicts in the Middle East impacting oil prices often lead to capital outflows from Indian markets, weakening the rupee and exerting downward pressure on equity valuations.
Commodity Prices and Inflation:
India is heavily dependent on imports for critical commodities, particularly crude oil. Geopolitical disruptions in oil-producing regions, such as the Middle East, directly impact crude oil prices, influencing inflation and fiscal policy. Rising crude prices increase production and transportation costs, squeezing corporate margins and reducing disposable income for consumers. This ripple effect negatively impacts stock markets, especially sectors like transportation, manufacturing, and consumer goods.
Currency Fluctuations:
The Indian rupee is highly sensitive to global geopolitical developments. Crises in oil-rich regions, U.S.-China trade tensions, or conflicts affecting major global economies can lead to capital flight from emerging markets, depreciating the rupee. Currency depreciation increases import costs, fuels inflation, and heightens uncertainty for foreign investors, creating further pressure on equity and bond markets.
Interest Rates and Monetary Policy:
Geopolitical shocks can indirectly influence monetary policy decisions. Rising inflation due to higher commodity prices or currency depreciation can compel the Reserve Bank of India (RBI) to adopt a tighter monetary stance, raising interest rates to stabilize prices. Higher interest rates may dampen investment and consumption, affecting corporate earnings and stock market performance.
Historical Examples of Geopolitical Risk Impact on Indian Markets
Gulf Wars and Oil Price Shocks:
During the Gulf War in 1990-1991, crude oil prices surged due to conflict in the Middle East, creating inflationary pressures in India. The Indian stock market experienced volatility, and capital outflows intensified due to investor concerns about the country’s balance of payments and economic stability. The rupee depreciated significantly, and sectors dependent on imported oil and petrochemicals were hit hardest.
U.S.-China Trade Tensions:
Although primarily affecting global markets, trade wars between the U.S. and China had spillover effects on India. Investor apprehension about global growth slowdown led to FII outflows from Indian equities. Export-oriented industries in India, such as IT and manufacturing, faced uncertainty regarding demand and pricing, impacting their stock performance.
Russia-Ukraine Conflict (2022):
The Russia-Ukraine war caused a global energy crisis and disrupted commodity markets. India faced rising crude oil and gas prices, leading to inflationary pressures and fiscal stress. Indian equities reacted with short-term volatility, particularly in energy-intensive sectors and industries heavily reliant on imports. Currency depreciation and bond market stress were also observed as global risk sentiment deteriorated.
Border Tensions with China and Pakistan:
Regional conflicts have historically influenced investor sentiment in India. Escalating tensions along the India-China border or cross-border skirmishes with Pakistan often create uncertainty regarding domestic stability, prompting investors to temporarily reduce equity exposure, resulting in short-term market corrections.
Sectoral Impacts of Geopolitical Risks
The impact of geopolitical risks is often sector-specific:
Energy and Oil & Gas: Directly affected due to import dependency and global supply disruptions.
Defense and Infrastructure: Geopolitical tensions often increase defense spending, benefiting defense contractors and infrastructure companies.
IT and Exports: Trade disruptions and sanctions affect export-oriented businesses, including IT and pharmaceutical sectors.
Banking and Financial Services: Volatility affects investor confidence, credit growth, and risk-weighted assets, impacting banking profitability.
Strategies Adopted by Investors and Policymakers
Portfolio Diversification:
Investors often diversify across asset classes and geographies to hedge against geopolitical risks. Gold and other safe-haven assets are popular choices during periods of heightened uncertainty.
Derivative Hedging:
Hedging using futures, options, and currency swaps allows investors and corporates to mitigate exposure to market and currency volatility induced by geopolitical developments.
Policy Interventions:
The Indian government and RBI actively monitor global developments. Strategic petroleum reserves, currency interventions, and monetary policy adjustments are tools used to manage external shocks. For instance, during periods of oil price spikes, the government has reduced excise duties to contain inflationary pressures.
Long-Term Investment Outlook:
While short-term market movements are highly sensitive to geopolitical shocks, long-term investors often focus on India’s underlying growth potential, robust domestic consumption, and reform-driven policies to maintain confidence.
Challenges and Risks
Despite strategies to mitigate geopolitical risks, certain challenges persist:
Unpredictability: Geopolitical events are inherently uncertain and often occur suddenly, making it difficult for investors and policymakers to respond immediately.
Global Interconnectedness: India’s integration with global financial markets amplifies the impact of distant geopolitical events.
Inflationary Pressures: Persistent inflation due to commodity price shocks can undermine economic stability and erode investor confidence.
Currency Depreciation: Continuous volatility in the rupee can create uncertainty for foreign investors and corporates with significant external debt exposure.
Conclusion
Geopolitical risks represent a complex and multifaceted challenge for Indian financial markets. They affect market sentiment, investment flows, commodity prices, currency stability, and monetary policy decisions. Historical evidence demonstrates that both global and regional geopolitical events have significant short-term impacts, often causing volatility and sector-specific repercussions. However, India’s robust economic fundamentals, strategic policy interventions, and long-term growth potential provide a cushion against sustained market disruption. For investors, a careful blend of risk management strategies, diversification, and a long-term outlook remains essential to navigate the uncertainties posed by geopolitical risks. As India continues to integrate further into global markets, understanding and managing these risks will remain a crucial aspect of financial market strategy.

Crypto Trading Guide1. Understanding Crypto Trading
Crypto trading involves buying and selling digital assets such as Bitcoin (BTC), Ethereum (ETH), and thousands of altcoins with the goal of earning profits. Traders analyze price movements, market sentiment, liquidity, and technical indicators to make buy or sell decisions.
Unlike stock markets, crypto exchanges are decentralized and global. This means prices can fluctuate rapidly based on fundamentals, macroeconomic factors, regulatory developments, or even social media trends. Knowing how these factors affect token value is the first step toward successful trading.
2. Types of Crypto Trading
There are several popular trading styles, each suited for different personality types and risk appetites.
a) Day Trading
Day traders enter and exit positions within a single day. They rely on short-term price movements, chart patterns, and volume spikes. This style requires high attention, quick decision-making, and consistent strategy execution.
b) Swing Trading
Swing traders hold assets for days or weeks. They aim to capture price “swings” driven by broader trends. This style offers a balance—less stress than day trading yet more opportunities than long-term investing.
c) Scalping
Scalpers make numerous small trades throughout the day, profiting from minor price differences. It demands precision, discipline, and fast execution.
d) Position Trading
Position traders take long-term positions based on macro trends, technological developments, or fundamental analysis. They are less affected by short-term volatility.
e) Automated or Algorithmic Trading
Bots execute trades automatically based on predefined rules. This reduces emotional bias and allows 24/7 trading. However, setup and strategy optimization require knowledge and testing.
3. Choosing the Right Crypto Exchange
Selecting a reliable exchange is vital for safety and smooth trading. Compare platforms based on:
Security features (2FA, cold storage, proof of reserves)
Trading fees (maker/taker charges)
Liquidity (higher liquidity ensures smoother trades)
Supported crypto pairs (BTC/USDT, ETH/USDT, etc.)
User interface and tools
Customer support quality
Global exchanges include Binance, Kraken, and Coinbase, while several regional exchanges also offer local currency support.
4. Building a Trading Plan
A trading plan acts as your roadmap. It should answer:
Which coins will you trade?
What is your entry strategy?
What is your exit strategy?
How much capital will you risk per trade?
What indicators will you use?
How will you control emotions?
A strong trading plan prevents impulsive decisions and keeps you aligned with your long-term goals.
5. Fundamental Analysis (FA)
Fundamental analysis evaluates a crypto asset’s underlying value. Unlike stocks, cryptocurrencies don't have earnings or balance sheets. Instead, traders rely on:
Project whitepaper
Technology and blockchain model
Token utility and real use cases
Team and advisors
Partnerships and community size
Supply metrics (circulating and max supply)
Roadmap progress
Market sentiment (news, social media trends)
Strong fundamentals help identify long-term winners.
6. Technical Analysis (TA)
Technical analysis uses chart data to predict price movements. Common tools include:
a) Candlestick Patterns
Doji, engulfing, hammer, shooting star—these show buying or selling strength.
b) Support and Resistance
Support acts as a floor for prices; resistance acts as a ceiling.
c) Moving Averages (MA)
Popular trends include:
50-day MA
100-day MA
200-day MA
Bullish when price stays above key MAs.
d) RSI (Relative Strength Index)
Indicates overbought (70+) or oversold (30-) conditions.
e) MACD (Moving Average Convergence Divergence)
Shows momentum and potential trend reversals.
f) Volume Analysis
A price move with strong volume is more reliable than one with low volume.
A combination of these indicators gives clearer trading signals.
7. Risk Management
Crypto’s volatility can wipe out profits quickly if risk is not controlled. Effective risk management includes:
a) Position Sizing
Never allocate your entire portfolio to one coin. Use fractional position sizes (1–5% per trade).
b) Stop-Loss Orders
Automatically exit losing trades before losses escalate.
c) Take-Profit Levels
Lock in profits instead of waiting for unsustainable peaks.
d) Avoid Over-Leveraging
Futures trading may amplify gains, but also magnifies losses. Beginners should avoid high leverage.
e) Diversification
Hold a mix of large caps (BTC, ETH), mid-caps, and small caps to balance risk.
f) Keep Emotions in Check
Fear and greed are the biggest threats. A calm, rule-based approach wins long term.
8. Psychology of Crypto Trading
Market psychology plays a major role in crypto. Traders should understand:
Fear of Missing Out (FOMO)
Chasing pumps leads to buying at peaks.
Fear, Uncertainty, and Doubt (FUD)
Negative news often triggers panic selling—even when fundamentals remain strong.
Overconfidence
Winning streaks can cause reckless decisions. Stick to your plan.
Patience and Discipline
Waiting for perfect setups is key. Avoid forcing trades.
A successful trader masters both the charts and their mindset.
9. Common Crypto Trading Mistakes
Avoid the pitfalls that trap many beginners:
Trading without a plan
Using high leverage early
Investing money you cannot afford to lose
Blindly following social media influencers
Ignoring security practices
Overtrading
Not keeping trading journals
Holding losing positions out of hope
Learn from mistakes and review trades regularly.
10. Securing Your Crypto
Security should always be a top priority. Follow best practices:
Use hardware wallets for long-term storage
Enable 2FA authentication
Keep strong, unique passwords
Avoid trading on public Wi-Fi
Beware of phishing and fake websites
Backup seed phrases offline
A secure setup ensures your profits remain yours.
Conclusion
Crypto trading offers enormous potential, but success depends on knowledge, discipline, and strategic execution. By understanding trading styles, applying both fundamental and technical analysis, managing risk effectively, and controlling emotions, you can navigate the volatility of crypto markets with confidence. The key is to start slow, stay consistent, and treat trading as a long-term skill-building journey. With the right approach, crypto trading becomes not just profitable but also an enriching experience in the rapidly evolving world of digital finance.

RELIANCE INDUSTRIES LTD:Likely Cup&Saucer Break OutRELIANCE: Trading at 1530-1540.
Trading above all its Critical moving averages even in weekly chart .
Moreover DEMA has given a golden cross over of 20DEMA in weekly chart shows the strength in the stock.
Reliance has for med a Cup& Handle pattern in weekly chart and RIL holding above 1540-1550 on closing basis likely to test 1650+(For educational purpose only)

Reliance- Breakout- Retest- New HighsHello Traders! May today bring clarity, clean setups, and confident execution.
Stay patient and stay profitable.
Reliance has delivered a clean weekly breakout above its horizontal swing resistance, a level that acted as a strong barrier for many weeks.
With this resistance now broken, the price can move towards the upper All-Time High Resistance zone.
Once this all-time high level is tested, the chart suggests a possible pullback towards the same swing resistance it has just broken. This move will also act as a breakout retest, which is healthy and common in a strong trend.
If the retest holds and buyers regain control, Reliance may attempt to break its All-Time High Resistance as well. A successful breakout there opens the path toward the upper Trendline Resistance, which is the next major long-term target in this rising channel.
Overall, the structure remains strongly bullish with a breakout, a potential retest, and then a possible larger move towards the trendline resistance.
Will update publication accordingly, Stay tuned!
Regards-- Amit

RELIANCE @ 1546 ON WEEKLY GAVE BREAKOUT FROM CUP AND HANDLE. Please note I am not a SEBI REGISTERED , Its mere idea and chart reading analysis. RELIANCE @ 1546, On weekly time frame gave breakout from cup & handle pattern. If it sustain above 1545 for a week, then it can move towards 2000-2200 in 7-9 month.

Best buying Opprtunity in Reliance stock Reliance Industries Announces ₹20,000 Crore Green Energy Joint Venture
Reliance Industries Limited (RIL) has partnered with a leading European firm to invest ₹20,000 crore in India’s renewable energy sector.
The joint venture aims to accelerate the development of solar power, wind energy, and green hydrogen production.
As part of this collaboration, advanced gigafactories will be established to manufacture solar photovoltaic (PV) modules, wind turbines, and electrolyzers, promoting indigenous production under the ‘Make in India’ initiative.
The project is expected to generate thousands of direct and indirect employment opportunities, particularly for engineers, technicians, and skilled professionals.
This strategic partnership will contribute significantly to reducing carbon emissions, aligning with India’s Net Zero Emission targets.
Additionally, the venture will enhance India’s position in the global renewable energy market by integrating next-generation energy solutions, smart grid technology, and AI-driven energy management systems.
Support Levels:
Current Support Zone: ₹1,205 - ₹1,214
Extended Support Level: ₹1,150
Major Support Zone: ₹999 - ₹1,019
Resistance Levels:
Immediate Resistance Zone: ₹1,298 - ₹1,316
First Short-term Target: ₹1,450
Second Short-term Target: ₹1,650
Major Resistance Zone: ₹1,578 - ₹1,611 (near all-time high)
The stock is currently testing the support zone of ₹1,205 - ₹1,214, and if this level breaks, the next downside level to watch is ₹1,150. On the upside, the ₹1,298 - ₹1,316 zone acts as resistance, with potential for further movement towards ₹1,450 and ₹1,650 if strength builds.
LIKE & SHARE , Comment For More Stock Analysis

RELIANCE | Perfect cup & handle setup - Looks very strong 30%RELIANCE | Perfect cup & handle setup - Looks very strong for 30% short term
Last time the flag breakout disappointed, but this time Cup & handle will restore the faith i believe
Looks like 2026 is going to be a large cap year !
KOTAKBANK
RELIANCE
TCS
INFY
index heavy weights are super bullish