Part 2 Support and ResistanceOption Premium Breakdown – Intrinsic vs Extrinsic
1. Intrinsic Value
Actual value if exercised TODAY.
For Call: Spot – Strike (if positive)
For Put: Strike – Spot (if positive)
2. Extrinsic (Time + Volatility)
Value due to time left + expectations.
This is where traders either make or lose money.
Trade ideas

Unlock Stock Market Gains1. The Foundation: Market Structure Is Everything
Before trying to earn profits, a trader must understand how markets move.
Market structure shows the journey of price through phases—accumulation, markup, distribution, and markdown.
1. Accumulation Phase
Institutions slowly build positions at discounted prices.
Volume is low but stable.
Retail traders usually ignore this zone because nothing exciting happens.
Signs:
Tight range movements
Higher lows on volume spikes
Long consolidation after a fall
This is where smart traders quietly prepare.
2. Markup Phase
A strong breakout happens as demand increases.
Prices rise faster than before.
Signs:
Breakout above resistance
Volume expansion
Strong bullish candles
This is the best phase for trend traders.
3. Distribution Phase
Institutions start selling while retail investors keep buying.
Signs:
Flat top structure
Divergence in volume
High volatility
Many retail traders get trapped here, believing the trend will never end.
4. Markdown Phase
Strong downtrend begins after supply overwhelms demand.
Signs:
Breakdown of support
Series of lower highs
Panic selling
To unlock gains, a trader must learn:
Buy during accumulation and early markup
Exit during distribution
Avoid trading during markdown (unless shorting)
This alone can transform trading performance.
2. Volume Profile: The Secret Tool for Spotting Smart Money
Volume Profile shows where big players are interested—not just how much they buy, but at which price they build positions.
Key levels:
1. Value Area High (VAH)
Upper boundary of heavy-volume zone.
Price above VAH = breakout potential.
Price below VAH = selling pressure.
2. Value Area Low (VAL)
Lower boundary of heavy-interest zone.
Price bouncing from VAL often triggers rallies.
3. Point of Control (POC)
The single most traded price level.
Acts like a magnet—price often revisits it.
Volume Profile tells you:
Where institutions accumulate
Where stop losses of retailers sit
Where breakouts have real conviction
Mastering volume adds huge clarity to entries and exits.
3. Sector Leadership: The Engine Behind Big Market Moves
Stock market gains come fastest when you ride the strongest sectors.
Every market cycle has sector rotation:
When the economy expands → Banks, Autos, Capital Goods rise
When global liquidity improves → IT, Pharma, FMCG move
When government spending rises → Infra, Defence, PSU stocks rally
When risk appetite increases → Smallcaps, Midcaps explode
To unlock gains, always ask:
Which sector is leading right now?
If Bank Nifty is strong, choose financial stocks.
If Nifty Metal is strong, choose steel/aluminum stocks.
If Nifty IT is strong, choose large-cap tech stocks.
Following sector momentum gives you:
Faster returns
Stronger trends
Higher breakout success rate
4. Institutional Behavior: Follow the Big Money
Retailers react to news.
Institutions plan months ahead.
The stock market moves according to:
FII flows (Foreign Institutional Investors)
DII flows (Domestic institutions & mutual funds)
Proprietary desk positions
HNI activity
When big money enters a stock:
Breakouts become cleaner
Trends sustain longer
Pullbacks are shallow
You unlock gains by aligning with big investors, not fighting them.
How to track this?
Look at volume during breakouts
Observe bulk deals and block deals
Track FII and DII daily inflow/outflow
Watch open interest built during consolidation
This creates confidence in your trades.
5. Chart Patterns & Candlestick Mastery: Timing Your Entries Perfectly
A trader with poor entries struggles even in trending markets.
A trader with perfect entries can outperform even in sideways markets.
The best patterns for unlocking gains are:
Cup and Handle
Bull Flag
Ascending Triangle
Double Bottom
Rounding Bottom
Breakout + Retest
Candles that strengthen your confidence:
Bullish Engulfing
Hammer
Marubozu
Inside Bar breakout
Doji at support
Patterns + volume = high conviction trades.
6. Risk Management: The Real Key to Unlocking Gains
Most traders lose money not because of bad trades, but because of:
Oversized positions
No stop loss
Emotional trading
Chasing breakouts
Averaging down
Revenge trading
To consistently unlock gains:
Risk 1–2% of capital per trade
Use stop losses religiously
Maintain good risk-reward ratios (1:2 or 1:3)
Book profits partially on strength
Avoid trading during high-volatility events (Fed, RBI, Budget)
Without risk control, no strategy works.
7. Psychology: The Missing Piece in Most Traders’ Journey
The stock market tests emotions more than intelligence.
The top psychological rules:
Trade plans > Emotional reactions
Patience during consolidation
Discipline during entries
Zero attachment to stocks
No fear during breakout opportunities
No greed during profitable trades
A calm mind sees opportunities clearly.
A stressed mind sees risks everywhere.
8. Position Sizing & Capital Allocation: Multiply Gains Safely
Smart position sizing ensures long-term growth.
Allocation blueprint:
50% in strong trending stocks
20% in sector leaders
20% in high-risk high-reward smallcaps
10% in hedge or defensive stocks
Diversification protects you, but over-diversification kills gains.
Position sizing rules:
Add to winners, not losers
Pyramid only after confirmation
Scale out on signs of distribution
9. Following Market Sentiment & Global Cues
Modern markets are globally interconnected.
Sentiment drivers:
GIFT Nifty
US indices (Dow, Nasdaq, S&P 500)
Dollar index (DXY)
Crude oil prices
India VIX
Bond yields
Geopolitical news
Positive sentiment = higher accuracy in long trades.
Negative sentiment = better opportunities for short trades.
10. Building a Consistent Trading System
A profitable trader uses a structured approach:
Your system should include:
Setup – what pattern/structure you trade
Trigger – the exact candle or signal
Entry – breakout/POC bounce/sector strength
Stop Loss – technical, volatility-based, or structural
Target – R:R-based or trailing stop methodology
Exit signals – rejection, distribution, divergence
A consistent system = consistent gains.

Part 7 Trading Master Class With Experts 1. Delta
Measures how much the option premium changes with a ₹1 move in the underlying.
Call delta: +0.0 to +1.0
Put delta: –0.0 to –1.0
2. Theta (Time Decay)
Measures how much value the option loses each day.
Buyers suffer from Theta
Sellers benefit from Theta
3. Vega
Measures impact of volatility.
High volatility → higher premium
Low volatility → lower premium
4. Gamma
Measures how fast delta changes.
High gamma = high speed of price movement.

Reading Fundamentals With TradingView – Reliance EditionWhen you look at a giant like Reliance, the price chart doesn’t tell the whole story.
But TradingView has a few simple fundamentals that help you understand what the company is actually doing behind the scenes.
You don’t need finance knowledge. Just a few basic ideas.
Below is a simple way to read each metric, and what Reliance’s chart is telling us right now.
1. Total Revenue — “How much money did the company make?”
What it means:
Revenue is the total money a company earns from all its businesses.
If it goes up → the company sold more.
If it goes down → business slowed.
Good side:
Growing revenue means customers are buying more.
It usually means demand is strong.
Bad side:
Falling revenue means something is not working — maybe prices dropped, or there was less demand.
What Reliance shows:
Reliance’s revenue jumps sharply in 2022 because oil prices were high and retail was growing fast.
In 2023 it dips — global petrochem prices cooled.
By 2024–25 it stabilizes again, showing that its telecom and retail arms are balancing out the ups and downs of the oil business.
2. Free Cash Flow — “How much cash is left after paying all bills?”
What it means:
If a company earns money but spends even more, free cash flow becomes negative.
If it earns more than it spends, free cash flow is positive.
Good side:
Positive FCF means the company can expand safely and pay debt.
Bad side:
Negative FCF means the company is spending heavily — sometimes for expansion, sometimes because of trouble.
What Reliance shows:
Reliance had deep negative FCF in 2021–23.
Not because it was in trouble — but because it was building things: Jio towers, fiber, retail stores, warehouses.
By 2024–25, FCF turns strong again.
That means: “Expansion phase slowing. Collection phase starting.”
3. Long-Term Debt — “How much money did the company borrow?”
What it means:
Companies borrow when they want to build something big.
Debt rising is not always bad — it depends on what they built.
Good side:
Debt used for growth is healthy.
If the company earns more than the interest it pays, it’s fine.
Bad side:
Debt becomes risky if profits fall or the company stops growing.
What Reliance shows:
Debt fell when Reliance sold stakes in Jio and Retail (Facebook, Google, etc.).
Then debt started rising again as new projects came in.
But margins and revenue stayed stable — so this is “growth borrowing,” not “trouble borrowing.”
4. Market Cap — “What is the company worth in the market?”
What it means:
This is simply the stock price × number of shares.
It shows what investors think the whole company is worth.
Good side:
Market cap rising usually means investors believe the company has a strong future.
Bad side:
If market cap falls even when revenue rises, investors are unsure or waiting.
What Reliance shows:
Market cap went sideways for a long period — not crashing, not flying.
This usually means investors are waiting for the next big chapter (like green energy or retail listing).
5. P/E Ratio — “How much are people willing to pay for ₹1 of profit?”
What it means:
A high P/E means investors expect big growth.
A low P/E means investors are cautious.
Good side:
High P/E = people believe in the company.
Bad side:
Too high P/E = expectations are unrealistic.
What Reliance shows:
P/E around 24 means Reliance is no longer being valued like an oil company.
Oil companies usually have single-digit P/E.
This P/E shows that the market sees Reliance as multiple businesses — telecom, retail, and energy — not just oil.
6. Operating Margin — “How much profit the company keeps after running the business?”
What it means:
This shows efficiency.
Higher margin = better.
Lower margin = costs are rising or competition is tough.
Good side:
Rising margins mean the business is getting stronger.
Bad side:
Falling margins mean costs are eating into profits.
What Reliance shows:
Margins stay around 11–12%.
That’s normal for Reliance because retail has lower margins, telecom has stable margins, and oil has volatile margins.
This mix keeps margins steady, not extreme.
7. ROCE — “Is the company using its money wisely?”
What it means:
ROCE tells you how well the company turns investments into profit.
Higher ROCE = efficient use of money.
Lower ROCE = new projects still warming up.
Good side:
Rising ROCE means the business is entering a stronger phase.
Bad side:
Falling ROCE may mean too much money is stuck in early-stage projects.
What Reliance shows:
ROCE around ~9–10% means Reliance is midway — not booming, not struggling.
As retail and Jio mature further, ROCE usually goes up.
Final thoughts
When you put all these together, Reliance becomes very easy to read:
Revenue shows the size of the engine
Free Cash Flow shows how much fuel is left
Debt shows how fast they’re expanding
Market cap shows what people believe
P/E shows expectations
Margins show efficiency
ROCE shows long-term strength
None of this is complicated.
TradingView already gives you everything — you just need to see each line for what it is.
Disclaimer
This analysis is for educational purposes only and does not constitute investment advice. Please do your own research (DYOR) before making any trading decisions.

Candle Patterns Candlestick patterns are visual signals created by price movement. Each candle shows open, high, low, and close, but certain shapes reveal strong buying or selling pressure.
✅ 1. Single Candlestick Patterns
✅ 2. Bullish Candlestick Patterns (Reversal)
✅ 3. Bearish Candlestick Patterns (Reversal)
✅ 4. Continuation Patterns

Part 4 Learn Institutional Trading Two Sides of an Option Trade
Every option contract involves two parties:
a. Option Buyer
Pays a premium (price of the option)
Limited risk (only the premium paid)
Unlimited profit potential in some cases
b. Option Seller (Writer)
Receives the premium
Limited profit potential
Higher risk (sometimes unlimited)
Option buyers purchase potential, while sellers sell that potential in exchange for premium income.

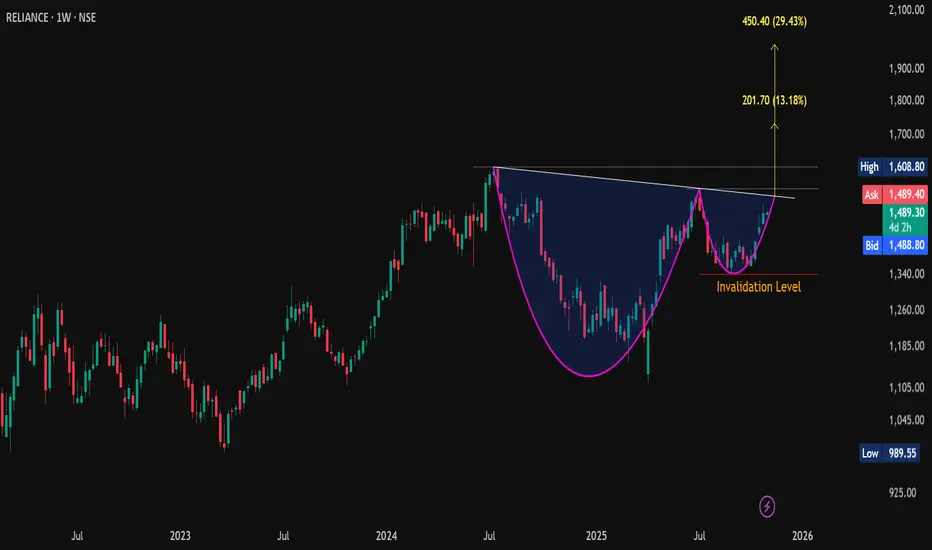
Cup & Handle Breakout Opportunity in Reliance IndustriesReliance Industries, currently trading near ₹1518 on the weekly charts, is showing signs of a cup & handle breakout at the top of a consolidation zone. This pattern, combined with strong Relative Strength Index (RSI) readings across multiple timeframes, highlights a potential bullish opportunity.
🔍 What is a Cup & Handle Pattern?
Cup Formation:
Price declines, then gradually recovers, forming a rounded bottom resembling a “cup.”
Handle Formation:
A short consolidation or pullback after the cup, forming the “handle.”
Breakout Point:
When price breaks above the handle’s resistance, it signals continuation of the uptrend.
Reliance Industries Case:
Cup & handle is forming/completing at the top of consolidation.
Price is now ready to break out of the handle’s endpoint, suggesting bullish momentum.
📊 RSI Confirmation
The Relative Strength Index (RSI) is a momentum indicator that measures strength of price movements.
Key Levels:
Above 50 → Indicates bullish momentum.
Moving toward 70 → Signals strong upside strength.
Reliance Industries RSI:
Daily RSI trending above 50 and preparing to cross 70.
Monthly, weekly, and daily RSI all above 50, showing broad-based momentum.
This alignment across timeframes adds conviction to the breakout.
🎯 Learning Points for Traders
Pattern Recognition:
Cup & handle is a continuation pattern often seen before strong rallies.
Breakout above the handle confirms bullish intent.
Multi-Timeframe Analysis:
RSI above 50 across monthly, weekly, and daily charts strengthens the setup.
Multiple timeframe confirmation reduces false signals.
Momentum + Pattern Combination:
Chart patterns show structure, RSI confirms strength.
Together, they create a high-probability trading opportunity.
Risk Management:
Stop-loss can be placed below the handle’s low.
Avoid entering before breakout confirmation.
📝 Conclusion
Reliance Industries’ cup & handle breakout, supported by RSI strength across all timeframes, is a textbook example of how price patterns and momentum indicators work together. For learners, this case highlights the importance of combining technical structures with RSI confirmation to identify reliable breakout opportunities.

RELIANCE 15MININTRADAY TRADE
- EARN WITH ME DAILY 10K-20K –
RELIANCE Looking good for upside..
When it break level 1520 and sustain.. it will go upside...
BUY@ 1520
Target
1st 1536
2nd 1552
FNO
RELIANCE NOV FUT – LOT 7 (Qty-3500)
RELIANCE NOV 1490 CE – LOT 7 (Qty-3500)
Enjoy trading traders.. Keep add this STOCK in your watch list..
Big Investor are welcome to join the ride ..
Like this Post??? Hit like button..!!!
Follow me for FREE Educational Post and Alert..

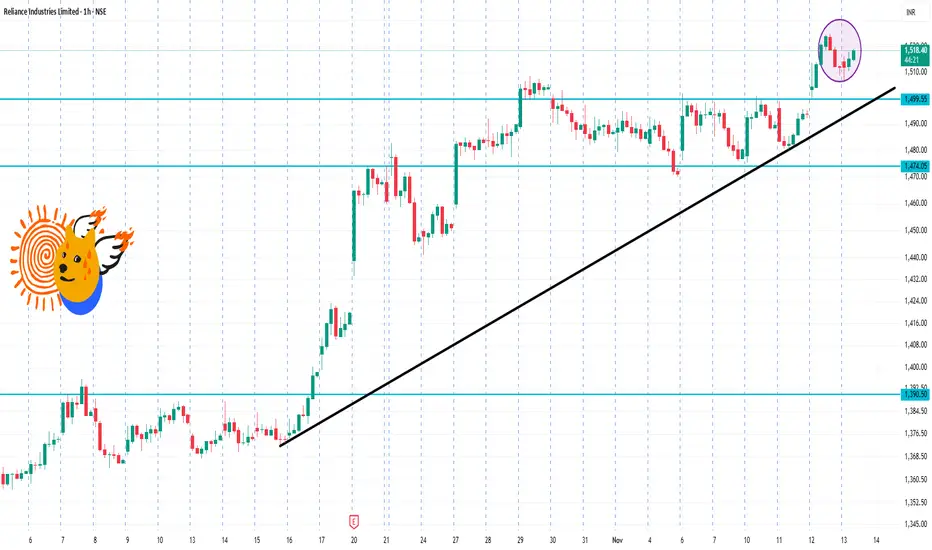
RIL 1 Hour Time Frame🔍 Current basics
Latest traded price: ~ ₹1,518 on NSE.
52-week range: Low ~ ₹1,114.85, High ~ ₹1,551.00.
Technical indicator summary (on 1-hour/higher timeframes) shows a “Strong Buy” bias.
⚠️ Risks / Caveats
Even though the technicals are bullish, the stock is close to its 52-week high (~ ₹1,551). Highs often mean less “room” for upside without some pullback.
Intraday patterns can change quickly with macro news or sector moves (eg: oil & gas, regulatory).
Support at ~₹1,500 is fairly close to current; a break could expose the ₹1,470–₹1,480 region.
Because this is a large-cap and widely held stock, institutional moves and volume matter a lot.
How Businesses Can Grow in the Trading Market1. Understanding the Trading Market
The trading market encompasses multiple segments—stock trading, forex (foreign exchange), commodity trading, derivatives, and cryptocurrency trading. Each market functions under different regulatory, economic, and technological frameworks but shares a common goal: facilitating the exchange of value and risk between buyers and sellers.
For businesses entering trading, the first step to growth is a deep understanding of the market structure, participant behavior, and factors influencing price movements. Knowledge of supply-demand dynamics, macroeconomic indicators, and geopolitical influences helps in making informed trading decisions. Companies that invest in market intelligence and data analysis often find themselves ahead of competitors.
2. Building a Strong Trading Infrastructure
A key driver of growth in the trading market is technological infrastructure. In today’s environment, speed, accuracy, and connectivity define success. Businesses must invest in:
Trading Platforms: Using robust platforms like MetaTrader, Bloomberg Terminal, or proprietary systems ensures efficiency in execution.
Data Analytics Tools: Real-time data processing, AI-driven insights, and predictive analytics help in identifying opportunities early.
Connectivity and APIs: Fast internet connections and integration with exchanges through APIs enhance automation and scalability.
Cybersecurity: As trading becomes digital, safeguarding systems from cyber threats is essential for operational continuity and client trust.
A business that leverages advanced technology can scale operations globally while minimizing transaction errors and latency.
3. Strategic Diversification
One of the fundamental principles for business growth in the trading market is diversification. Relying on a single asset class or market exposes a company to unnecessary risk. Successful trading businesses diversify in several ways:
Asset Diversification: Engaging in equities, forex, commodities, and derivatives reduces dependence on one market.
Geographical Diversification: Expanding into international markets allows firms to capitalize on regional opportunities and time-zone differences.
Product Diversification: Offering products like ETFs, mutual funds, or structured products can attract a broader client base.
Diversification not only stabilizes revenue but also opens multiple income streams that cushion the impact of market volatility.
4. Leveraging Technology and Automation
Technology plays a transformative role in the trading market. Automated and algorithmic trading systems have revolutionized how businesses operate. Algorithms can execute large volumes of trades within milliseconds based on pre-set strategies, removing emotional bias and increasing efficiency.
Key technological advancements supporting business growth include:
Artificial Intelligence (AI) and Machine Learning (ML): AI helps forecast price movements using pattern recognition and big data analysis.
Blockchain Technology: It enhances transparency and reduces settlement times, especially in cryptocurrency and cross-border trading.
Cloud Computing: Enables real-time access to trading data and remote operation, allowing global teams to collaborate seamlessly.
Firms that embrace automation and digital transformation gain a competitive advantage through reduced costs, higher accuracy, and faster decision-making.
5. Developing a Risk Management Framework
Trading is inherently risky due to market fluctuations, leverage, and liquidity issues. Businesses can grow sustainably only when they balance risk and reward. A strong risk management strategy involves:
Position Sizing: Limiting exposure per trade to a fixed percentage of total capital.
Stop-Loss Orders: Automatically exiting losing trades to prevent large losses.
Hedging: Using derivatives like options and futures to protect against adverse price movements.
Stress Testing: Simulating different market scenarios to assess potential impacts on the portfolio.
Risk management not only safeguards capital but also builds confidence among investors and clients.
6. Regulatory Compliance and Transparency
Growth in the trading market depends heavily on maintaining regulatory compliance. Governments and financial authorities such as SEBI (India), SEC (USA), and FCA (UK) impose rules to ensure fair trading and investor protection. Businesses that adhere to these regulations gain credibility and attract institutional clients.
Transparency in reporting, accurate record-keeping, and ethical conduct are vital for long-term growth. A reputation for integrity can distinguish a trading firm in a competitive marketplace.
7. Building a Skilled Team
A successful trading business requires a mix of analytical, technical, and strategic expertise. Recruiting skilled professionals—traders, analysts, risk managers, and developers—creates a strong foundation for growth. Additionally, ongoing training ensures the team stays updated with market trends, tools, and compliance requirements.
Companies should encourage knowledge sharing, foster innovation, and provide performance-based incentives. Human capital remains one of the most valuable assets in trading operations.
8. Adopting Data-Driven Decision Making
Data has become the new currency of the trading world. Businesses that leverage data effectively can identify trends, forecast market behavior, and optimize trading strategies. Using big data analytics allows traders to process massive volumes of historical and real-time information for better decision-making.
Predictive analytics tools can detect early signs of market shifts, while sentiment analysis (e.g., through news or social media data) provides insights into investor psychology. Data-driven approaches minimize guesswork and enhance precision.
9. Strategic Partnerships and Networking
Collaborations with financial institutions, liquidity providers, and technology vendors can accelerate growth. For instance, partnering with brokers or fintech platforms enables access to liquidity pools and advanced market tools. Networking at global financial conferences or online forums also helps in building relationships that open doors to new opportunities and insights.
Strategic alliances expand reach, enhance credibility, and reduce operational costs through shared resources.
10. Marketing and Branding in the Trading Sector
In a competitive trading environment, marketing and brand differentiation are crucial. Businesses must position themselves as reliable, transparent, and technologically advanced. Effective strategies include:
Content Marketing: Publishing insightful market analyses and trading education to attract clients.
Social Media Presence: Using platforms like LinkedIn, X (formerly Twitter), and YouTube to engage traders.
Client Support and Service Quality: Building trust through prompt assistance and transparent communication.
A strong brand helps attract both retail and institutional clients, fueling growth.
11. Expanding into New Markets
Globalization has made it easier for trading businesses to enter emerging markets where trading activity is growing rapidly. Markets in Asia, Africa, and Latin America offer rising participation and economic potential. Understanding local regulations and customizing products for regional demand helps in capturing new audiences.
Expanding internationally diversifies revenue and increases resilience against downturns in any single economy.
12. Continuous Innovation and Adaptability
The trading market evolves constantly with changing technologies, regulations, and investor preferences. To grow, businesses must remain adaptable—embracing new tools like decentralized finance (DeFi), sustainable investing, and tokenized assets.
Innovation in products, strategies, and services keeps a firm relevant and competitive. Regular review of trading models ensures alignment with current market realities.
Conclusion
Growth in the trading market is not achieved overnight—it results from a blend of strategic planning, technological investment, skilled management, and disciplined execution. Businesses that focus on diversification, automation, risk management, and compliance can build a robust foundation for sustainable expansion.
In a world where financial markets are interconnected and data-driven, success depends on how well a business can adapt to change, leverage technology, and maintain trust. By combining innovation with prudence, any trading enterprise can evolve from a small participant to a global leader in the dynamic world of trading.

India’s IPO System:Securities and Exchange Board of India (SEBI)1. Understanding an IPO
An Initial Public Offering (IPO) is the process by which a privately held company offers its shares to the general public for the first time. Through an IPO, a company becomes publicly listed on a stock exchange, such as the National Stock Exchange (NSE) or the Bombay Stock Exchange (BSE). The primary goal of an IPO is to raise capital for expansion, reduce debt, fund research, or provide an exit opportunity for early investors and promoters.
An IPO marks a significant milestone in a company’s journey because it transitions from a private entity with limited ownership to a public entity with diverse shareholders. It also enhances the company’s visibility, credibility, and valuation in the market.
2. Regulatory Framework of the Indian IPO System
The IPO process in India is governed by SEBI, established in 1992, which regulates and ensures that companies follow strict norms before going public. SEBI’s guidelines protect investors’ interests and maintain transparency. Other regulatory bodies involved include:
Ministry of Corporate Affairs (MCA) – Oversees company law compliance.
Stock Exchanges (NSE/BSE) – Approve listing applications and trading permissions.
Registrar of Companies (ROC) – Records and validates company documents.
Depositories (NSDL/CDSL) – Facilitate electronic shareholding and transactions.
SEBI’s (Issue of Capital and Disclosure Requirements) Regulations, 2018 (ICDR) lay down the specific rules for disclosures, eligibility, and allotment in an IPO.
3. Types of IPO Issues in India
There are primarily two types of IPO issues based on pricing methods:
Fixed Price Issue:
The company sets a fixed price for each share in advance.
Investors know the share price before applying.
After closure, demand is revealed, and shares are allotted accordingly.
Book Building Issue:
The company sets a price band (e.g., ₹100–₹120).
Investors bid within the range, specifying the quantity and price they are willing to pay.
The final issue price is determined based on demand (cut-off price).
Most modern IPOs in India use this method due to market efficiency.
4. Eligibility Criteria for Companies
For a company to launch an IPO in India, SEBI mandates certain eligibility conditions:
Net Tangible Assets: Minimum of ₹3 crore in the preceding three years.
Net Worth: Minimum of ₹1 crore in the last three years.
Track Record: Positive operating profit for at least three out of the last five years.
Post-Issue Capital: Minimum ₹10 crore paid-up capital.
Promoter Contribution: Promoters must hold at least 20% of post-issue capital for one year.
If companies do not meet these conditions, they can still approach the market through alternative routes like the SME (Small and Medium Enterprises) Platform or offer for sale (OFS) mechanisms.
5. IPO Process in India
The IPO process involves several well-defined steps:
a. Appointment of Intermediaries
Companies hire financial and legal advisors, including:
Merchant bankers (lead managers)
Underwriters
Registrars to the issue
Auditors and legal consultants
These intermediaries help structure, price, and execute the IPO.
b. Due Diligence and Draft Red Herring Prospectus (DRHP)
The merchant banker prepares a Draft Red Herring Prospectus (DRHP), containing details like company background, financial statements, management, risks, and objectives of the issue.
SEBI reviews the DRHP to ensure full disclosure. After approval, it becomes the Red Herring Prospectus (RHP).
c. Marketing and Roadshows
Companies conduct roadshows to attract institutional and retail investors. The management team presents the company’s growth story, business potential, and financial performance.
d. Bidding and Allotment
In a book-building issue, bidding remains open for 3–5 working days.
Investors can bid through the Application Supported by Blocked Amount (ASBA) system, where funds remain blocked in their bank account until allotment.
Post-closure, the company determines the cut-off price and allots shares to investors.
e. Listing on the Stock Exchange
Once shares are allotted, they are credited to investors’ demat accounts.
The company’s shares are then listed on the NSE and/or BSE within six working days from the issue closure date (known as the T+6 timeline).
6. Categories of Investors in an IPO
SEBI divides investors into three main categories to ensure fair participation:
Qualified Institutional Buyers (QIBs):
Includes mutual funds, insurance companies, foreign portfolio investors (FPIs), and banks. They are allotted 50% of the issue size in book-built issues.
Non-Institutional Investors (NIIs):
High-net-worth individuals investing more than ₹2 lakh. Reserved quota is 15%.
Retail Individual Investors (RIIs):
Small investors investing up to ₹2 lakh. Reserved quota is 35%.
In some cases, an additional portion may be reserved for employees or shareholders.
7. Post-Listing Performance and Compliance
Once listed, companies must adhere to continuous disclosure norms, including quarterly results, corporate governance standards, and insider trading rules. SEBI and the stock exchanges monitor compliance to protect investors and maintain transparency.
Post-listing, share prices fluctuate based on demand, supply, and market perception, reflecting the company’s fundamentals and investor sentiment.
8. Role of Technology in India’s IPO System
India’s IPO ecosystem has become increasingly digitalized. Key advancements include:
ASBA system – Simplifies payment and ensures investor protection.
UPI integration – Allows retail investors to apply easily through mobile apps.
T+6 listing timeline – Reduces settlement time and enhances liquidity.
Online bidding platforms – Brokers and exchanges now offer real-time IPO bidding services.
These innovations have significantly increased retail participation in IPOs, especially among young investors.
9. Benefits of IPOs
For companies:
Access to large-scale capital for expansion.
Improved brand visibility and credibility.
Liquidity for existing shareholders and employees.
Easier access to debt financing post-listing.
For investors:
Opportunity to invest early in growing companies.
Potential for short-term listing gains.
Long-term wealth creation through equity growth.
10. Challenges and Risks
Despite its success, India’s IPO market faces certain challenges:
Market volatility – Global events can affect investor sentiment and pricing.
Overvaluation risk – Some IPOs are priced aggressively, leading to post-listing declines.
Information asymmetry – Retail investors may lack access to in-depth financial analysis.
Regulatory delays – SEBI’s scrutiny, while essential, can prolong the process.
However, ongoing reforms and improved investor education have made the system more resilient and transparent.
11. Recent Trends in the Indian IPO Market
A surge in tech-based IPOs (e.g., Zomato, Nykaa, Paytm).
Growing participation from retail and foreign investors.
Introduction of SME and startup platforms to support smaller firms.
Shift toward sustainable and ESG-compliant companies.
Pre-IPO placements and anchor investors strengthening price discovery.
12. Conclusion
India’s IPO system is a well-structured, transparent, and dynamic framework that bridges the gap between private enterprise and public capital. With the rise of digital platforms, regulatory reforms, and investor awareness, IPOs have become a cornerstone of India’s financial growth story. As India’s economy expands and more companies seek global exposure, the IPO ecosystem will continue to evolve, fostering innovation, inclusion, and wealth creation for millions of investors.
Part 3 Institutional Trading Uses of Option Trading
Hedging: Protecting an existing portfolio from adverse price movements.
Example: Buying a Put Option to hedge a long stock position.
Speculation: Betting on price movement direction with limited capital.
Example: Buying Call Options if expecting a stock to rise.
Income Generation: Selling options to collect premiums in range-bound markets.
Example: Covered Call Writing.

Reliance IndustryPrice within FVG range buy above half FVG risk rewar 1:3, sl below 1/2 FVG on closing basis,
Financials (Recent Results, FY25):
Q1 FY25 Net Profit: ₹17,445 crore (down 17.9% QoQ, down 4.5% YoY)
Q1 FY25 EBITDA: ₹42,748 crore (down 9.1% QoQ, up 2% YoY)
Retail Segment: Revenue ₹75,615 crore (up 8.1% YoY), EBITDA ₹5,664 crore (up 10.5% YoY)
Growth drivers: Strong performance from retail, digital (Jio), and oil & gas businesses. O2C (Oil-to-Chemical) business faced a tough environment.
Target Price by Rating Agencies:
Jefferies: Target price ₹1,695, ‘Overweight’ rating
CLSA: Target price ₹1,650, ‘Outperform’ rating
TradingView Analysts (Consensus): Target price around ₹1,693.49, max ₹2,020, min estimate ₹1,370
Traders Union: ₹1,497.15 by the end of 2025, up to ₹2,702.9 by 2029
Future Growth Prospects:
Projected earnings growth: ~8.6% per annum
Projected revenue growth: ~6.3% per annum
EPS (Earnings Per Share) expected to grow by ~8.3% per annum
Key drivers: Expansion in digital (Jio), retail, and renewable/green energy initiatives (aim to be net-zero by 2035), significant investments in new energy value chains like solar, green hydrogen, and fuel cells.
Long-term outlook: Steady, sustainable growth paced by diversification and innovation, though earnings and revenue growth are expected to be slightly lower than the broader Indian market averages.
Summary Table:
Metric Value/Projection
Net Profit (Q1 FY25) ₹17,445 crore
EBITDA (Q1 FY25) ₹42,748 crore
Jefferies Target Price ₹1,695
CLSA Target Price ₹1,650
Analyst Consensus Target ₹1,693 (max ₹2,020, min ₹1,370)
Earnings Growth (annual) 8.6%
Revenue Growth (annual) 6.3%
EPS Growth (annual) 8.3%
Long-term Theme Digital, Retail, Energy Transition
Key Future Catalysts:
Jio (Digital), retail network expansion
Green and renewable energy investments and targets
Ambitious net zero carbon emissions goal by 2035
Long-term investments (Rs 75,000 crore+) in energy transition.
Overall, Reliance continues to have robust financials and long-term growth potential—especially in digital and energy—though overall medium-term growth is projected to be moderate compared with some fast-growing sectors of the Indian market.

Part 1 Understanding the Structure of a CandlestickHow Option Trading Works
Option trading involves two parties:
Buyer (Holder): Pays a premium to acquire the right to exercise the option.
Seller (Writer): Receives the premium and is obligated to fulfill the contract if the buyer exercises the option.
Unlike stock trading, where the ownership of shares is exchanged, options trading revolves around rights and obligations. The buyer’s risk is limited to the premium paid, while the seller’s risk can be unlimited (especially in naked option writing).

Part 7 Trading Master ClassBasic Terminology
To understand option trading, one must know a few key terms:
Strike Price: The price at which the underlying asset can be bought (call) or sold (put).
Premium: The price paid by the buyer to the seller for the option contract.
Expiration Date: The date on which the option contract expires. In India, options typically expire every Thursday (for weekly options) or the last Thursday of the month (for monthly options).
In-the-Money (ITM): A call option is ITM when the market price is above the strike price; a put option is ITM when the market price is below the strike price.
Out-of-the-Money (OTM): A call is OTM when the market price is below the strike, and a put is OTM when the market price is above the strike.
At-the-Money (ATM): When the market price and strike price are roughly equal.

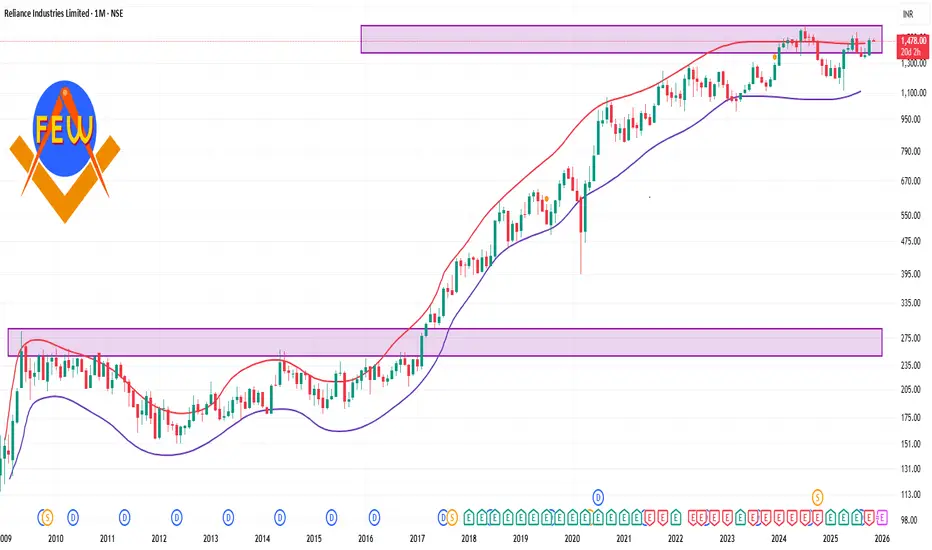
Reliance 1 Month Time Frame ✅ What we know
RIL’s current price is around ₹1,478 per share.
Over the past month, the stock has had a positive return according to some sources: ~ +5–8 %.
Recent support/resistance behaviour: In late Oct/early Nov the stock was fluctuating in the ~₹1,480-₹1,500 range.
The 52-week high is ~₹1,551, and the 52-week low ~₹1,114.85.
The Future of High-Frequency Trading (HFT)Speed, Strategy, and the Next Market Revolution
High-Frequency Trading (HFT) has revolutionized global financial markets over the past two decades. What began as an innovation in trading efficiency has evolved into a highly sophisticated ecosystem where algorithms compete for nanosecond advantages. As technology continues to advance and regulations adapt, the future of HFT stands at the crossroads of artificial intelligence, quantum computing, and evolving market structures. This article explores the future of HFT—its direction, challenges, and the forces shaping its next phase.
1. The Evolution of HFT: From Speed to Intelligence
In its early days, HFT was primarily about speed—executing orders faster than anyone else. Firms invested heavily in low-latency networks, co-location services, and custom hardware to shave off microseconds. Those who executed trades even a fraction of a second faster could exploit small price inefficiencies for massive cumulative profits.
However, as markets became saturated with HFT players and infrastructure speeds reached physical limits (the speed of light), the competitive edge began shifting from raw speed to strategic intelligence. Now, success in HFT increasingly depends on smarter algorithms, superior data analysis, and predictive modeling rather than just faster cables.
The next era of HFT will thus be defined not by who is faster, but by who is smarter.
2. The Role of Artificial Intelligence and Machine Learning
Artificial Intelligence (AI) and Machine Learning (ML) are transforming the way HFT strategies are designed and executed. Traditional HFT algorithms rely on rule-based systems—predefined triggers for buying or selling. But AI-driven systems can analyze complex market data, detect evolving patterns, and make autonomous trading decisions in real time.
AI enables “adaptive trading”—algorithms that learn from past trades, market conditions, and competitor behavior to continuously optimize performance. For instance:
Reinforcement learning models can test millions of trading strategies in simulated markets and refine them dynamically.
Neural networks can detect hidden correlations between assets or anticipate volatility spikes.
Natural Language Processing (NLP) can analyze news headlines, social media, and even central bank statements for sentiment signals.
The future of HFT will likely integrate AI into every layer—from signal generation to order execution—creating a new class of self-evolving trading machines.
3. Quantum Computing: The Next Speed Frontier
While AI adds intelligence to HFT, quantum computing may reintroduce a new frontier of speed. Quantum computers have the potential to process vast datasets and run complex probabilistic models exponentially faster than classical computers.
For HFT, this means:
Faster optimization of multi-variable trading strategies.
Instant analysis of correlations across thousands of assets.
Enhanced encryption-breaking capabilities—posing new security challenges for exchanges.
Although quantum technology is still in early stages, firms like IBM, Google, and major hedge funds are already exploring quantum algorithms for portfolio optimization and risk modeling. Within the next decade, early adopters could gain an edge similar to what early HFT pioneers had in the 2000s.
4. Regulation and Ethical Challenges
The rise of HFT has sparked concerns about market fairness and systemic risk. Critics argue that HFT firms gain unfair advantages, manipulate prices, and contribute to flash crashes—sudden market collapses triggered by algorithmic errors or feedback loops.
In response, regulators worldwide are tightening oversight:
Europe’s MiFID II imposes stricter reporting and transparency rules for algorithmic trading.
The U.S. SEC has increased surveillance on market manipulation techniques like “spoofing” and “quote stuffing.”
India’s SEBI has introduced frameworks for algorithmic trading access, ensuring level playing fields.
Going forward, regulation will likely focus on algorithmic accountability—requiring firms to demonstrate that their trading systems are safe, transparent, and auditable. Ethical AI design will become a competitive necessity, as firms must balance profit with stability and fairness.
5. The Expansion of Alternative Markets
Another major trend shaping HFT’s future is the rise of alternative trading systems (ATS) and dark pools. These off-exchange venues allow large institutions to trade with less visibility, reducing market impact. HFT firms are increasingly participating in these environments, providing liquidity and executing arbitrage between public and private markets.
Additionally, the growing ecosystem of cryptocurrency and digital assets has opened a new frontier for high-frequency traders. Crypto exchanges operate 24/7, offering higher volatility and fewer regulatory constraints—ideal conditions for algorithmic strategies. Firms now deploy HFT systems in Bitcoin, Ethereum, and DeFi markets using similar latency-sensitive techniques as in equities or forex.
As tokenized assets and blockchain-based exchanges mature, HFT will play a central role in ensuring liquidity and price efficiency across decentralized markets.
6. Data is the New Edge
In modern HFT, access to superior data often determines success. The future of trading will revolve around alternative data—non-traditional sources such as satellite imagery, shipping data, social media sentiment, and even IoT sensors.
For example:
Monitoring car counts in retail parking lots to estimate sales.
Tracking weather patterns to predict commodity price movements.
Using real-time shipping data to forecast global supply trends.
Combining alternative data with AI allows traders to predict market movements before they appear on traditional indicators. In the coming years, the firms that master data fusion—the integration of structured and unstructured data—will dominate the HFT landscape.
7. Infrastructure Innovation: From Edge Computing to 5G
As markets globalize, latency reduction extends beyond fiber optics. Future HFT infrastructures will likely leverage edge computing, 5G connectivity, and satellite-based communication systems to push execution times closer to real-time.
Edge computing allows algorithms to run geographically closer to data sources—whether stock exchanges or crypto nodes—minimizing transmission delays. Similarly, 5G networks offer sub-millisecond latency and high reliability, unlocking new opportunities for algorithmic trading in mobile and IoT-enabled environments.
Such infrastructure advancements will also democratize HFT, allowing smaller firms to compete without massive investments in traditional data centers.
8. Human Traders in an Algorithmic World
As algorithms dominate, what happens to human traders? While automation has replaced much of manual execution, humans remain critical in designing, supervising, and ethically guiding trading systems.
In the future, human expertise will shift from execution to oversight and creativity:
Developing novel trading logic and hybrid strategies.
Overseeing risk management systems.
Ensuring compliance with regulatory and ethical standards.
The most successful firms will be those that combine human intuition with machine precision—a symbiosis rather than competition.
9. Challenges Ahead: Risk, Saturation, and Market Fragmentation
Despite its advantages, the HFT ecosystem faces significant challenges:
Market Saturation: With thousands of algorithms competing, profit margins per trade are shrinking.
Systemic Risk: Complex inter-algorithm interactions can amplify volatility, as seen during flash crashes.
Cybersecurity Threats: As trading systems become more connected, they also become more vulnerable to hacking and data breaches.
Future resilience will depend on developing robust, self-correcting systems capable of detecting and neutralizing unintended market feedback loops in real time.
10. The Road Ahead: A Smarter, Faster, Fairer Market
The future of HFT lies not in unrestrained speed but in intelligent automation, ethical oversight, and technological balance. As AI and quantum computing push the boundaries of possibility, the financial ecosystem must ensure that innovation does not compromise stability.
Regulators, exchanges, and traders will need to collaborate to create a framework where automation enhances efficiency while maintaining transparency and fairness.
In short, the next generation of high-frequency trading will be:
Smarter — driven by AI and predictive analytics.
Faster — with quantum and edge technologies.
Safer — through regulation, ethics, and human oversight.
The story of HFT is far from over—it’s merely entering its next, most intelligent chapter.

#Reliance | Cup & Handle Breakout Setup📊 CMP: 1489
💥 Breakout Level: WCB above Handle Neckline
🎯 Pattern Targets: 1730 / 1980+ (16 & 33% from CMP)
🛡 Support: 1456 / 1407-1409
🚧 Resistance: 1527-1551 / 1597-1609
❌ Invalidation Level: Below 1340.60 (WCB)
#CupnHandle #ChartPattern #PriceAction #SwingTrade
📌 Disclaimer: This analysis is shared for educational purposes only. It is not a buy/sell recommendation. Please do your own research before making any trading decisions.
Part 6 Learn Institutional Trading How Option Trading Works
When you trade options, there are two sides to every contract: the buyer and the seller.
Option Buyer: Pays the premium for the right to exercise the option. Their risk is limited to the premium paid but potential profit is unlimited (in calls) or substantial (in puts).
Option Seller (Writer): Receives the premium upfront but assumes an obligation if the buyer exercises the option. Their potential loss can be large, depending on market movement.
For example:
Let’s say stock XYZ is trading at ₹100.
You buy a call option with a strike price of ₹105, paying a premium of ₹3.
If XYZ rises to ₹115 before expiry, your profit = (115 – 105) – 3 = ₹7 per share.
If it stays below ₹105, your loss is limited to ₹3 (the premium paid).

Intraday and Scalping Strategies: Mastering Short-Term Trading1. Introduction
In the fast-paced world of stock trading, two of the most active and adrenaline-filled approaches are intraday trading and scalping. These trading styles revolve around capturing small price movements within the same trading session—without holding positions overnight. Traders using these methods aim to exploit market volatility, volume spikes, and short-term trends to generate profits.
While both intraday and scalping share the same principle—quick trades—they differ in timeframes, position sizes, and profit expectations. Intraday traders hold positions for minutes to hours, while scalpers operate on a much shorter horizon, often seconds or a few minutes. Success in these methods requires discipline, technical analysis mastery, and a deep understanding of market structure and momentum.
2. Understanding Intraday Trading
Definition
Intraday trading, also known as day trading, involves buying and selling financial instruments—such as stocks, indices, commodities, or forex—within a single trading day. Traders aim to profit from short-term price fluctuations without carrying overnight risk.
Objective
The core objective of intraday trading is to capitalize on daily volatility. Traders focus on price action, news-driven moves, and liquidity zones to identify opportunities.
Timeframe
Intraday traders typically use charts ranging from 1-minute to 15-minute intervals for entries and exits, while analyzing higher timeframes like the 1-hour or 4-hour chart for overall trend direction.
3. The Mechanics of Intraday Trading
a. Market Selection
Intraday traders prefer stocks or instruments that have:
High liquidity (easy entry and exit)
Volatility (to create meaningful price movements)
Strong volume participation
For example, large-cap stocks, index futures (like NIFTY, BANK NIFTY), and active currency pairs (like EUR/USD) are common choices.
b. Time of Entry
The most volatile and profitable intraday periods are:
Opening hour (9:15–10:30 AM IST) – when overnight news is absorbed.
Closing hour (2:30–3:30 PM IST) – as institutional traders adjust their positions.
c. Leverage
Intraday traders often use margin trading, which magnifies both profits and risks. For instance, with 5x leverage, a 1% move can yield a 5% profit—or loss.
d. Tools and Indicators
Some of the most popular technical tools used by intraday traders include:
Moving Averages (MA): Identifying short-term trend direction.
VWAP (Volume Weighted Average Price): Used as an intraday benchmark.
MACD & RSI: Momentum indicators signaling strength or weakness.
Support and Resistance Levels: Key zones where price often reacts.
Volume Profile: To identify price levels with maximum trading activity.
4. Popular Intraday Trading Strategies
a. Momentum Trading
Momentum traders seek stocks that are moving strongly in one direction with high volume. The goal is to “ride the momentum” until signs of reversal appear.
Example:
If a stock breaks above a key resistance with high volume, a trader may buy with a stop-loss below the breakout level.
b. Breakout Trading
This strategy focuses on entering positions when the price breaks through well-defined support or resistance levels.
Entry: When price closes above resistance or below support.
Stop-loss: Just outside the breakout zone.
Target: Based on previous swing or risk-reward ratio (often 1:2).
c. Reversal Trading
Contrarian traders look for signs that a trend is about to reverse, such as:
Divergences in RSI or MACD
Candlestick reversal patterns (e.g., hammer, shooting star)
Volume exhaustion
d. Gap Trading
Traders exploit price gaps created by overnight news, earnings, or global cues. For example:
Gap-up open: Short if the stock fails to hold early gains.
Gap-down open: Buy if the price recovers with strong volume.
e. VWAP Strategy
The VWAP line acts as a fair value indicator for intraday traders.
Above VWAP: Indicates bullish bias.
Below VWAP: Indicates bearish bias.
Institutional traders often use VWAP to execute large orders efficiently.
5. Understanding Scalping
Definition
Scalping is the fastest form of trading, involving dozens—or even hundreds—of trades within a single session. Scalpers aim to capture tiny profits (5–10 paise or a few ticks) multiple times throughout the day.
Objective
The goal is to exploit micro-price movements and order flow inefficiencies. Scalpers rely on high liquidity and rapid execution rather than large price swings.
Timeframe
Scalpers operate in seconds to a few minutes. They rely heavily on 1-minute charts, tick charts, and order book depth for decision-making.
6. Key Principles of Scalping
a. Speed and Precision
Scalpers depend on fast execution and tight spreads. Even a few seconds of delay can turn a winning trade into a loss.
b. Small Targets, Strict Stops
A scalper might target 0.05–0.2% profit per trade with equally small stop-losses.
The focus is on high accuracy and consistency rather than big gains.
c. High Trade Frequency
Scalpers execute many trades in a session. For example, if a trader makes 50 trades with a ₹100 average profit, total profit = ₹5,000.
d. Leverage Usage
Because profits per trade are small, scalpers often use higher leverage—but this also magnifies risk.
e. Market Depth Analysis
Scalpers monitor Level II data (order book) to anticipate short-term imbalances in buying and selling pressure.
7. Popular Scalping Techniques
a. Bid-Ask Spread Scalping
Traders take advantage of the small difference between the bid and ask prices.
This method requires ultra-fast execution and often direct market access (DMA) platforms.
b. Moving Average Cross Scalping
Uses two short-term moving averages (e.g., 9 EMA and 21 EMA):
Buy signal: When shorter EMA crosses above longer EMA.
Sell signal: When it crosses below.
c. Price Action Scalping
Relies purely on candlestick patterns and support/resistance zones without indicators. Traders look for micro-trends or breakout candles for quick entries.
d. News-Based Scalping
During economic releases (like inflation data, RBI announcements, or Fed decisions), markets become volatile. Scalpers exploit rapid price moves right after such events.
e. Range Scalping
When markets move sideways, scalpers buy at the bottom of the range and sell near the top repeatedly—profiting from oscillations.
8. Tools and Platforms for Scalping and Intraday Trading
Both strategies demand real-time precision, so traders rely on:
Advanced charting platforms: TradingView, MetaTrader, ThinkorSwim, Zerodha Kite, etc.
Fast order execution: Brokers offering low-latency trading.
Level II data & market depth: To analyze liquidity zones.
Hotkeys and algorithms: For instant order placement.
High-speed internet and dual-screen setups are common among serious intraday traders.
9. Risk Management: The Heart of Short-Term Trading
Both intraday and scalping strategies can yield consistent returns—but only with strict risk control.
Key Rules:
Use Stop-Losses: Never trade without predefined exits.
Position Sizing: Risk only 1–2% of total capital per trade.
Avoid Overtrading: Stick to your setup; don’t chase losses.
Set Daily Limits: Stop trading after hitting max loss or profit goals.
Control Emotions: Greed and fear are the biggest threats in short-term trading.
Risk-Reward Example:
If your stop-loss is ₹2 and target is ₹4, you maintain a 1:2 ratio. Even with 50% accuracy, you remain profitable.
10. Psychology Behind Short-Term Trading
Scalping and intraday trading test a trader’s discipline and emotional control. Success depends not only on strategy but also on mindset:
Patience: Waiting for perfect setups.
Emotional neutrality: No excitement after wins or frustration after losses.
Focus: Constant screen time and attention to detail.
Adaptability: Changing tactics as market conditions shift.
A calm, rule-based approach outperforms impulsive decision-making every time.
11. Best Practices for Successful Execution
Start Small: Begin with small capital and low-risk trades.
Backtest Strategies: Analyze performance on historical data.
Journal Every Trade: Record reasons, outcomes, and emotions.
Avoid News Noise: Focus on technical levels, not random headlines.
Improve Continuously: Refine setups based on win-rate analysis.
12. Combining Scalping and Intraday Approaches
Some professional traders blend both:
Use scalping during volatile periods (opening or news hours).
Use intraday swing trades during calmer, trend-driven phases.
This hybrid model balances frequency and profitability—allowing flexibility based on volatility and market mood.
Conclusion
Intraday and scalping strategies offer exciting opportunities to profit from short-term market movements. They demand speed, discipline, and sharp technical skills. Unlike long-term investing, where time cushions errors, intraday and scalping reward precision and risk management.
The secret to mastering these techniques lies not in trading more, but in trading smart—with a consistent plan, strict stops, and psychological balance. For those willing to put in the effort, the art of short-term trading can become both a profitable skill and a professional edge.
The Rise of Jane Street in Global Finance1. Origins: A Humble Beginning with a Big Vision
Jane Street was founded in 2000 by a small group of traders — Tim Reynolds, Rob Granieri, Marc Gerstein, and Michael Jenkins — with a bold idea: to apply quantitative methods and technology-driven strategies to global trading. What set them apart from the start was their belief that trading was not just about speculation, but about solving complex mathematical problems efficiently.
Starting from a single office in New York City, the firm initially focused on exchange-traded funds (ETFs) — a market that was then in its infancy. ETFs were relatively new instruments, combining the flexibility of stock trading with the diversification of mutual funds. Many financial institutions did not yet understand their pricing complexities, but Jane Street’s founders recognized a goldmine of opportunity in the arbitrage and market-making potential of ETFs.
Through deep statistical analysis, coding expertise, and mathematical precision, Jane Street became one of the first firms to specialize in ETF arbitrage, helping create fair prices and efficient markets for these instruments.
2. Building the Quantitative Core
While most traditional Wall Street firms relied on intuition, experience, and aggressive speculation, Jane Street built its identity around quantitative rigor. Every trading decision was backed by data, models, and algorithms rather than mere hunches.
The firm recruited heavily from top universities, hiring mathematicians, physicists, and computer scientists instead of traditional finance professionals. This helped create a culture that was more akin to a research lab than a typical trading floor.
The use of probabilistic modeling, machine learning, and statistical arbitrage allowed Jane Street to find small inefficiencies in markets across thousands of instruments — equities, bonds, currencies, and derivatives — and trade them profitably.
What truly distinguished Jane Street was its technology-first philosophy. The company built nearly all its systems in-house, ensuring tight control, low latency, and adaptability. Its trading infrastructure allowed for lightning-fast execution — critical in markets where prices change in microseconds.
3. Mastering ETF Trading and Market Making
Jane Street’s early specialization in ETFs paid off enormously. As ETFs exploded in popularity worldwide, the firm became one of the largest ETF liquidity providers globally.
By constantly quoting buy and sell prices, Jane Street played a key role in ensuring that ETFs traded smoothly, even during volatile market conditions. It became the “invisible hand” behind countless trades — earning small margins but at massive volume.
During major market events, such as the 2008 financial crisis and the COVID-19 pandemic, Jane Street’s market-making capabilities were crucial in maintaining stability and liquidity. While many financial institutions pulled back, Jane Street stepped in — buying when others were fearful, providing prices when markets froze, and helping ensure continuous trading.
Their performance during crises cemented their reputation as a reliable backbone of modern markets.
4. Expansion into Global Markets
After conquering ETF trading, Jane Street expanded aggressively into new asset classes and regions. Offices were established in London, Hong Kong, and Amsterdam, transforming the firm into a truly global powerhouse.
The firm’s trading universe now includes:
Equities and ETFs across every major exchange
Fixed income instruments such as bonds and treasuries
Commodities and energy derivatives
Currencies (FX) and cryptocurrencies
Options and futures across various asset classes
Despite this diversification, Jane Street maintained a disciplined approach — only entering markets where its data-driven methods could yield a sustainable edge.
The company also became known for its cross-asset trading strategies — using correlations between asset classes to identify opportunities. For instance, changes in bond yields could signal moves in currencies or equity sectors, allowing Jane Street to capture value across interconnected markets.
5. The Technology Advantage
Technology is the beating heart of Jane Street’s rise. The firm’s internal systems are highly sophisticated, capable of handling massive data volumes in real-time. Every aspect — from pricing models and risk management to communication tools — is custom-built.
Jane Street uses the programming language OCaml for most of its systems, which is unusual in finance. OCaml allows for functional programming, helping the firm maintain robust, error-resistant, and efficient codebases. This gives them a stability advantage over competitors using more traditional financial software stacks.
Moreover, the firm’s automation and low-latency trading systems enable it to make decisions and execute orders faster than the human eye can blink. Yet, unlike many high-frequency trading (HFT) firms, Jane Street avoids reckless speed races. Instead, it uses technology strategically — focusing on smart execution, risk-adjusted returns, and long-term sustainability rather than pure velocity.
6. Culture: Collaboration and Intellectual Rigor
One of Jane Street’s most defining characteristics is its culture. Unlike the cutthroat environment typical of Wall Street, Jane Street emphasizes collaboration, transparency, and intellectual curiosity.
There are no large egos or “star traders” — everyone is encouraged to question, debate, and improve processes collectively. Meetings are analytical discussions rather than emotional arguments. Success is attributed to teams, not individuals.
The firm also has a flat organizational structure, where even junior employees are encouraged to contribute ideas. This approach fosters creativity and innovation — allowing new strategies to emerge from any level of the company.
Employees describe the culture as “academic yet pragmatic,” where curiosity is celebrated, and errors are treated as learning opportunities. This philosophy has helped Jane Street maintain consistency even as it scaled into a global enterprise.
7. The Role in Modern Market Liquidity
In today’s interconnected global markets, liquidity providers like Jane Street play an indispensable role. They ensure that buyers and sellers can transact efficiently without large price disruptions.
Jane Street’s algorithms continuously analyze order books, macroeconomic trends, and microstructure signals to offer tight bid-ask spreads — meaning better pricing for all market participants.
As markets have become more fragmented, with trades spread across dozens of exchanges, Jane Street’s ability to aggregate and balance liquidity across them gives it an enormous competitive advantage.
It’s estimated that the firm now trades trillions of dollars’ worth of securities annually, often accounting for a significant share of ETF trading volume globally.
8. Moving into Fixed Income and Cryptocurrencies
While equities and ETFs remain its backbone, Jane Street has successfully diversified into fixed income and digital assets — two of the most complex trading domains.
In fixed income markets, the firm became a major player in US Treasuries, corporate bonds, and interest rate derivatives. Its data-driven methods allow it to handle the opacity and illiquidity typical of bond markets more efficiently than many traditional banks.
Jane Street’s move into cryptocurrencies was another milestone. Unlike many firms that viewed crypto as speculative, Jane Street approached it with the same quantitative precision it applies to any asset. By becoming an early market maker for Bitcoin ETFs and crypto derivatives, it helped bring institutional stability to digital asset markets.
This adaptability — the ability to understand and trade emerging asset classes — showcases why Jane Street continues to stay ahead of the curve.
9. Risk Management and Discipline
For all its success, Jane Street’s longevity is built on one thing above all: risk control.
The firm operates on the principle that surviving bad days is more important than maximizing profits on good ones. Every trade is evaluated not just for potential return, but for its risk-adjusted value.
Sophisticated real-time risk management systems continuously monitor the firm’s positions across all markets, ensuring exposure stays within carefully defined limits.
Jane Street famously avoids “directional bets.” It doesn’t try to predict where markets will go — instead, it focuses on relative value trading, capturing small inefficiencies that exist between related securities. This disciplined, non-speculative philosophy has kept the firm stable even during turbulent times.
10. Jane Street’s Role in the 21st-Century Market Ecosystem
Today, Jane Street is more than a trading firm — it is a systemic player in global finance. Its algorithms help maintain efficient pricing across continents, its liquidity keeps ETFs and bonds flowing smoothly, and its risk discipline serves as a model for modern financial engineering.
Unlike investment banks, Jane Street doesn’t advise clients or manage portfolios; its business model is purely trading-based. Yet its impact rivals that of major banks.
As markets become increasingly electronic, data-driven, and cross-asset, firms like Jane Street are shaping the future architecture of global finance — where human intuition and machine intelligence coexist in harmony.
11. The Legacy and the Road Ahead
Jane Street’s rise reflects a broader transformation in finance — the shift from intuition-driven trading to algorithmic precision. It represents how intellectual humility, technological excellence, and a focus on long-term sustainability can outperform greed and speculation.
As artificial intelligence, blockchain, and decentralized finance (DeFi) evolve, Jane Street’s future will likely involve deeper integration of AI-powered models, quantum computing simulations, and global regulatory engagement.
But if its history is any guide, the firm will continue to adapt — quietly, intelligently, and effectively — without the need for flashy publicity or loud declarations.
Conclusion
The story of Jane Street is not just the story of a trading firm; it’s a story about the evolution of modern finance itself.
From its origins in ETF arbitrage to becoming one of the most dominant forces in global liquidity, Jane Street has shown that success in markets today comes not from speculation but from discipline, technology, collaboration, and continuous learning.
It stands as a testament to what finance can achieve when math meets markets, when data meets discipline, and when humility meets innovation.
In a world that often celebrates noise, Jane Street thrives in silence — executing billions in trades daily, quietly shaping the very structure of the global financial system.

Part 4 Learn Instiutitonal Trading Intrinsic and Time Value
An option’s premium has two parts:
Intrinsic Value: The amount by which an option is “in the money.”
For a call option, it’s the difference between the current price and the strike price.
For a put option, it’s the difference between the strike price and the current price.
Time Value: Represents the potential for the option to gain more value before expiration. The longer the time to expiry, the higher the time value.
Example:
If a stock is trading at ₹1,200 and a call option with a strike price of ₹1,000 is priced at ₹220, then:
Intrinsic Value = ₹200 (₹1,200 - ₹1,000)
Time Value = ₹20 (₹220 - ₹200)

Financial Future Plan: A Roadmap to Sustainable ProsperityIntroduction
In today’s dynamic and unpredictable world, financial planning is not merely a choice—it is a necessity. The global economy constantly evolves with technological innovation, inflationary pressures, changing job markets, and shifting investment opportunities. Against this backdrop, a financial future plan acts as a guiding framework to achieve financial stability, security, and long-term wealth creation. It provides clarity about one’s income, expenses, savings, investments, and risk management strategies. A well-crafted financial plan enables individuals and families to meet their short-term needs while securing their future aspirations such as education, retirement, home ownership, and legacy planning.
1. Understanding Financial Planning
Financial planning refers to the process of managing one’s finances to achieve life goals systematically. It involves assessing current financial conditions, identifying objectives, and developing strategies to meet those goals through savings, investments, insurance, and debt management.
A financial future plan is both proactive and adaptive. It not only addresses current needs but also anticipates future uncertainties like medical emergencies, job loss, or economic downturns. It provides a sense of control and peace of mind, ensuring that financial decisions are made with a long-term perspective rather than short-term impulses.
2. Importance of Financial Future Planning
The significance of planning for the financial future cannot be overstated. It provides multiple benefits, including:
Goal Achievement:
Financial planning transforms dreams into achievable goals—whether it’s buying a home, starting a business, or ensuring a comfortable retirement.
Budget Discipline:
It instills financial discipline by tracking income and expenses, helping avoid unnecessary spending and encouraging consistent saving.
Crisis Preparedness:
By building an emergency fund and obtaining insurance, a financial plan shields individuals from unexpected financial shocks.
Wealth Creation:
Strategic investments across asset classes like equities, bonds, and real estate ensure capital appreciation and income generation.
Tax Efficiency:
Proper planning helps minimize tax liability through legal avenues like deductions, exemptions, and investment-linked benefits.
Financial Independence:
Ultimately, a sound plan enables individuals to live life on their own terms without depending on others for financial support.
3. Core Components of a Financial Future Plan
A comprehensive financial plan integrates multiple elements that work together to build long-term financial health. These components include:
a) Goal Setting
Every financial journey begins with goal setting. Goals must be SMART — Specific, Measurable, Achievable, Relevant, and Time-bound. Examples include:
Saving ₹20 lakhs for a child’s education within 10 years
Buying a home worth ₹80 lakhs in 15 years
Accumulating ₹1 crore for retirement by age 60
Setting clear goals helps determine the investment amount, time horizon, and risk appetite.
b) Budget Management
Budgeting forms the foundation of financial control. It involves listing monthly income sources, categorizing expenses, and ensuring savings are prioritized. The 50-30-20 rule serves as a useful guideline — allocating 50% to needs, 30% to wants, and 20% to savings or debt repayment.
c) Emergency Fund
An emergency fund acts as a financial cushion against unforeseen circumstances such as job loss, hospitalization, or urgent repairs. Ideally, it should cover 6–12 months of essential expenses and be parked in a liquid, low-risk instrument such as a savings account or money market fund.
d) Debt Management
Debt, if unmanaged, can derail financial progress. A strong plan involves reducing high-interest loans first (like credit card dues or personal loans) and maintaining a healthy credit score. Strategic borrowing for productive assets such as education or housing can be beneficial when aligned with repayment capacity.
e) Insurance and Risk Protection
Insurance is a critical risk-mitigation tool. Life, health, and asset insurance ensure financial security in case of unforeseen events. Term life insurance provides income replacement for dependents, while health insurance covers escalating medical costs, which are often financially draining.
f) Investment Planning
Investment planning transforms savings into wealth. Diversification across asset classes—equities, mutual funds, bonds, real estate, gold, and alternative assets—balances risk and return. Asset allocation should match the investor’s goals, time horizon, and risk tolerance.
Short-term goals may use fixed deposits or short-duration funds.
Medium-term goals may favor balanced or hybrid mutual funds.
Long-term goals can leverage equity mutual funds or direct equity for higher returns.
g) Retirement Planning
Retirement planning ensures financial independence during non-earning years. Early planning leverages the power of compounding, allowing small, regular contributions to grow substantially. Instruments such as the National Pension System (NPS), Public Provident Fund (PPF), and Employee Provident Fund (EPF) serve as reliable long-term savings avenues.
h) Tax Planning
Tax optimization enhances returns by reducing liabilities. Investors can utilize deductions under Sections 80C, 80D, and 80G of the Indian Income Tax Act through investments in ELSS mutual funds, insurance premiums, and health coverage. Efficient tax planning aligns with overall financial goals without compromising liquidity.
i) Estate and Legacy Planning
This ensures a smooth transfer of wealth to the next generation. Drafting a will or creating a trust prevents legal disputes and preserves wealth continuity. It reflects responsible financial stewardship and secures the family’s future.
4. Steps to Create a Financial Future Plan
Crafting an effective financial plan involves a structured, step-by-step approach:
Step 1: Assess Your Current Financial Position
Analyze income, expenses, assets, and liabilities to understand your financial baseline. This assessment reveals strengths, weaknesses, and areas for improvement.
Step 2: Define Clear Objectives
List your short-term (1–3 years), medium-term (3–10 years), and long-term (10+ years) financial goals. Prioritize them based on urgency and importance.
Step 3: Evaluate Risk Appetite
Every investor’s risk tolerance differs based on age, income, and financial obligations. Younger investors can take higher equity exposure, while older individuals may prefer stable income instruments.
Step 4: Design an Investment Strategy
Create a diversified portfolio that aligns with your time horizon and goals. Review and rebalance periodically to adapt to market or personal changes.
Step 5: Build an Emergency Fund
Set aside a dedicated corpus for unexpected expenses before aggressively investing in growth assets.
Step 6: Protect with Insurance
Ensure adequate life and health coverage. For dependents, term insurance with a sum assured 10–15 times the annual income is advisable.
Step 7: Implement and Monitor
Execution is the bridge between planning and success. Regularly review your plan—annually or after significant life events—to ensure alignment with changing circumstances.
5. The Role of Technology in Financial Planning
Digital transformation has revolutionized personal finance management. Today, individuals can track expenses, analyze investments, and plan for goals using fintech platforms, robo-advisors, and mobile applications.
Robo-advisory platforms provide algorithm-driven portfolio suggestions based on individual risk profiles.
Investment apps enable systematic investing through SIPs (Systematic Investment Plans).
AI-driven analytics offer insights into spending patterns, credit behavior, and tax-saving opportunities.
Technology has made financial planning more accessible, transparent, and data-driven, even for beginners.
6. Challenges in Financial Future Planning
Despite its importance, many individuals face hurdles in developing a robust financial plan:
Lack of Awareness:
Many people underestimate the value of long-term planning, focusing instead on immediate needs.
Inflation and Lifestyle Creep:
Rising costs erode purchasing power, while lifestyle upgrades often outpace income growth.
Market Volatility:
Fluctuating markets can test investors’ patience and confidence, leading to impulsive decisions.
Over-Reliance on Debt:
Easy credit availability can create long-term liabilities, restricting future financial flexibility.
Inconsistent Saving Habits:
Irregular savings and lack of budgeting discipline delay wealth creation.
Addressing these challenges requires awareness, education, and a disciplined approach to money management.
7. Financial Future Planning Across Life Stages
Financial priorities evolve over time. Hence, the plan must adapt to life stages:
Early Career (20s–30s):
Focus on budgeting, building emergency funds, and starting early investments. Opt for aggressive asset allocation (higher equity exposure) to leverage compounding.
Mid-Life (30s–50s):
Balance growth and stability. Prioritize child education, home loans, and insurance coverage while maintaining consistent retirement contributions.
Pre-Retirement (50s–60s):
Shift towards capital preservation. Rebalance portfolios toward fixed income, annuities, and low-risk instruments.
Retirement and Beyond:
Emphasize steady income streams, healthcare coverage, and estate management. Avoid risky investments and focus on liquidity and stability.
8. The Psychological Aspect of Financial Planning
Money management is as much about mindset as mathematics. Emotional biases—such as overconfidence, fear of loss, or herd behavior—can distort rational decision-making. Successful financial planning requires emotional intelligence, patience, and goal-focused discipline. Adopting a long-term view helps investors ride through volatility and resist impulsive behavior.
9. Role of Financial Advisors
Professional financial advisors play a crucial role in designing, executing, and monitoring financial plans. They offer expertise in portfolio diversification, tax efficiency, and estate management. With regulatory oversight and fiduciary responsibility, advisors ensure that strategies align with clients’ best interests.
10. Conclusion
A financial future plan is the blueprint for achieving stability, growth, and independence in an uncertain world. It combines analytical rigor with practical wisdom—balancing today’s needs with tomorrow’s aspirations. Whether one earns modestly or abundantly, financial success ultimately depends on discipline, consistency, and informed decision-making.
By budgeting wisely, investing intelligently, and preparing for risks, individuals can secure not only their financial well-being but also the peace of mind that comes with control over their economic destiny. As the saying goes, “A goal without a plan is just a wish.” A financial plan transforms that wish into reality—building a secure, prosperous, and confident future.
