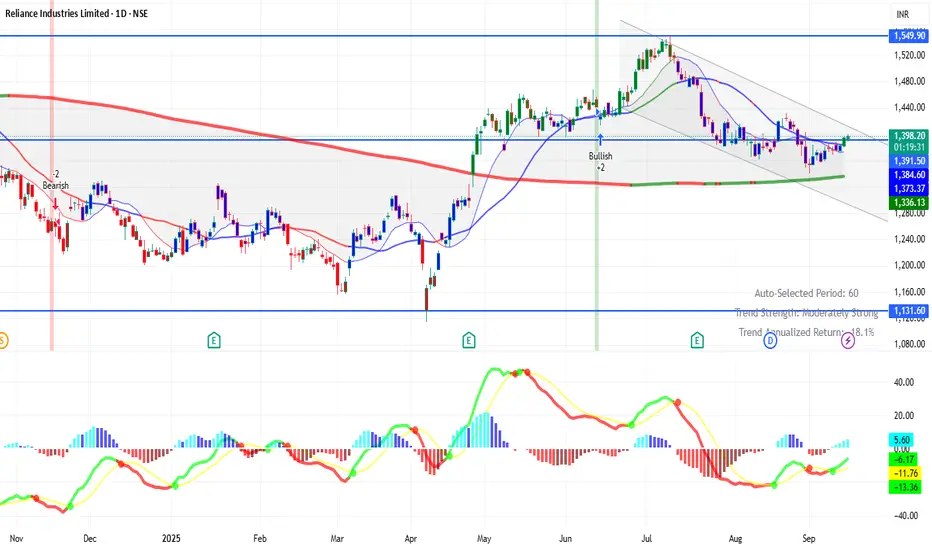
RELIANCE 1D Time framePrice Action
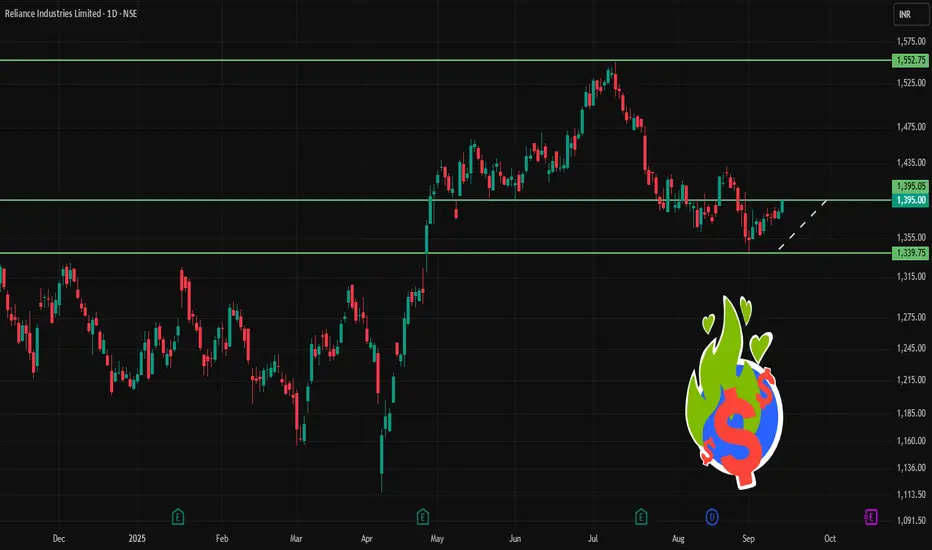
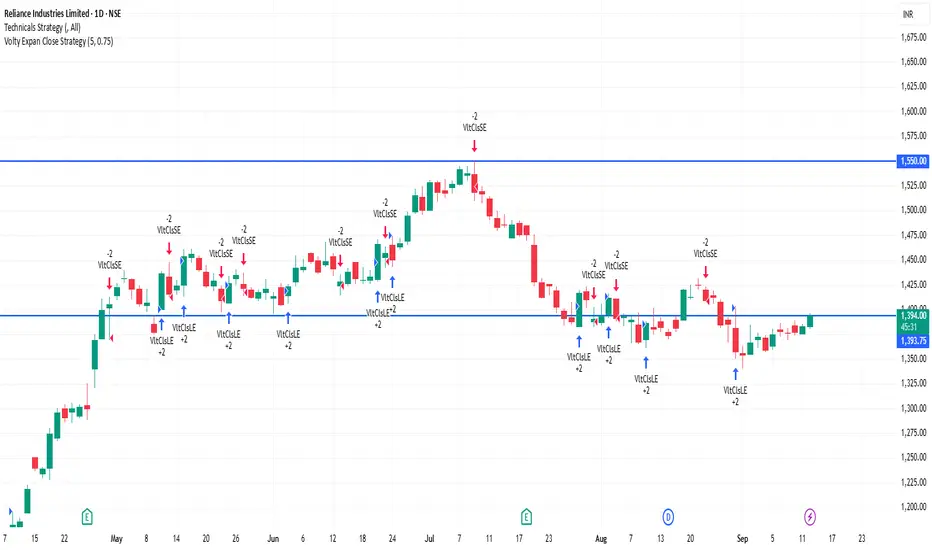
Current Price: ₹1,392 – ₹1,395 (approx)
Previous Close: ₹1,383.50
52-Week Range: ₹1,114.85 – ₹1,551.00
🔹 Support & Resistance
Immediate Support: ₹1,385 – ₹1,375
Next Support: ₹1,369
Immediate Resistance: ₹1,400 – ₹1,406
Next Resistance: ₹1,417
Trade ideas
RELIANCE 1D Time frameCurrent Price & Trend
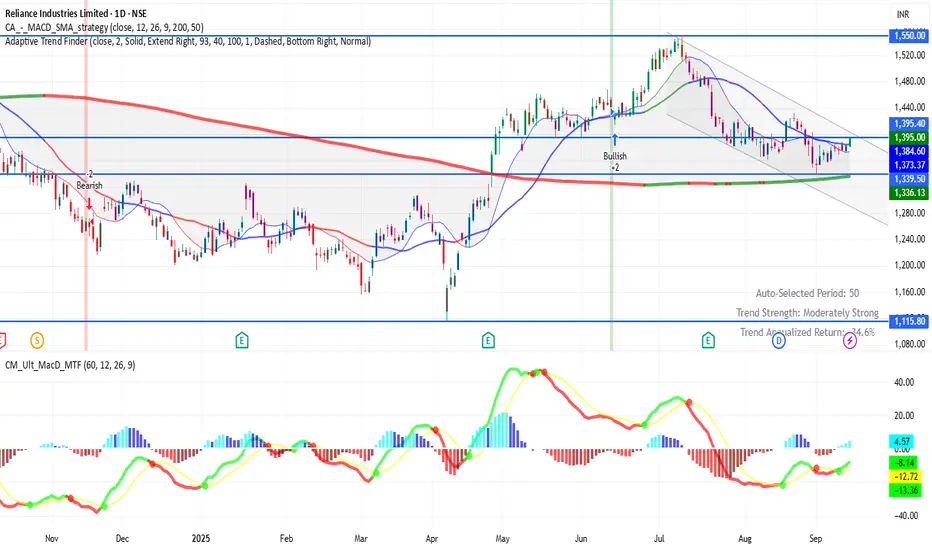
Trading around ₹1,395
Price is below many of its short- to medium-term moving averages (50-day, 100-day), suggesting resistance in that zone.
Indicators & Momentum
Relative Strength Index (RSI) is in mid-range → neither overbought nor oversold, leaning neutral.
MACD is weak to mildly bearish in daily view.
Volume has shown mixed behaviour; resistance zones are not being convincingly broken.
Trend strength indicators show some weakening or caution among buyers.
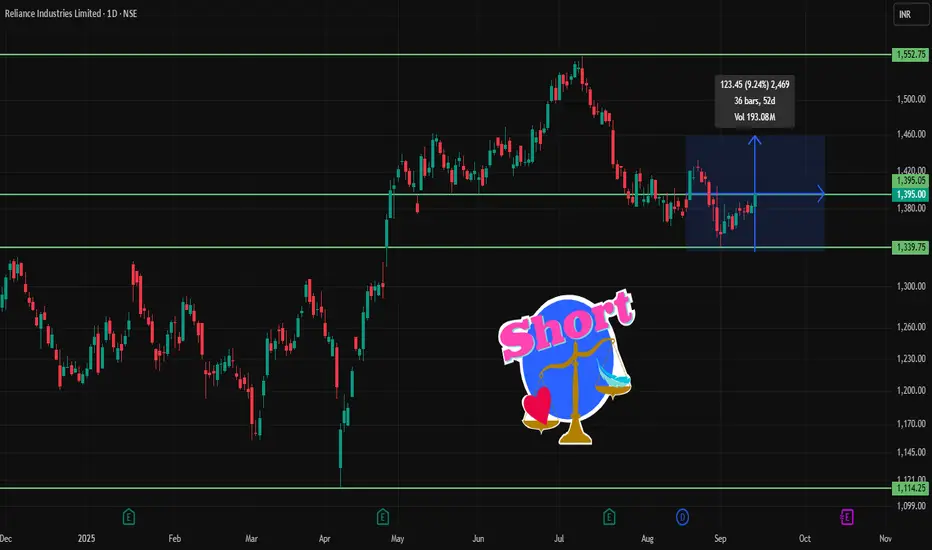
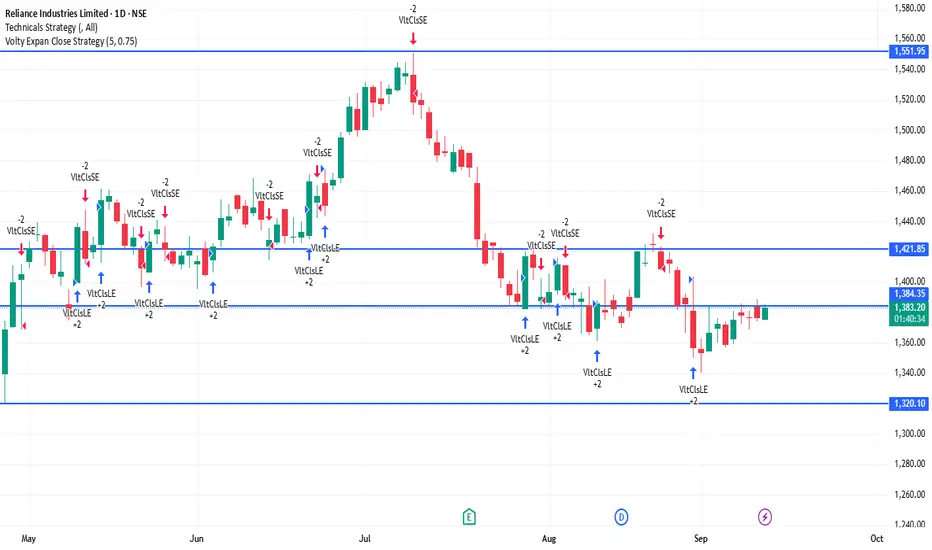
RELIANCE 1D Time frameCurrent Price & Trend
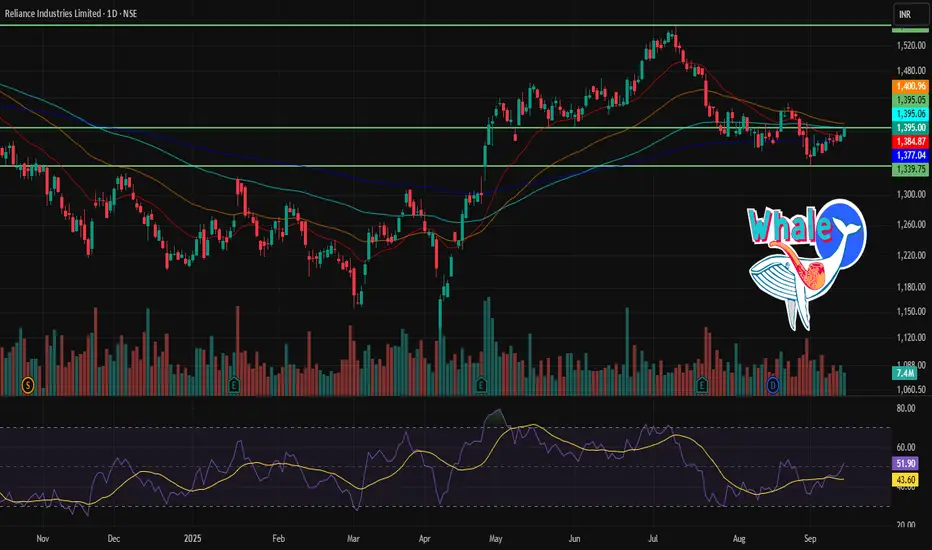
Price: ₹1,395.00
Trend: Neutral to mildly bullish; trading approximately 10.1% below its 52-week high of ₹1,551.00, achieved on July 9, 2025.
Momentum: Indicators suggest a neutral to slightly bullish outlook.
Bullish Scenario
Breakout Above ₹1,396: A sustained move above ₹1,396 could target ₹1,400 – ₹1,420 in the short term.
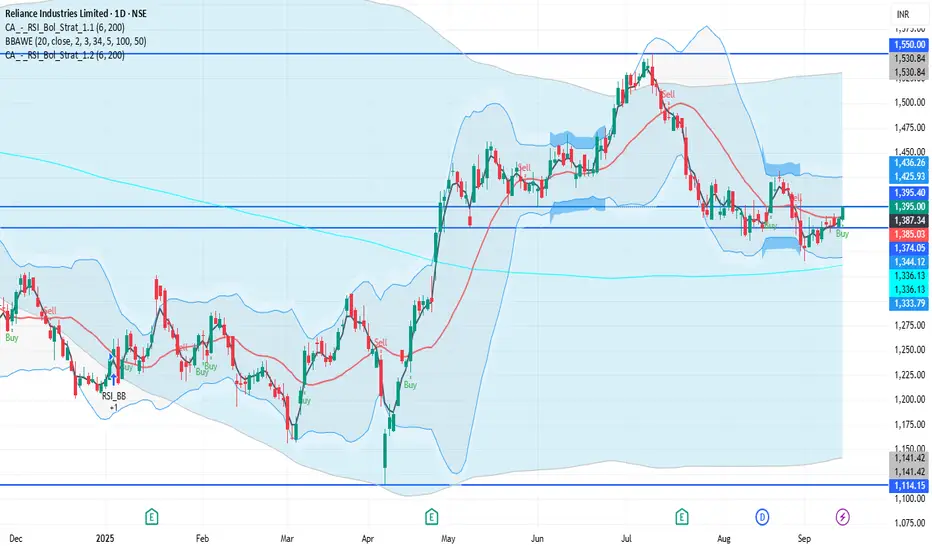
RELIANCE 1D Time frameCurrent Status
Price is around ₹715
The stock has been showing strength recently, with many of its moving averages (short- to long-term) supporting the rise.
Technical indicators like RSI, MACD, ADX etc. lean positive — buyers seem to have the upper hand.
There’s an inverted Head & Shoulders pattern forming, which is a bullish reversal signal if confirmed. Support zones are holding up so far.
Bullish Scenario
If Tata Motors stays above ₹700–705 support and breaks past ~₹720–725 with volume:
Possible upside to ~₹730-₹740
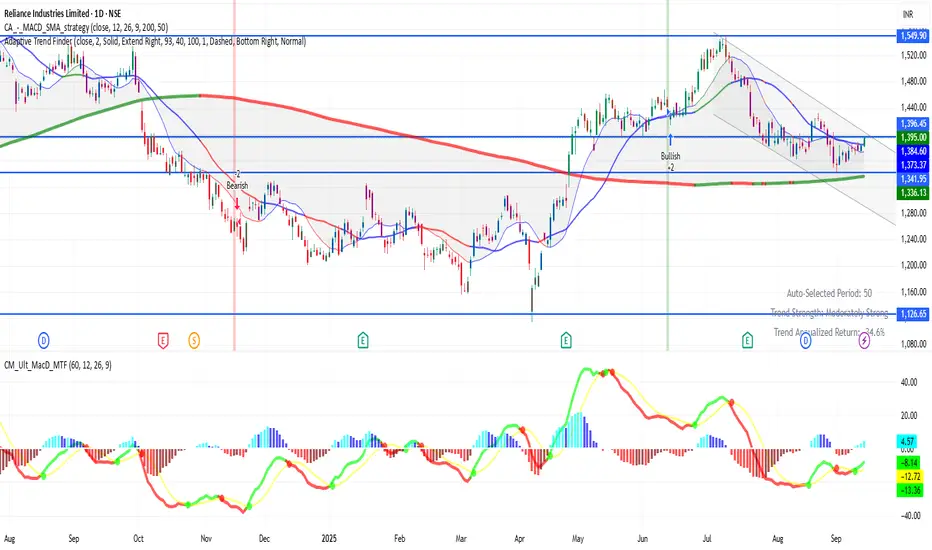
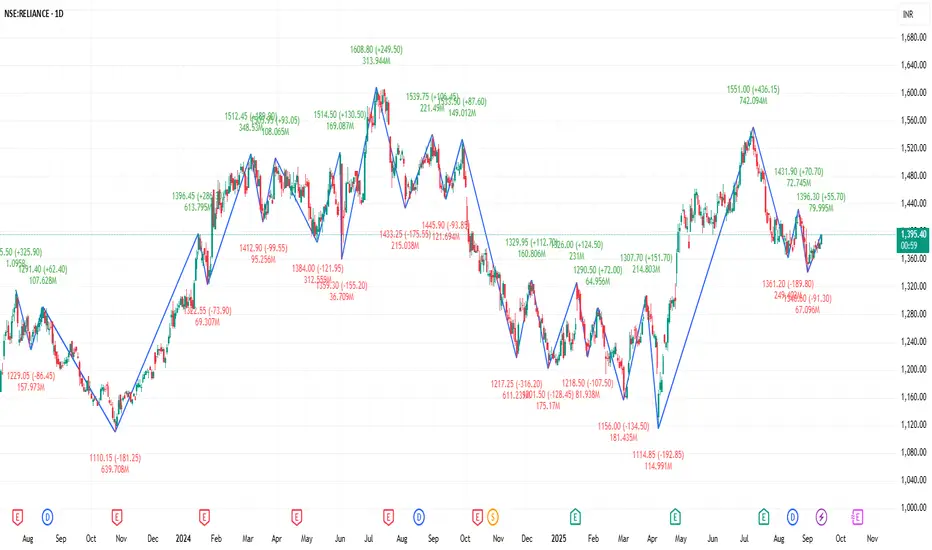
RELIANCE 1D Time frameClosing Price: ₹1,395.00
Day's Range: ₹1,380.50 – ₹1,396.30
52-Week High: ₹1,551.00
52-Week Low: ₹1,114.85
Market Cap: ₹18,87,780 crore
P/E Ratio (TTM): 25.30
Dividend Yield: 0.85%
Book Value: ₹1,100.00
EPS (TTM): ₹55.00
Face Value: ₹10.00
Volume: 7.4 million shares
VWAP: ₹1,388.40
Part 2 Support And ResistanceTypes of Options: Calls and Puts
There are only two fundamental types of options:
Call Option – Gives the right to buy the underlying asset at the strike price.
Example: Nifty is at 20,000. You buy a call option with a strike of 20,100. If Nifty rises to 20,400, you can buy at 20,100 and profit.
Put Option – Gives the right to sell the underlying asset at the strike price.
Example: Infosys is at ₹1,500. You buy a put option with a strike of ₹1,480. If Infosys falls to ₹1,400, you can sell at ₹1,480 and profit.
So, calls = bullish bets; puts = bearish bets.
Key Terminologies in Option Trading
To understand options, you must master the vocabulary:
Strike Price → Pre-decided price where option can be exercised.
Premium → Price paid by the option buyer to the seller.
Expiry Date → Last day the option can be exercised.
In-the-Money (ITM) → Option already has intrinsic value.
At-the-Money (ATM) → Strike price is equal to current market price.
Out-of-the-Money (OTM) → Option has no intrinsic value.
Lot Size → Options are traded in lots, not single shares. For example, Nifty lot = 50 units.
How Option Pricing Works
Options are not priced arbitrarily. The premium has two parts:
Intrinsic Value (IV)
The real value if exercised now.
Example: Nifty at 20,200, call strike 20,100 → IV = 100 points.
Time Value (TV)
Extra value due to remaining time before expiry.
Longer expiry = higher premium because of greater uncertainty.
Option pricing is influenced by:
Spot price of underlying
Strike price
Time to expiry
Volatility
Interest rates
Dividends
The famous Black-Scholes Model and Binomial Model are widely used to calculate theoretical prices.

RELIANCE 1D Time frame📍 Current Price
₹1,395.00 (closing price)
Short-Term Outlook
Bullish Scenario: A sustained move above ₹1,400.00 could lead to a test of the 52-week high around ₹1,551.00.
Bearish Scenario: A drop below ₹1,375.00 may signal a potential pullback toward ₹1,350.00.

RELIANCE 1D Time frame Current Status
Price around ₹1395
Day range: ₹1380 – ₹1396
52-week range: ₹1115 – ₹1551
Key Levels
Support zones: ₹1380 → ₹1370 → ₹1350
Resistance zones: ₹1400 → ₹1410 → ₹1430
Private and Public Banks: Their Role in Trading1. Understanding Private and Public Banks
1.1 Public Banks
Definition: Banks owned or majorly controlled by governments.
Examples: State Bank of India (SBI), Bank of Baroda, Punjab National Bank, and international giants like China Development Bank or Germany’s KfW.
Role: Support trade finance, infrastructure, and developmental goals while also operating commercially.
Trust Factor: Often seen as safer due to government backing.
1.2 Private Banks
Definition: Banks owned by private individuals or institutions, focused on maximizing profits.
Examples: HDFC Bank, ICICI Bank, Axis Bank, JPMorgan Chase, Goldman Sachs, HSBC (though HSBC has mixed ownership).
Role: More aggressive in expanding into global markets, offering innovative trading products, and catering to high-net-worth individuals and corporates.
2. Banking as a Foundation for Trading
Both types of banks serve as pillars of the trading ecosystem. Their activities include:
Providing Liquidity: Banks buy and sell financial instruments, ensuring markets don’t dry up.
Market Making: Many large banks act as intermediaries in forex and derivatives trading.
Credit Access: Traders and corporations rely on bank credit to fund positions.
Clearing & Settlement: Banks ensure smooth processing of trades through clearinghouses.
Risk Management: Offering hedging tools, swaps, options, and forward contracts.
3. Role of Public Banks in Trading
Public banks play a dual role: stabilizing markets while also enabling participation in global trading.
3.1 Trade Finance
Provide letters of credit (LCs) and bank guarantees for exporters/importers.
Ensure trust in international trade transactions.
3.2 Forex Market Interventions
Act on behalf of central banks to stabilize currency markets.
Support importers by ensuring adequate foreign exchange availability.
3.3 Developmental Trading Role
Encourage financing of essential commodities (oil, wheat, fertilizers).
Maintain food and energy security through commodity trade funding.
3.4 Example: State Bank of India (SBI)
India’s largest public bank actively supports exporters through concessional finance.
Plays a key role in rupee-dollar trade settlement, enhancing India’s presence in global forex.
3.5 Strengths of Public Banks in Trading
Government backing ensures trust and credibility.
Ability to fund large-scale infrastructure trading projects.
Acts as a stabilizer during financial crises.
4. Role of Private Banks in Trading
Private banks are more aggressive and profit-oriented, often setting trends in trading innovations.
4.1 Active Participation in Global Markets
Private banks like JPMorgan, Goldman Sachs, Barclays are market leaders in forex, commodities, and equity trading.
Operate investment banking arms specializing in derivatives, structured products, and electronic trading platforms.
4.2 Wealth Management and Private Banking Services
Offer exclusive access to equity trading, hedge funds, and forex products for wealthy clients.
Provide advisory services to optimize portfolio exposure to global markets.
4.3 Technological Edge
Private banks are pioneers in algorithmic trading and high-frequency trading (HFT).
Platforms like HDFC Securities, ICICI Direct offer retail access to stock markets.
4.4 Example: Goldman Sachs
Dominates derivatives and commodities markets.
Provides structured financing deals for corporations to hedge against risks.
4.5 Strengths of Private Banks in Trading
Innovation-driven, offering sophisticated trading products.
Higher efficiency and faster adoption of fintech.
Wider global presence compared to many public banks.
5. Comparative Roles of Public vs Private Banks in Trading
Aspect Public Banks Private Banks
Ownership Government Private shareholders
Risk Appetite Conservative, stability-driven Aggressive, profit-driven
Innovation Moderate High (HFT, derivatives, fintech)
Global Trading Role Primarily support trade finance and forex Market leaders in derivatives, equities, commodities
Trust Factor Strong due to state backing Strong brand but vulnerable in crises
Client Base Mass market, corporates, governments High-net-worth individuals, institutions, corporates
6. Contribution to Different Types of Trading
6.1 Equity Trading
Public Banks: Generally less active in proprietary equity trading but support retail and institutional participation.
Private Banks: Major global equity traders, offering brokerage, research, and portfolio management.
6.2 Forex Trading
Public Banks: Assist central banks in intervention and stabilize exchange rates.
Private Banks: Global market makers, driving trillions of dollars in daily forex transactions.
6.3 Commodity Trading
Public Banks: Finance essential imports like crude oil and food grains.
Private Banks: Dominate speculative trading in oil, gold, and agricultural futures.
6.4 Derivatives & Structured Products
Public Banks: Use derivatives mainly for hedging national interests.
Private Banks: Innovate complex structured products, options, swaps, and exotic derivatives.
7. Challenges Faced by Public and Private Banks in Trading
7.1 Public Banks
Political interference in lending and trade financing.
Slower adoption of new technologies.
Higher burden of non-performing assets (NPAs).
7.2 Private Banks
Higher exposure to speculative risks.
Vulnerable to global financial shocks (e.g., Lehman Brothers collapse).
Criticism for prioritizing profit over public interest.
8. The Changing Landscape: Fintech and Digital Trading
Both public and private banks are facing disruption from fintechs:
Digital trading apps (Zerodha, Robinhood, Groww) are reducing dependency on banks for stock trading.
Still, banks remain indispensable for clearing, settlement, large-scale financing, and providing credibility.
Public banks are slowly catching up with digitization, while private banks continue to push boundaries with AI-driven trading systems.
Conclusion
The roles of public and private banks in trading are complementary rather than competitive. Public banks provide stability, credibility, and developmental support, while private banks bring innovation, speed, and global connectivity. Together, they form the backbone of the international trading ecosystem.
As trading becomes more globalized, technology-driven, and interconnected, both public and private banks will need to adapt rapidly. The future will likely see a hybrid financial system where state-backed security and private sector innovation coexist to shape the world of trading.

RELIANCE 1D Time frame🔢 Current Level
Trading around ₹1,395
🔑 Key Resistance & Support Levels
Resistance Zones:
~ ₹1,400 – ₹1,410 (near-term resistance)
~ ₹1,420 – ₹1,430 (stronger resistance above)
Support Zones:
~ ₹1,380 – ₹1,370 (first support)
~ ₹1,360 – ₹1,350 (secondary support)
📉 Outlook
Bullish Scenario: Holding above ₹1,400 could push price toward ₹1,420 – ₹1,430.
Bearish Scenario: A fall below ₹1,370 may drag it toward ₹1,350 or lower.
Neutral / Range: Likely to trade between ₹1,370 – ₹1,420 until a breakout or breakdown occurs.
RELIANCE 1D Time frame🔢 Current Level
Trading around ₹1,393 - ₹1,395
🔑 Key Resistance & Support Levels
Resistance Zones:
~ ₹1,400 – ₹1,431 (immediate resistance band)
~ ₹1,440 – ₹1,460 (higher resistance if momentum continues)
Support Zones:
~ ₹1,380 – ₹1,370 (short-term support)
~ ₹1,360 (important support below)
📉 Outlook
Bullish Scenario: Holding above ₹1,400 and breaking past ₹1,431 can open the path toward ₹1,440–₹1,460.
Bearish Scenario: A fall below ₹1,370–₹1,360 increases risk of deeper decline.
Neutral / Range: Between ₹1,360–₹1,431, Reliance may move sideways until a clear breakout happens.
RELIANCE 1D Time frame🔢 Current Level
Trading around ₹1,391.50 - ₹1,395.50
🔑 Key Resistance & Support Levels
Resistance Zones:
₹1,396 – ₹1,400 (recent highs; breakout above this may lead to further upside)
₹1,420 – ₹1,430 (stronger resistance above)
Support Zones:
₹1,380 – ₹1,385 (immediate support; failure to hold above this may lead to a decline)
₹1,370 – ₹1,375 (short-term support; a break below this could indicate weakness)
₹1,350 – ₹1,360 (deeper support zone if price dips further)
📉 Outlook
Bullish Scenario: If Reliance Industries holds above ₹1,385, upward momentum may continue. Break above ₹1,400 can open the way toward ₹1,420+.
Bearish Scenario: If it falls below ₹1,370, risk increases toward ₹1,350 – ₹1,360.
Neutral / Range: Between ₹1,385 – ₹1,400, Reliance Industries may consolidate before a directional move.
Institutional Trading Strategies1. Understanding Institutional Trading
Institutional trading refers to trading executed by large organizations, which can move millions or billions of dollars in assets. Unlike retail traders, institutions face unique challenges:
Liquidity impact: Large trades can move markets significantly.
Market timing: Buying or selling at the wrong time can trigger price slippage.
Regulatory considerations: Compliance with SEC or SEBI regulations, insider trading rules, and disclosure requirements.
Information asymmetry: Institutions often have access to research and proprietary data unavailable to retail traders.
Because of these factors, institutions adopt strategies designed to minimize risk and market impact while maximizing returns.
2. Core Institutional Trading Strategies
A. Algorithmic & Quantitative Strategies
Institutions often use advanced algorithms to automate trading and exploit tiny inefficiencies.
VWAP (Volume Weighted Average Price)
Objective: Buy or sell close to the day’s average price.
Mechanics: Break large orders into smaller chunks executed over time.
Benefit: Minimizes market impact and slippage.
TWAP (Time Weighted Average Price)
Objective: Spread trades evenly over a set time.
Ideal for: Illiquid stocks or executing predictable, steady flows.
Liquidity-Seeking Algorithms
Scan multiple venues for the best prices.
Avoids pushing prices against themselves when trading large volumes.
Statistical Arbitrage
Exploits small price discrepancies between correlated securities.
Typically high-frequency, requires strong computing power.
B. Execution-Based Strategies
Focus on how to enter and exit positions efficiently without alerting the market.
Iceberg Orders
Only a small portion of the total order is visible.
Reduces market reaction while enabling execution of large trades.
Dark Pool Trading
Off-exchange venues where large trades can happen anonymously.
Reduces market impact but may have slightly less favorable pricing.
Block Trades
Very large trades negotiated privately.
Often used for institutional rebalancing, mergers, or index adjustments.
C. Directional / Market Bias Strategies
These involve taking a view on price direction but with institutional tools.
Momentum Trading
Buy assets trending up, sell assets trending down.
Often combined with quant signals to detect strong, persistent moves.
Mean Reversion
Exploit temporary price swings away from average value.
Requires sophisticated risk management for stop-losses.
Pairs Trading
Go long on one stock and short a correlated one.
Goal: Profit from relative moves while minimizing market exposure.
D. Fundamental & Event-Driven Strategies
Institutions often trade based on macro, company-specific, or event-driven catalysts.
Merger Arbitrage
Buy target stock and sell acquirer’s stock in announced mergers.
Profits from narrowing spread between deal price and market price.
Earnings Plays
Long/short positions around earnings announcements.
Often uses options for asymmetric risk-reward.
Macro Strategies
Trade based on interest rates, currency movements, commodities, or geopolitical events.
Hedge funds excel here, often using derivatives to leverage insights.
E. Index and ETF Strategies
Institutions moving large money often track or hedge index exposure.
Index Arbitrage
Exploit differences between index futures and underlying stocks.
Requires precise timing and low-latency systems.
ETF Creation/Redemption
Institutions can create or redeem ETF shares to capitalize on pricing inefficiencies.
Minimizes market exposure while arbitraging between ETF price and underlying assets.
F. Portfolio Rebalancing
Large institutions must rebalance periodically:
Quarterly/annual adjustments to match benchmarks.
Use program trading to spread trades over multiple sessions.
Incorporate risk management rules to avoid unwanted exposure.
3. Risk Management in Institutional Trading
Institutions manage risk carefully because a single trade can move millions in losses:
Position Sizing: Limit exposure per trade relative to portfolio.
Stop-Loss & Hedging: Use options, futures, or inverse ETFs.
Diversification: Across sectors, geographies, and instruments.
Liquidity Risk Control: Avoid positions that can’t be exited quickly.
4. Advantages of Institutional Trading
Access to capital for bulk trades.
Information edge through research teams.
Reduced transaction costs via negotiated fees and algorithmic efficiency.
Ability to influence market structure for advantageous execution.
5. Key Challenges
Slippage and Market Impact: Large trades can shift prices.
Regulatory Scrutiny: Must comply with reporting and trading rules.
Technology Dependency: Relies heavily on algorithms and low-latency infrastructure.
Competition: Other institutions using similar strategies can reduce alpha.
6. Examples of Institutional Trading in Practice
Mutual Funds:
Execute index rebalancing using VWAP/TWAP algorithms.
Hedge Funds:
Exploit statistical arbitrage, pairs trading, and macro events.
Investment Banks:
Facilitate block trades and ETF arbitrage for clients.
Pension Funds:
Focus on long-term rebalancing and risk-controlled investments.
In summary: Institutional trading is about strategically moving large amounts of capital while controlling risk, minimizing market impact, and exploiting both structural and event-driven opportunities. Their success lies in technology, research, execution discipline, and risk management rather than guessing market direction.

RELIANCE 1D Time frame🔢 Current Level
RELIANCE is trading around ₹1,391 – ₹1,392
🔑 Key Resistance & Support Levels
Resistance Zones:
₹1,392 – ₹1,396 (near-term resistance; breakout above this may lead to further upside)
₹1,400 (psychological resistance)
₹1,427 (stronger resistance above)
Support Zones:
₹1,380 – ₹1,385 (immediate support)
₹1,370 (short-term support; break below may indicate weakness)
₹1,350 (deeper support zone if selling pressure continues)
📉 Outlook
Bullish Scenario: If RELIANCE holds above ₹1,385, upward momentum may continue. Break above ₹1,396 can open the way toward ₹1,400+.
Bearish Scenario: If it falls below ₹1,370, risk increases toward ₹1,350.
Neutral / Range: Between ₹1,385 – ₹1,396, RELIANCE may consolidate before a directional move.
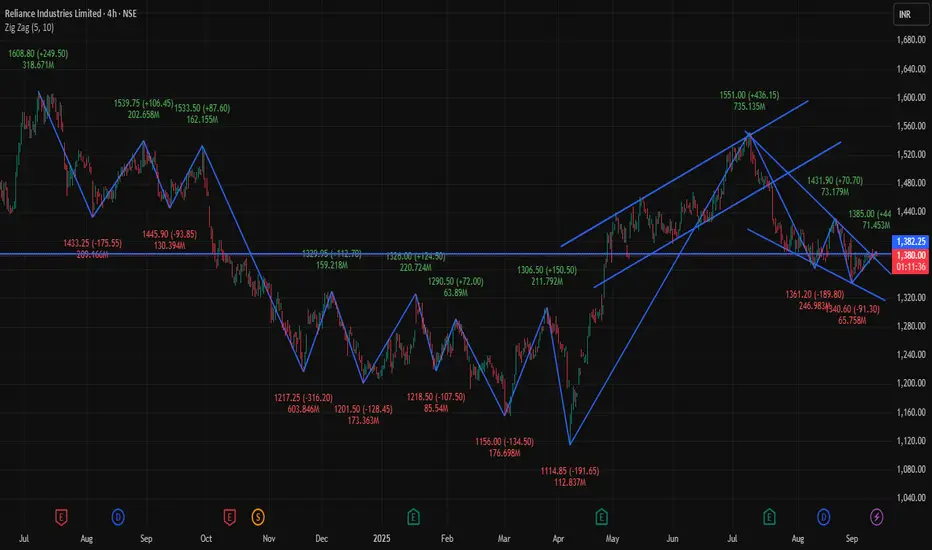
RELIANCE 4Hour 📊 Current Snapshot
Current Price: ₹1,380📈 Trend & Indicators
Trend: Neutral to mildly bullish; trading near short-term resistance.
RSI (14): Neutral zone.
MACD: Positive → indicating mild bullish momentum.
Moving Averages: Short-term averages indicate neutral to slightly bullish outlook.
🔮 Outlook
Bullish Scenario: Break above ₹1,385.50 with strong volume could target ₹1,390.00.
Bearish Scenario: Drop below ₹1,375.00 may lead to further decline toward ₹1,370.00.
Neutral Scenario: Consolidation between ₹1,375.00 – ₹1,385.50; breakout needed for directional move.
📌 Key Factors to Watch
Economic Indicators: Interest rates, inflation, and RBI policy updates.
Sector Performance: Trends in the energy and petrochemical sectors.
Global Cues: Global market trends, US indices, crude oil, and currency movements..90
Day’s Range: ₹1,375.00 – ₹1,385.50
Previous Close: ₹1,377.00
Opening Price (4H): ₹1,376.00
Volume: Approximately 371,445 shares traded
RELIANCE 1D Time frameCurrent Price Action
Reliance is trading around ₹1,384.
Day’s low is near ₹1,375 and high is near ₹1,385.
Price is consolidating in a narrow band after recent gains.
⚖️ Key Levels
Immediate Resistance: ₹1,385 – ₹1,390
Next Resistance: ₹1,400 – ₹1,410
Immediate Support: ₹1,375
Strong Support: ₹1,360 – ₹1,350
📊 Indicators
Moving Averages: Short- and medium-term averages remain bullish, confirming uptrend strength.
RSI (14-day): Around 58–60 → showing bullish momentum, still not overbought.
MACD: Positive crossover → indicates bullish bias.
📈 Outlook
As long as Reliance holds above ₹1,375, the bias stays bullish.
A breakout above ₹1,390 – ₹1,400 can push the stock toward ₹1,410 – ₹1,420.
If it falls below ₹1,375, it could slip toward ₹1,360 – ₹1,350.
Trade Market Reports1. What Are Trade Market Reports?
A trade market report is essentially a data-driven analysis document that captures and interprets trade-related activities in a specific domain. These reports can be categorized into:
International Trade Reports – Cover exports, imports, tariffs, trade balances, and bilateral/multilateral agreements.
Domestic Trade Reports – Focus on regional or sectoral trade activity within a country.
Financial Market Trade Reports – Analyze equity, commodities, currency, derivatives, and bond trading activities.
Sector-Specific Trade Reports – Cover industries such as energy, agriculture, metals, technology, healthcare, or logistics.
They typically include quantitative data (charts, tables, graphs) and qualitative analysis (interpretation, forecasts, risks, and opportunities).
2. Purpose and Importance
Trade market reports serve multiple purposes:
Decision Support: Businesses use them to decide entry/exit in markets.
Risk Management: Traders use them to hedge against volatility.
Policy Making: Governments rely on them for tariffs, subsidies, and trade agreements.
Forecasting: Investors assess future demand and price movements.
Transparency: Provides clarity in otherwise opaque markets.
For example, if a steel trade report shows falling global demand due to construction slowdown, steel companies may reduce production, and governments may adjust import duties.
3. Components of Trade Market Reports
A typical trade market report includes:
Executive Summary – Key findings and highlights.
Market Overview – Description of the market, key players, and historical context.
Trade Flow Analysis – Import-export data, trade balances, trade routes.
Price Trends – Historical price movements and future projections.
Demand-Supply Analysis – Drivers, restraints, and consumption patterns.
Regulatory Environment – Tariffs, trade policies, compliance frameworks.
Competitive Landscape – Profiles of top companies, market share.
Forecasts – Projections for growth, opportunities, risks.
Appendix/Data Sources – Methodology, definitions, references.
4. Types of Trade Market Reports
A. By Geography
Global Reports – e.g., WTO trade outlook, IMF reports.
Regional Reports – EU trade analysis, ASEAN trade updates.
Country Reports – India’s Foreign Trade Policy reports, US ITC reports.
B. By Sector
Commodity Trade Reports – Oil, gold, agricultural products.
Industry Trade Reports – Pharmaceuticals, IT services, automobiles.
Financial Market Reports – Stock exchanges, forex trading volumes.
C. By Frequency
Daily Reports – Stock exchange summaries, commodity updates.
Weekly/Monthly Reports – RBI forex reserves data, shipping freight updates.
Quarterly/Annual Reports – WTO annual trade report, World Bank updates.
5. Sources of Trade Market Reports
Government Agencies – Ministry of Commerce (India), US ITC, Eurostat.
International Organizations – WTO, IMF, UNCTAD, World Bank.
Private Research Firms – McKinsey, Deloitte, Fitch, S&P.
Exchanges – NSE, BSE, CME, LME (London Metal Exchange).
Customs/Logistics Data Providers – Import/export tracking firms.
News & Media – Bloomberg, Reuters, Financial Times.
6. Methodologies Used in Trade Market Reports
Trade market reports rely on a mix of:
Quantitative Methods – Statistical models, regression analysis, econometrics.
Qualitative Methods – Expert interviews, surveys, case studies.
Forecasting Models – Time series, AI/ML-based demand prediction.
Benchmarking – Comparing performance with peers or competitors.
Scenario Analysis – What-if scenarios based on global events (e.g., war, sanctions).
For example, an oil market report may use econometric modeling to predict crude oil demand under three scenarios: normal growth, global recession, or geopolitical crisis.
7. Importance of Trade Market Reports in Financial Trading
Stock Markets – Help in sector rotation strategies.
Forex Trading – Currency reports help predict exchange rate trends.
Commodity Trading – Provide demand-supply balance insights.
Bond Markets – Show macroeconomic stability and trade deficit impacts.
Example: If India’s trade deficit widens sharply, the rupee may depreciate, influencing forex traders and equity investors.
8. Trade Market Reports in India
In India, trade market reports are vital due to its fast-growing economy and heavy dependence on both exports (IT, pharma, textiles) and imports (oil, electronics, gold). Key sources include:
Directorate General of Foreign Trade (DGFT) – Policy-related reports.
Reserve Bank of India (RBI) – Forex, reserves, balance of payments.
Ministry of Commerce & Industry – Monthly export-import data.
EXIM Bank – Research papers on trade financing.
Private Firms – CRISIL, ICRA, CARE Ratings.
9. Global Trade Market Reports – Examples
WTO World Trade Report – Annual global trade trends.
IMF World Economic Outlook – Macroeconomic and trade projections.
UNCTAD Trade & Development Report – Trade and investment focus.
OPEC Oil Market Report – Petroleum production and pricing.
Baltic Dry Index Reports – Global shipping and freight costs.
10. Challenges in Trade Market Reporting
Data Reliability – Developing nations often lack accurate trade data.
Timeliness – Delayed reports reduce decision-making value.
Bias & Interpretation – Private firms may publish biased reports.
Global Uncertainty – Sudden geopolitical shifts (sanctions, wars) make forecasts less reliable.
Overload of Information – Too many reports can confuse stakeholders.
Conclusion
Trade market reports are essential knowledge tools in the modern economy. They help different stakeholders—from policymakers to traders—make informed decisions. In an era of global uncertainty, with shifting supply chains, geopolitical tensions, and financial market volatility, trade market reports provide the clarity, foresight, and actionable insights needed to stay competitive.
Whether it is a daily commodity report for a trader, a sectoral report for a company, or a global trade outlook for policymakers, these reports bridge the gap between raw data and actionable intelligence.
In the future, as AI-driven real-time reporting becomes mainstream, trade market reports will become even more predictive, personalized, and crucial in shaping global commerce.

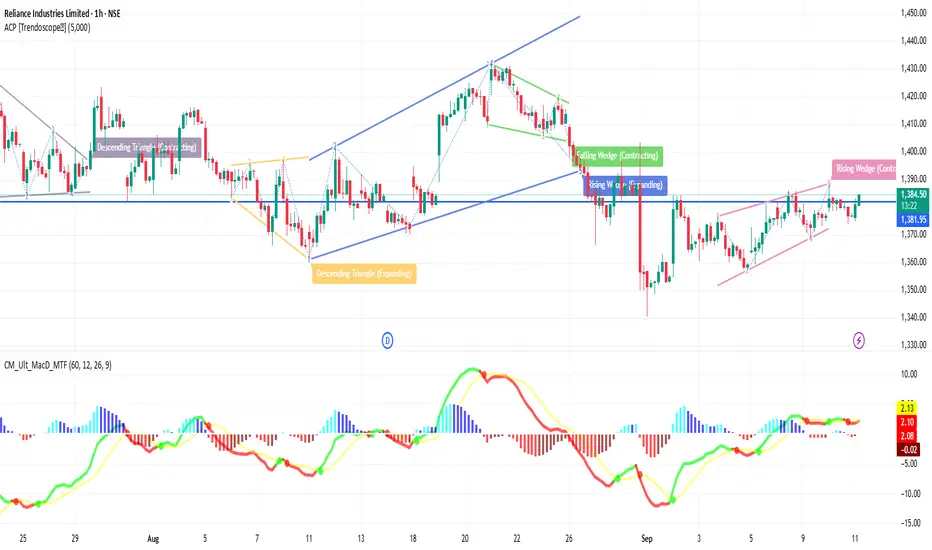
RELIANCE 1H Time framePrice Movement (1H Candles)
Reliance is trading around ₹1,381 – ₹1,383.
On the 1-hour chart, candles are showing sideways consolidation between ₹1,375 (support) and ₹1,385 (resistance).
This tells us that buyers and sellers are in balance, waiting for a breakout.
2️⃣ Support & Resistance Zones
Immediate Support: ~₹1,375 → If this breaks, price may slip toward ₹1,360.
Stronger Support: ~₹1,345 – ₹1,340 → A key zone where buyers may return strongly.
Immediate Resistance: ~₹1,385 → A breakout above can open the way to ₹1,395 – ₹1,400.
Major Resistance: ~₹1,415 – ₹1,420 → If crossed, trend becomes strongly bullish.
3️⃣ Indicators (1H View)
20 EMA: Very close to current price, showing consolidation.
50 EMA: Just below current levels, acting as dynamic support.
200 EMA: Much lower, confirming long-term uptrend is intact.
RSI: Neutral (around 50) → market is not overbought, not oversold.
MACD: Flat → no clear momentum yet, waiting for direction.
4️⃣ Trend Explanation
Right now, the 1-hour trend is neutral to mildly bullish.
If Reliance holds above ₹1,375 – ₹1,360, bulls remain in control.
A move above ₹1,385 with volume can trigger a rally toward ₹1,400+.
But if Reliance breaks below ₹1,360, weakness may appear, and the next fall could be toward ₹1,340.
5️⃣ Conclusion (1H Time Frame)
Sideways Phase: Reliance is consolidating in a narrow band.
Bullish Signal: Above ₹1,385 with good buying volume.
Bearish Signal: Below ₹1,375, deeper support around ₹1,360.
Traders should wait for a breakout or breakdown before taking big positions.
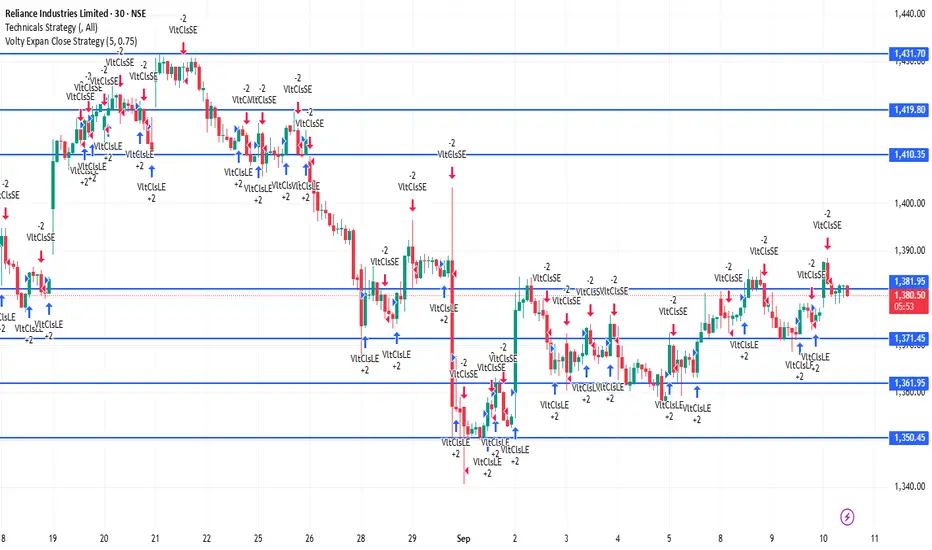
RELIANCE 30Mitunes Time frame📊 Reliance Industries (30M Chart)
Current Zone: Trading around ₹1,380–₹1,382.
🔻 Support Levels:
₹1,375 → Immediate intraday support
₹1,369–₹1,370 → Strong support zone
₹1,362–₹1,363 → Major support
🔺 Resistance Levels:
₹1,382–₹1,383 → Immediate hurdle
₹1,387–₹1,388 → Strong resistance zone
₹1,394–₹1,395 → Major resistance
📈 Trend Outlook (30M):
Above ₹1,383 → Momentum stays bullish, price may push toward ₹1,388–₹1,395.
Between ₹1,369–₹1,382 → Neutral to slightly bullish consolidation zone.
Below ₹1,369 → Weakness may drag price toward ₹1,363 or lower.
Sustainable Finance in India1. Understanding Sustainable Finance
Sustainable finance is broadly defined as financing and investment decisions that take into account not only financial returns but also environmental and social impacts. The core objectives include:
Environmental Responsibility: Supporting initiatives that reduce carbon footprints, promote renewable energy, manage natural resources, and foster climate adaptation.
Social Inclusion: Financing projects that reduce inequality, provide affordable healthcare and education, and support marginalized communities.
Governance Accountability: Ensuring transparency, ethical conduct, and responsible corporate practices.
Sustainable finance is thus the backbone of green growth, which prioritizes ecological balance without compromising development.
2. Evolution of Sustainable Finance in India
The roots of sustainable finance in India can be traced back to the early 2000s, but momentum has significantly increased in the past decade.
2007: India’s first Corporate Social Responsibility (CSR)-linked financing practices gained attention.
2012: Securities and Exchange Board of India (SEBI) introduced mandatory Business Responsibility Reports (BRR) for top listed companies.
2015: The Indian government launched the National Electric Mobility Mission and issued guidelines on renewable energy investments.
2016 onwards: The rise of green bonds and increased global investor interest in India’s renewable energy projects.
2021: India announced the net-zero by 2070 pledge at COP26, creating a roadmap for sustainable financing needs.
2023: SEBI made Business Responsibility and Sustainability Reporting (BRSR) mandatory for top 1,000 listed companies.
This journey reflects India’s gradual integration of sustainability into mainstream finance.
3. Key Drivers of Sustainable Finance in India
Several factors have accelerated the growth of sustainable finance in India:
a) Climate Change Commitments
India has pledged to reduce carbon intensity of GDP by 45% by 2030 and achieve 50% renewable energy capacity by 2030. Financing these transitions requires sustainable investments.
b) Policy and Regulatory Push
Policies like Perform, Achieve, and Trade (PAT) scheme, Renewable Energy Auctions, and SEBI’s ESG reporting mandates have pushed companies to adopt sustainable practices.
c) Investor Preferences
Global and domestic investors are increasingly prioritizing ESG-compliant businesses, leading to a surge in green bonds, ESG mutual funds, and sustainability-linked loans.
d) Corporate Responsibility
Indian companies are realizing that long-term growth depends on environmental stewardship, resource efficiency, and social inclusivity.
e) International Influence
Institutions like the World Bank, Asian Development Bank, and IFC are channeling billions of dollars into India’s green energy and sustainable infrastructure projects.
4. Sustainable Finance Instruments in India
a) Green Bonds
Green bonds are debt instruments where proceeds are used exclusively for financing climate-friendly projects such as solar, wind, waste management, and sustainable transport.
India issued its first green bond in 2015 by Yes Bank.
As of 2023, India has raised over $20 billion through green bonds.
The government launched its first sovereign green bond in 2023 worth ₹16,000 crore.
b) ESG Funds
Mutual funds and asset managers in India are offering ESG-focused funds. As of 2023, ESG funds in India have assets under management (AUM) of over ₹12,000 crore.
c) Sustainability-Linked Loans (SLLs)
Banks and financial institutions are tying loan terms to borrowers’ ESG performance, incentivizing companies to meet sustainability targets.
d) Blended Finance
Combining public and private capital to fund projects like affordable housing, clean water, and renewable energy. This de-risks investments for private players.
e) Carbon Markets
India is developing a voluntary carbon credit market where businesses can trade carbon offsets. This provides a financial incentive for emission reductions.
f) Green Insurance
Insurance products designed to cover renewable energy projects and climate-related risks are gradually emerging.
5. Role of Regulators and Institutions
a) Securities and Exchange Board of India (SEBI)
Introduced BRSR reporting.
Regulates ESG fund disclosures to ensure transparency.
b) Reserve Bank of India (RBI)
Published a Discussion Paper on Climate Risk and Sustainable Finance (2022).
Encouraging banks to assess climate-related risks in lending.
c) Ministry of Finance
Issuing sovereign green bonds.
Partnering with international climate finance organizations.
d) Indian Banks and NBFCs
SBI, ICICI, and HDFC have launched green finance products.
Rural banks are financing solar pumps and microgrids.
e) International Agencies
The World Bank, ADB, and IFC are major contributors to India’s renewable energy financing.
6. Sectors Benefiting from Sustainable Finance
Renewable Energy: Solar, wind, biomass, and hydropower projects.
Electric Mobility: EV infrastructure, charging stations, and battery manufacturing.
Sustainable Agriculture: Organic farming, drip irrigation, and agri-tech solutions.
Green Buildings: Energy-efficient real estate and smart city projects.
Water and Waste Management: Recycling, sewage treatment, and waste-to-energy plants.
Healthcare and Education: Inclusive access to services for underprivileged communities.
7. Challenges Facing Sustainable Finance in India
Despite progress, India faces several hurdles:
Limited Awareness: Many investors and corporates are still unfamiliar with ESG principles.
Greenwashing Risks: Companies sometimes overstate sustainability claims to attract investments.
High Financing Costs: Green projects often involve higher upfront costs and long payback periods.
Regulatory Gaps: Lack of unified sustainability standards across industries.
Limited Domestic Capital: Heavy reliance on foreign investments for green finance.
Infrastructure Bottlenecks: Grid connectivity and storage challenges for renewable energy projects.
8. Case Studies of Sustainable Finance in India
a) ReNew Power
A leading renewable energy company that raised significant funding through green bonds, contributing to India’s solar and wind capacity.
b) State Bank of India (SBI)
Issued green bonds worth $650 million to fund renewable energy and electric mobility.
c) Government’s Sovereign Green Bonds (2023)
Proceeds allocated to solar energy projects, afforestation, and energy-efficient housing.
Conclusion
Sustainable finance is not just a trend in India—it is a necessity. With climate change posing existential risks, the integration of ESG principles into financial systems is essential for long-term stability and growth. India, as one of the world’s fastest-growing economies and a key player in global climate action, must continue to accelerate its sustainable finance journey.
The combined efforts of regulators, corporations, investors, and citizens will shape India’s financial ecosystem into one that is resilient, inclusive, and aligned with the United Nations Sustainable Development Goals (SDGs). From sovereign green bonds to ESG-driven investments, India is laying the foundation of a sustainable financial future that balances profit with purpose, growth with inclusivity, and development with environmental stewardship.

RELIANCE 1D Time frame📍 RELIANCE – 1D Important Levels (Current)
🔹 Support Zones
2,870 – 2,900 → Immediate daily support
2,820 – 2,840 → Strong support; buyers expected here
2,750 – 2,770 → Major support; breakdown may trigger deeper correction
🔹 Resistance Zones
2,950 – 2,970 → Immediate daily resistance
3,020 – 3,050 → Strong resistance zone; breakout may extend bullish momentum
3,120 – 3,150 → Major resistance; if crossed, Reliance may trend strongly higher
⚖️ Daily Trend Outlook
Reliance is in a sideways-to-bullish phase on the daily chart.
Price is consolidating between 2,870 support and 2,970 resistance.
A breakout above 2,970 – 3,020 can open upside towards 3,050 – 3,150.
A breakdown below 2,870 can drag it toward 2,820 – 2,770.
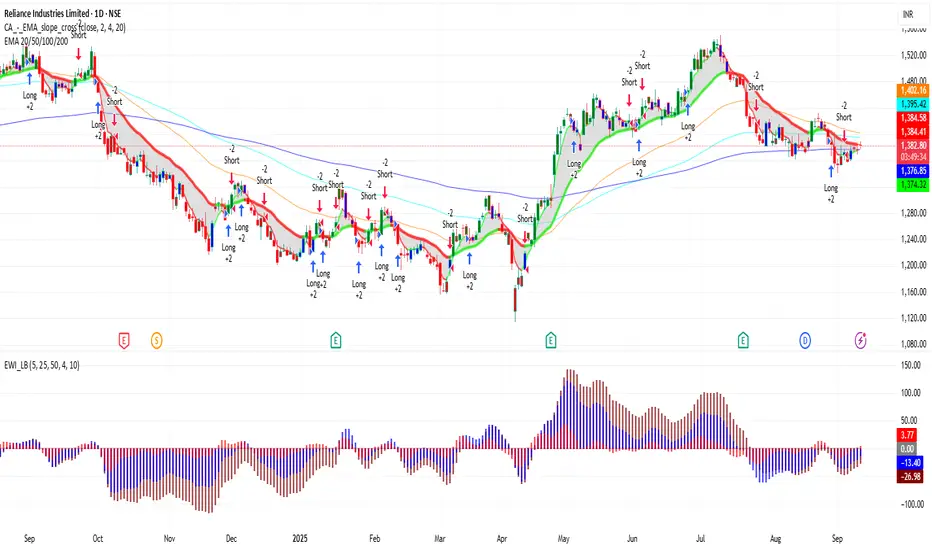
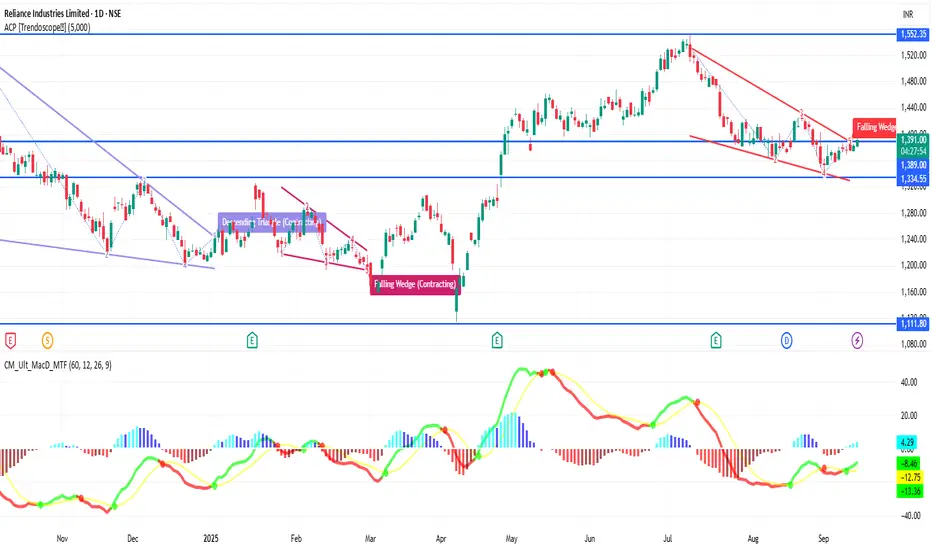
Reliance Moves Steadily in Mild Bullish Channel, Approaches Key Topic Statement:
Reliance is trading within a wide, mildly bullish uptrend, offering clear accumulation opportunities as it nears key moving average levels.
Key Points:
1. The stock is moving in a broad and mildly bullish up-trending channel, making it suitable for structured channel trading
2. A recent double top candlestick pattern has formed, indicating potential near-term resistance
3. The price is currently above the 50-day EMA, and dips below it has historically offered good investment entries
4. The stock is approaching the 200-day EMA, a level that often marks oversold territory and presents strong long-term buying opportunities

Part 2 Support and ResistanceOption Trading Strategies
This is the most exciting part. Strategies range from simple to complex.
Beginner Strategies
Covered Call: Hold stock + sell call → generates income.
Protective Put: Hold stock + buy put → insurance against fall.
Cash-Secured Put: Sell put with enough cash reserved to buy stock if assigned.
Intermediate Strategies
Vertical Spread: Buy one option, sell another at different strikes.
Straddle: Buy call + put at same strike → profit from volatility.
Strangle: Buy call + put at different strikes.
Advanced Strategies
Iron Condor: Combines spreads to profit in low-volatility markets.
Butterfly Spread: Profit from limited movement near strike.
Calendar Spread: Exploit time decay by buying long-term and selling short-term options.
Risk Management in Options Trading
Options can wipe out capital if not managed properly. Key practices include:
Position Sizing: Never risk more than a fixed % of capital.
Stop Loss & Exit Rules: Define risk before entering.
Diversification: Avoid concentrating all trades on one asset.
Understanding Margin: Selling options requires large margin because risks are unlimited.
Hedging: Use spreads to limit risk.
