Deglobalization & Supply Chain Shifts: A Comprehensive AnalysisUnderstanding Deglobalization
Deglobalization refers to the reduction in global interdependence in trade, finance, and production. Unlike globalization, which emphasizes interconnectedness and the free flow of goods, services, and capital, deglobalization involves a partial reversal of these processes. It does not imply complete isolation but reflects regionalization, reshoring, and diversification of supply chains to reduce vulnerability to global shocks.
Key drivers of deglobalization include:
Geopolitical Tensions: Conflicts between major powers, such as the U.S.-China rivalry, have introduced tariffs, sanctions, and restrictions on technology and trade. Companies are forced to rethink reliance on politically sensitive regions. For instance, semiconductor supply chains have seen significant reshaping due to export restrictions on advanced chips.
Pandemic Disruptions: The COVID-19 pandemic exposed vulnerabilities in global supply chains. Lockdowns, port closures, and labor shortages highlighted the risks of concentrated production in a few regions. Companies realized that efficiency-focused supply chains could be fragile, leading to a shift toward resilience and risk mitigation.
Rising Protectionism: Nationalist and protectionist policies, including tariffs and local content requirements, have incentivized companies to reduce dependence on foreign suppliers. Governments are increasingly promoting self-sufficiency in critical sectors such as energy, defense, and healthcare.
Technological Shifts: Automation, AI, and advanced manufacturing techniques reduce the cost advantage of low-wage countries. Companies can now consider reshoring production closer to end markets without sacrificing efficiency.
Implications for Global Supply Chains
Deglobalization has triggered major shifts in supply chain strategies, affecting sourcing, manufacturing, logistics, and risk management. These shifts can be categorized as follows:
1. Reshoring and Nearshoring
Reshoring involves bringing production back to the home country, while nearshoring shifts production to nearby countries within the same region. Companies are increasingly moving away from single-source suppliers in distant regions to reduce geopolitical and logistical risks.
Example: U.S. companies are increasingly sourcing electronics from Mexico or Southeast Asia instead of China.
Benefits include reduced transportation costs, shorter lead times, and better compliance with local regulations.
Challenges include higher labor costs and potential skill gaps in domestic manufacturing.
2. Diversification of Suppliers
Companies are no longer relying on a single country or supplier for critical components. Multi-sourcing strategies reduce the risk of disruption due to political conflicts, natural disasters, or pandemics.
Example: Automotive and electronics companies are diversifying chip suppliers across Taiwan, South Korea, the U.S., and Europe.
Diversification requires advanced supply chain analytics, forecasting, and relationship management to maintain efficiency.
3. Regional Supply Chains
There is a growing focus on regionalization, where companies develop supply chains within a geographic cluster. Regional trade agreements, such as the USMCA (United States-Mexico-Canada Agreement) and RCEP (Regional Comprehensive Economic Partnership in Asia), encourage localized production.
Regional supply chains reduce exposure to long-distance shipping risks, tariffs, and currency fluctuations.
They also promote sustainability by reducing carbon emissions associated with global logistics.
4. Increased Inventory and Buffer Stocks
Just-in-time (JIT) manufacturing, a hallmark of globalization, is being reconsidered. Companies are maintaining higher inventories and safety stocks to withstand supply disruptions.
This shift increases costs but ensures supply chain resilience.
Key industries adopting this approach include pharmaceuticals, semiconductors, and critical machinery.
5. Investment in Digital Supply Chains
Digitalization plays a central role in adapting to deglobalization. Advanced data analytics, AI, IoT, and blockchain enable companies to monitor global supply chain risks in real-time.
Example: Predictive analytics help firms anticipate disruptions, adjust production schedules, and optimize logistics.
Blockchain enhances traceability, crucial for compliance with new local content laws and sustainability regulations.
Sectoral Impacts
Deglobalization affects industries differently:
Technology and Electronics: Heavily dependent on global supply chains, these sectors are relocating production to secure chip manufacturing and critical components. The U.S. CHIPS Act incentivizes domestic semiconductor production.
Automotive Industry: Global auto manufacturing has been disrupted by semiconductor shortages. Companies are regionalizing production and investing in EV battery manufacturing closer to end markets.
Pharmaceuticals: COVID-19 highlighted dependence on China and India for APIs (Active Pharmaceutical Ingredients). Many countries are now investing in local production to ensure health security.
Consumer Goods: Companies are diversifying suppliers to avoid disruptions in goods such as clothing, electronics, and household products.
Economic and Strategic Implications
Deglobalization has wide-ranging consequences:
Higher Production Costs: Shifting production closer to home or diversifying suppliers increases labor, logistics, and compliance costs. This could result in higher consumer prices.
Supply Chain Resilience: Companies are willing to trade efficiency for reliability. Resilient supply chains are less prone to disruption from geopolitical or environmental events.
Shift in Trade Patterns: Emerging markets that previously benefited from globalization may face slower growth as global production becomes more regionalized.
Innovation and Competitiveness: Nearshoring and reshoring may stimulate innovation in domestic manufacturing, robotics, and automation, boosting long-term competitiveness.
Policy and Regulatory Focus: Governments are actively shaping industrial policies to ensure national security and self-reliance. Strategic sectors such as energy, defense, and healthcare will see sustained support.
Challenges and Risks
While deglobalization promotes resilience, it is not without challenges:
Cost Inflation: Regionalization and reshoring are expensive, potentially squeezing profit margins.
Complex Supply Management: Managing multiple suppliers across regions increases operational complexity.
Trade Tensions: Fragmentation of global trade can lead to inefficiencies and reduced economies of scale.
Environmental Concerns: While regionalization reduces shipping emissions, increased local production may increase energy consumption if production relies on carbon-intensive processes.
Future Outlook
The trajectory of deglobalization suggests a hybrid model for global supply chains:
Selective Globalization: Companies will retain global networks for certain low-cost, non-critical products while regionalizing critical components.
Resilience as Priority: Supply chain decisions will prioritize risk mitigation over cost efficiency.
Technological Integration: AI, automation, and digital twins will transform supply chain management, enabling agility and rapid response to disruptions.
Policy-Driven Strategies: Trade policies, subsidies, and geopolitical pressures will continue to shape supply chain structures.
In essence, the future of global supply chains will be less about maximizing cost efficiency and more about building robustness and adaptability. Companies that successfully balance efficiency with resilience will gain a competitive edge in an increasingly unpredictable global landscape.
Conclusion
Deglobalization represents a paradigm shift in the global economy, driven by geopolitical risks, pandemics, protectionism, and technological evolution. The shift is fundamentally reshaping supply chains through reshoring, nearshoring, diversification, and digitalization. While these changes entail higher costs and operational complexities, they also provide an opportunity to build resilient, flexible, and strategically secure supply chains. The companies and nations that adapt effectively to these changes will navigate the challenges of the post-globalization era while ensuring long-term sustainability and competitiveness.
Tesla, Inc.
No trades
What traders are saying

TESLA VIEWTesla
Scenario 1
Wave 4 360, 320 Sustain strongly
Wave 5 583, 640
scenario 2
WAVE 4 360 , 276 Sustain strongly
WAVE 5 670 , 715
223 below sustain or close monthly is invalidation
view is for study purpose only , we are not recommend any trade or investment
Always do your own analysis

Part 12 Trading Master Class With ExpertsRisk in Option Trading
Although options can be powerful, they carry risks:
1. For Option Buyers
Premium can become zero if market doesn’t move as expected.
Time decay works against buyers.
2. For Option Sellers
Potentially unlimited loss in selling naked calls or puts.
Require higher capital and margin.
3. Volatility Risk
Sudden drop in volatility can reduce premium even if direction is correct.
4. Liquidity Risk
Some strike prices have low liquidity, making entry/exit difficult.

Part 1 Ride The Big Moves What is an Option?
An option is a financial derivative whose value is derived from an underlying asset such as a stock, index, or commodity. Options come in two primary forms:
Call Option: It gives the holder the right to buy the underlying asset at a predetermined price (known as the strike price) before or on the expiry date.
Put Option: It gives the holder the right to sell the underlying asset at a predetermined strike price before or on the expiry date.
The buyer of an option pays a premium to the seller (also called the writer) for this right. The seller receives the premium as income but takes on the obligation to buy or sell the asset if the buyer chooses to exercise the option.

Tesla’s Technical Outlook and Future Possibilities Tesla’s Technical Outlook and Future Possibilities
Tesla’s current price action reflects a phase of consolidation after a strong rally, where traders are carefully observing how the stock reacts near crucial levels.
The stock’s position around $439 indicates indecision between buyers and sellers, as it trades between an important support trendline and a well-defined resistance zone.
This structure typically represents a buildup phase before a major directional move.
The inclined support line has shown consistent strength over the past few months, highlighting steady institutional interest even during market pullbacks.
As long as the price respects this trendline, the overall technical bias remains positive. A bounce from this level could reignite bullish momentum, targeting the higher range of $480 to $490.
A breakout above this ceiling could confirm a continuation of the long-term uptrend, possibly leading to new record highs.
On the contrary, a failure to sustain above the inclined support may shift market sentiment toward short-term weakness.
If selling pressure intensifies, the stock could revisit lower supports around $400 or even the $350 area, which served as the base of the previous breakout.
Such a pullback, however, would not necessarily signal the end of Tesla’s larger bullish cycle — it could instead offer a healthier retracement for long-term investors.
Overall, Tesla’s chart reflects a stock at a turning point. The next move will depend on how it behaves around its support structure and whether it can overcome the heavy resistance overhead.
Traders should stay alert to both technical triggers and fundamental news especially updates from the Chinese market, production data, and macroeconomic factors.
Tesla remains one of the most watched stocks globally, and its upcoming moves are likely to set the tone for broader sentiment in the electric vehicle sector.

Part 12 Trading Masster ClassOption Trading in India
In India, options are traded on exchanges like the NSE (National Stock Exchange) and BSE (Bombay Stock Exchange). The most active instruments include NIFTY, BANKNIFTY, and FINNIFTY indices, as well as popular stocks like Reliance, TCS, and HDFC Bank.
Indian traders have access to weekly and monthly expiries, providing short-term opportunities. SEBI regulates derivatives trading to ensure transparency and protect investors. Margin requirements, contract sizes, and position limits are predefined to manage systemic risk.

Part 2 Intraday Master ClassKey Concepts and Terminology
Before understanding how option trading works, it’s important to grasp some basic terms:
Call Option: Gives the holder the right to buy an asset at a specific price (called the strike price) before a set date.
Put Option: Gives the holder the right to sell an asset at a specific strike price before a set date.
Strike Price: The predetermined price at which the underlying asset can be bought or sold.
Premium: The price paid to purchase an option contract. It represents the cost of owning the right to buy or sell.
Expiration Date: The date on which the option contract expires. After this date, the option becomes void.
In-the-Money (ITM): When exercising the option would result in a profit.
Out-of-the-Money (OTM): When exercising the option would not be profitable.
At-the-Money (ATM): When the asset’s market price is equal (or nearly equal) to the strike price.
Underlying Asset: The financial instrument on which the option is based—commonly a stock, index, or commodity.

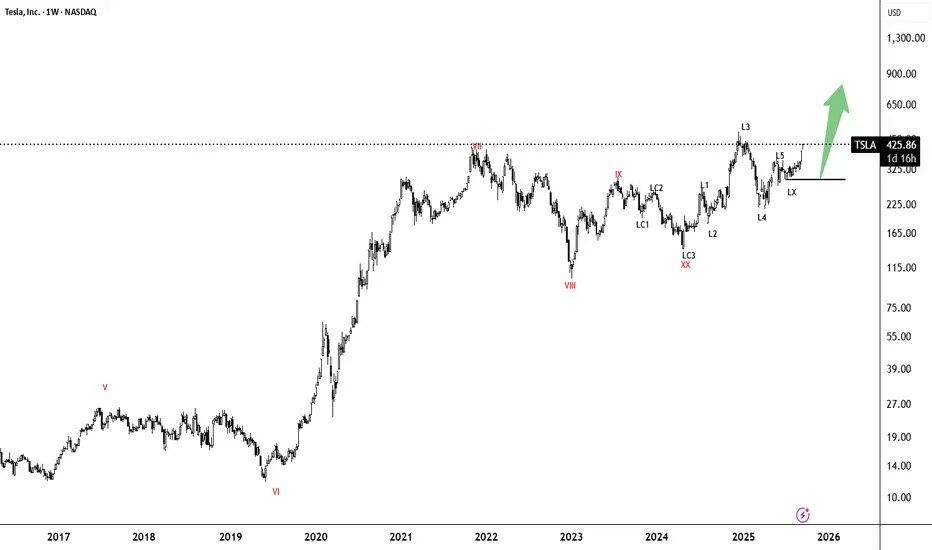
TESLA Bullish Wave CyclesHi everyone
Welcome to intelligent investor, we provide market insights by synchronising and combining all the price action waves from different time frames and gives you single trend.
If you see different keyword in charts, here is the meaning and an explaining video will be made in some time how to read and trade with these waves charts. Still if you have any query , you can leave a comment, i will be happy to answer your query.
Keyword Mean-
S- Short Term Trend
M- Medium Term Trend
L- Long Term Trend
I- Super Trend
(I)- Multiyear Trend
1,2,3,4,5 are wave bullish or bearish wave count
SC,MC,LC,AA,(AA)- mean consolidation or correction
X/XX- Like a joint in a trend or consolidation.
Part 2 Master Candle Stick PatternWhy Trade Options?
Options can be used for different purposes:
Speculation – Traders predict whether prices will rise or fall and buy options to profit from that movement.
Hedging – Investors use options to protect their portfolios from potential losses, like insurance for their investments.
Income Generation – Some investors sell options to earn premiums regularly.

Part 1 Ride The Big Moves American vs. European Options
Options can be American-style or European-style. American options can be exercised any time before expiry, while European options can be exercised only on the expiry date. In India, stock options are American, while index options are European.
In-the-Money, At-the-Money, and Out-of-the-Money
These terms describe an option’s relationship to the current market price:
In-the-Money (ITM): Option has intrinsic value.
At-the-Money (ATM): Strike price equals the current price.
Out-of-the-Money (OTM): Option has no intrinsic value yet.

3 Common Trading Mistakes Traders Should AvoidTraders of all levels, from beginners to experienced professionals, can fall prey to psychological mistakes that can lead to poor trading decisions and ultimately, losses. Understanding and avoiding these common mistakes is crucial for developing a sound trading strategy and achieving consistent success in the markets.
Here are three of the most prevalent trading mistakes traders should strive to avoid:
FOMO (Fear of Missing Out): FOMO is a pervasive emotion that can cloud traders' judgment and lead them to make impulsive decisions based on the fear of missing out on potential profits. This often involves chasing trends or entering trades without proper analysis, increasing the risk of losses.
To combat FOMO, traders should adhere to their trading plan, prioritize discipline, and focus on identifying high-probability trading opportunities rather than reacting to market movements out of fear.
Revenge Trading: Revenge trading is the emotional urge to recoup losses from previous trades by making hasty and ill-advised decisions. This often stems from a desire to prove one's rightness or regain a sense of control over the market.
To avoid revenge trading, traders should cultivate emotional detachment, accept losses as a natural part of trading, and avoid the temptation to let emotions dictate their trading decisions.
Gambler's Fallacy: The gambler's fallacy is the mistaken belief that past events influence the outcome of future events, leading to an assumption that trends will continue indefinitely or that random events can be predicted.
To overcome the gambler's fallacy, traders should recognize that each trade is an independent event with its own unique probabilities, and past performance is not a guarantee of future results. They should rely on sound trading analysis and risk management techniques rather than relying on hunches or superstitions.
By avoiding these common psychological mistakes, traders can develop a more disciplined and rational approach to trading, increasing their chances of achieving long-term success in the markets.

Part 12 Trading Master Class With Experts Common Option Trading Strategies
Options can be combined in different ways to create strategies with defined risk and reward profiles.
Some popular strategies include:
Covered Call – Holding a stock and selling a call option on it (income strategy).
Protective Put – Holding a stock and buying a put to protect downside risk.
Straddle – Buying both call and put at the same strike to profit from big moves.
Strangle – Similar to a straddle, but strikes are different.
Iron Condor – Selling both a call and a put spread to profit from a sideways market.

Part 3 Learn Institutional Trading Introduction to Option Trading
Option trading is one of the most powerful tools in the financial markets. It allows traders and investors to speculate on price movements, hedge risks, and generate income in various market conditions. Unlike traditional stock trading—where you buy or sell shares directly—option trading gives you the right but not the obligation to buy or sell an asset at a predetermined price within a specified period.
In simple words, options give you flexibility. You can profit whether the market goes up, down, or stays flat—if you know how to use them properly. However, this flexibility also brings complexity. To understand option trading deeply, one needs to grasp how options work, the factors affecting their price, and the strategies traders use to make consistent returns.

Buy idea in TeslaThe stock is in strong uptrend and open with a break away gap up giving ascending triangle breakout or Cup and Handle Pattern after Nov 2021. This stock is trading above 60 RSI on D,W,M which show strong momentum. If the stock sustain above 425 pattern for sometime then the stock can give a good return in 1-2 year perspective.
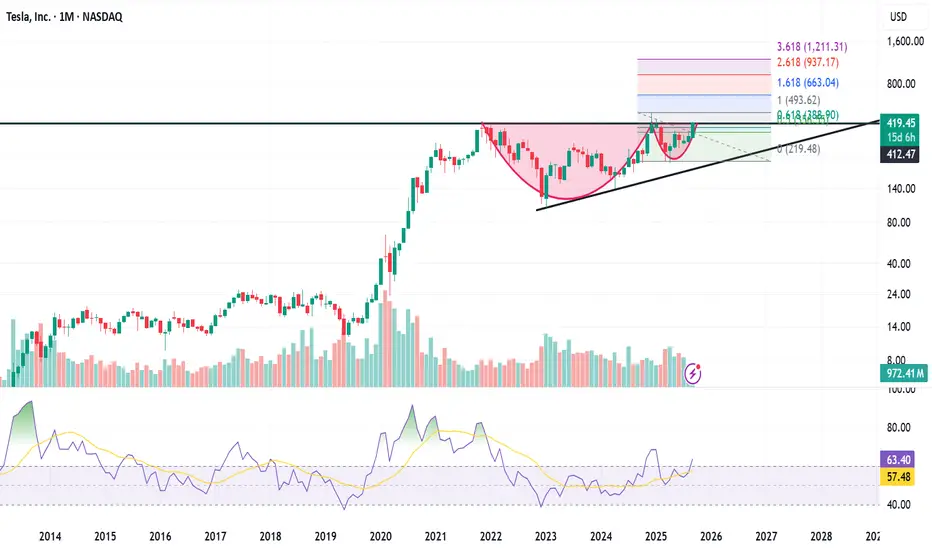
Tesla - Flag & Pennant Pattern BreakoutTesla breaking out of a Flag & Pennant Pattern that may take it to new all time highs
We are not positive about TeslaThe impact of tariffs and expiring EV credits is expected to pressure future US deliveries and regulatory credit revenue in the near term
Elon Musk: Well, we're in this weird transition period where we will lose a lot of incentives in the US. Slab incentives actually in many other parts of the world. But we'll lose them in the US. Across all of it at the relatively early stages of autonomy. On the other hand, autonomy is most advanced and most available from a regulatory standpoint in the US. Does that mean we could have a few rough quarters? Yeah. We probably could have a few rough quarters. I'm not saying that we will, but we could. Q4, Q1, maybe Q2.
Revenue -12% y/y ( decline for the first time in 10 years)!!!
EPS 0,27 $ agj vs 0,39 $ estimated
FCF -89% y/y but still positive ( just 146 M$)
CAPEX for 2025 increased
EBITDA dropped by 7.8%.
Price to Sales 12,7
P/B 14
Expensive
We expect declining of the stock price to 210 $
And, yes, many still regard Tesla as a car manufacturer, but this is not a correct view of the company. Later in our blog we will touch on the question of how to correctly look at the brainchild of Elon Musk.

TSLATSLA
CMP: $340
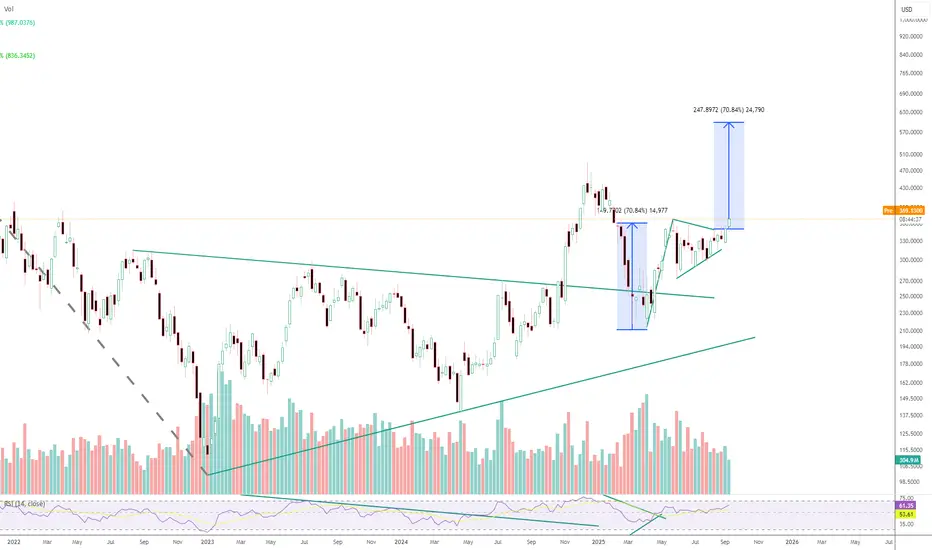
After nearly 4.6 years of sideways consolidation , TSLA has broken out and looks positioned to enter a new trading zone.
Support Zone : $300–336
Supply Zone (near-term resistance) : $385–428
With a 3-year perspective , the setup indicates potential for ~60% upside .
Stop Loss : $280 (to manage risk on this early entry).
The recent weekly triangle breakout supports the bullish view, though this remains an early and relatively risky entry with a tight stop strategy.

TESLA LONG VIEWstrong technical setups with bullish bias across multiple indicators and consolidation ready for breakout. Key levels to watch: $330–332 resistance, then $338+600

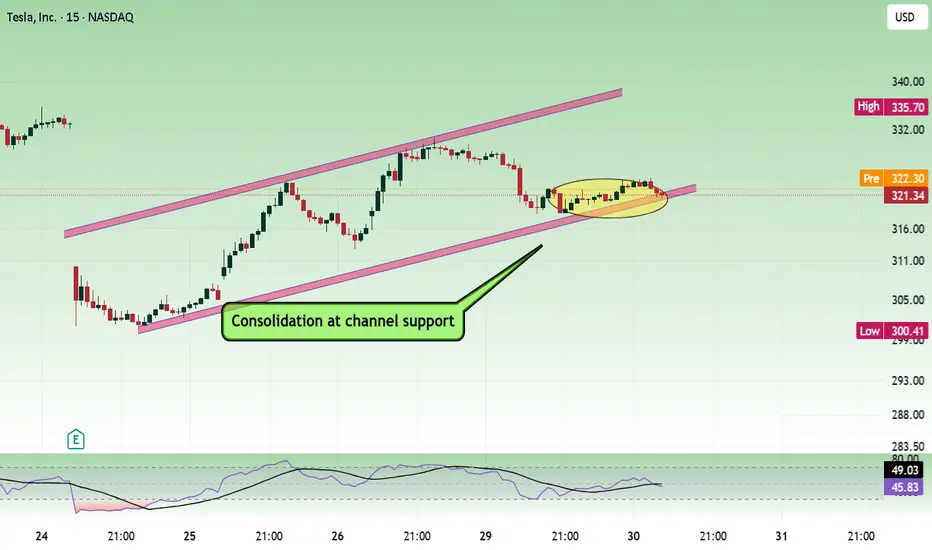
TeslaAs per the pattern formation, price is moving within an ascending channel and also consolidating at the lower trend line of the channel. If price gains strength, it can move towards upper trend line of the channel.
Buy above 324 with the stop loss of 321 for the targets 327, 330, 332 and 336.
If channel support is not holding and price gains bearish strength, can sell below 318.
Sell below 318 with the stop loss of 321 for the targets 315, 312, 309 and 306. 300 - 302 is a strong support zone.
Always do your own analysis before taking any trade.
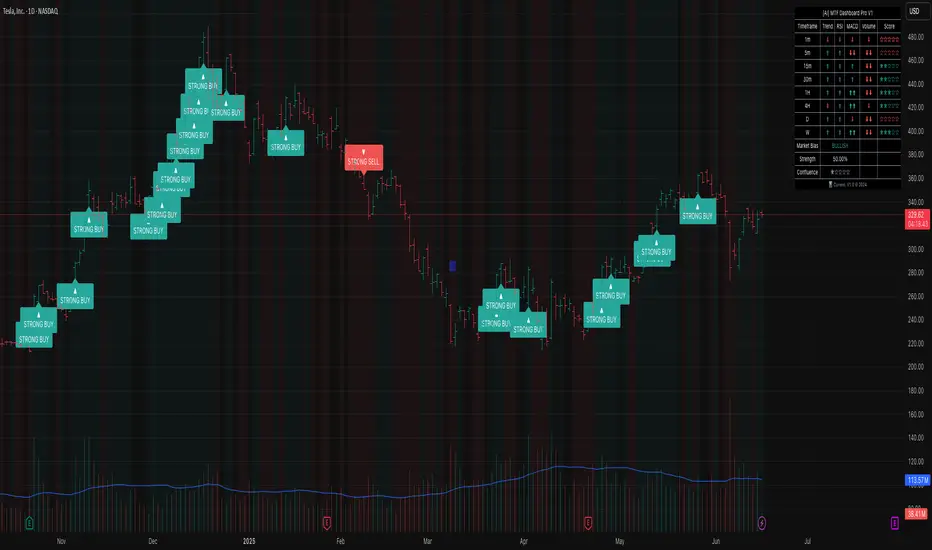
Tesla Strong Advanced MTF Dashboard Pro █ 9 Timeframes + Signals# 🚀 Advanced MTF Dashboard Pro █ 9 Timeframes + Signals
## The Ultimate Multi-Timeframe Analysis Dashboard - See Everything at a Glance!
Transform your trading with the most comprehensive MTF dashboard on TradingView. This professional-grade tool analyzes 9 timeframes simultaneously, giving you instant market insights that would normally require multiple charts and hours of analysis.
---
## ⚡ KEY FEATURES
### 📊 **9-Timeframe Analysis**
✅ **Complete Coverage** - 1m, 5m, 15m, 30m, 1H, 4H, Daily, Weekly, Monthly
✅ **Toggle Control** - Show only the timeframes you need
✅ **Real-Time Updates** - All data refreshes automatically
✅ **Clean Organization** - Professional table layout
✅ **Smart Positioning** - Place dashboard anywhere on chart
### 🎯 **Multi-Indicator Analysis Per Timeframe**
✅ **Trend Direction** - EMA cross-based trend detection
✅ **RSI Momentum** - Overbought/oversold conditions
✅ **MACD Signals** - Histogram direction and strength
✅ **Volume Analysis** - Above/below average volume
✅ **Confluence Score** - Combined signal strength rating
### 💎 **Advanced Signal System**
✅ **Visual Status Indicators**
- ⬆⬆ Strong Bullish
- ⬆ Bullish
- ➡ Neutral
- ⬇ Bearish
- ⬇⬇ Strong Bearish
✅ **Confluence Ratings**
- ★★★★★ Excellent Setup
- ★★★★☆ Strong Setup
- ★★★☆☆ Good Setup
- ★★☆☆☆ Fair Setup
- ★☆☆☆☆ Weak Setup
### 📈 **Market Analysis Dashboard**
✅ **Overall Market Bias** - Instant bullish/bearish/neutral assessment
✅ **Bias Strength %** - Quantified market direction strength
✅ **Confluence Score** - Overall setup quality rating
✅ **Trend Alignment** - See when multiple timeframes agree
✅ **Smart Filtering** - Focus on high-probability setups
### 🔔 **Professional Alert System**
✅ **Strong Signal Alerts** - When confluence is extremely high
✅ **Bias Change Alerts** - Market direction shifts
✅ **Custom Messages** - Detailed alert descriptions
✅ **Multi-Timeframe Alerts** - Know which timeframes triggered
✅ **Smart Frequency** - No alert spam
### 🎨 **Customization Options**
✅ **4 Color Schemes** - Professional, Classic, Vibrant, Dark
✅ **6 Table Positions** - Top/Bottom/Middle + Left/Right
✅ **4 Text Sizes** - Tiny to Large
✅ **Toggle Features** - Show/hide any component
✅ **Visual Preferences** - Background colors, signals, etc.
---
## 🎯 PERFECT FOR
• **Multi-Timeframe Traders** - See all timeframes without switching
• **Confluence Traders** - Find high-probability aligned setups
• **Day Traders** - Quick market assessment for entries
• **Swing Traders** - Identify major trend alignments
• **Scalpers** - Spot micro-trends within larger trends
---
## 📱 WORKS ON ALL MARKETS
✅ **Forex** - All currency pairs
✅ **Crypto** - Bitcoin, Ethereum, all altcoins
✅ **Stocks** - Individual stocks and ETFs
✅ **Indices** - S&P 500, NASDAQ, etc.
✅ **Commodities** - Gold, Oil, Silver
✅ **Futures** - All futures contracts
---
## ⚙️ QUICK START GUIDE
### 1️⃣ **Add to Chart**
Click "Add to Favorites" and apply to any chart
### 2️⃣ **Configure Timeframes**
- Toggle ON the timeframes you trade
- Toggle OFF timeframes you don't need
### 3️⃣ **Customize Appearance**
- Choose your color scheme
- Select table position
- Adjust text size for your screen
### 4️⃣ **Interpret Signals**
- **Green rows** = Bullish timeframes
- **Red rows** = Bearish timeframes
- **More arrows** = Stronger signals
- **More stars** = Better confluence
### 5️⃣ **Set Alerts**
Right-click indicator → "Add Alert" → Choose conditions
---
## 📚 TRADING STRATEGIES
### **Strategy 1: Confluence Trading**
1. Wait for 70%+ timeframes to align (same direction)
2. Enter when confluence score shows ★★★★ or better
3. Use lower timeframe for precise entry
4. Higher timeframes for trend direction
### **Strategy 2: Timeframe Divergence**
1. Look for lower TFs turning while higher TFs trend
2. Potential reversal when multiple TFs flip
3. Confirm with volume increase
4. Best at major support/resistance
### **Strategy 3: Momentum Alignment**
1. All momentum indicators (RSI/MACD) align
2. Volume confirms direction
3. Enter on pullback to moving average
4. Exit when momentum diverges
---
## 🛠️ INDICATOR SETTINGS EXPLAINED
### **Timeframe Selection**
Each timeframe can be toggled on/off. Only active timeframes:
- Appear in the dashboard
- Count toward confluence
- Trigger alerts
### **Indicator Parameters**
- **Fast/Slow EMA**: Trend detection sensitivity (9/21 default)
- **RSI Length**: Momentum period (14 default)
- **MACD Settings**: Signal generation (12/26/9 default)
### **Visual Settings**
- **Table Position**: Where dashboard appears
- **Text Size**: Readability adjustment
- **Color Scheme**: Match your chart theme
### **Signal Settings**
- **Show Trend Strength**: Display trend indicators
- **Show Momentum**: RSI/MACD columns
- **Show Volume**: Volume analysis column
- **Show Confluence**: Star rating column
---
## 🌟 WHY CHOOSE ADVANCED MTF DASHBOARD PRO?
### **🤖 AI-Enhanced Analysis**
Our algorithms intelligently weight signals based on timeframe importance and market conditions, providing more accurate confluence scores than simple averaging.
### **⚡ Lightning Fast**
Optimized code ensures smooth performance even with all 9 timeframes active. No lag, no delays, just instant insights.
### **👁️ See Everything**
Stop switching between charts. One glance shows you everything you need to make informed trading decisions.
### **🎯 Precision Timing**
Identify the exact moment when multiple timeframes align for the highest probability trades.
### **📈 Proven Results**
Based on professional trading techniques used by institutional traders, now accessible to everyone.
---
## 💡 PRO TIPS
1. **Higher Timeframes = Stronger Trends** - Give more weight to 4H/Daily/Weekly
2. **Confluence is Key** - Best trades have 80%+ timeframe agreement
3. **Volume Confirms** - Look for volume spikes with signal alignment
4. **Patience Pays** - Wait for ★★★★★ setups for best results
5. **Risk Management** - Even perfect setups can fail, always use stops
---
## 🎯 ADVANCED USAGE
### **For Scalpers**
- Focus on 1m, 5m, 15m
- Quick confluence checks
- Rapid signal changes
### **For Day Traders**
- Use 5m to 1H primarily
- 4H for overall bias
- Balance speed with reliability
### **For Swing Traders**
- Emphasize 4H, Daily, Weekly
- Monthly for major trend
- Slower but more reliable signals
---
## 📞 SUPPORT & COMMUNITY
- 💬 **Comments Section** - Ask questions below
---
## ⚠️ RISK DISCLAIMER
Trading involves substantial risk of loss. Past performance does not guarantee future results. This indicator is for educational purposes and should not be considered financial advice. Always do your own research and use proper risk management.
---
## 🔄 VERSION HISTORY
**v1.0** (Current)
- Initial release
- 9 timeframe analysis
- 4 indicators per timeframe
- Confluence scoring system
- Full alert integration
- 4 color schemes
---
## 🙏 CREDITS
Developed by
Inspired by institutional multi-timeframe analysis techniques
---
**🏷️ TAGS**
#MTF #MultiTimeframe #Dashboard #Confluence #TrendAnalysis #Momentum #RSI #MACD #Volume #DayTrading #SwingTrading #Scalping #Forex #Crypto #Stocks #TechnicalAnalysis #TradingDashboard #MarketAnalysis #AI #Signals
---
### ⭐ If this dashboard helps your trading, please leave a like and share your experience in the comments!
### 🚀 Click "Add to Favorites" to start seeing the market like never before!
Protected script
This script is published as closed-source. However, you can use it freely and without any limitations – learn more here.
SpeedEdge_Securities
Also on:
Disclaimer
The information and publications are not meant to be, and do not constitute, financial, investment, trading, or other types of advice or recommendations supplied or endorsed by TradingView. Read more in the Terms of Use.
Tesla at crucial support CMP $ 306Currently at a major 200 DMA, might rest here and give a upmove before we can see any further meaningful correction, unless the sentiments towards Elon Musk and Trump go extremely negative then we are again looking for 200 levels. Long with SL of 295
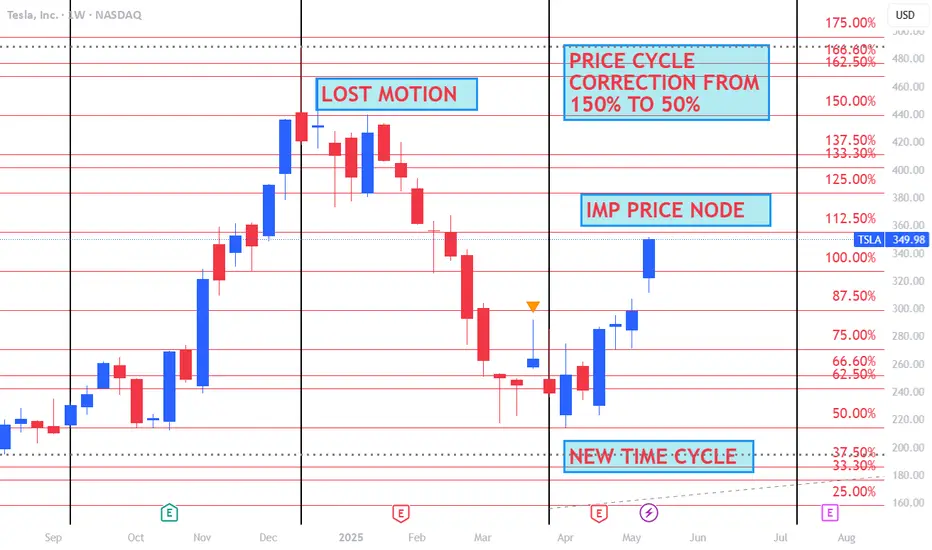
TSLA TESLA NASDAQ STOCK GANN WEEKLY ANALYSIS 16 MAY 2025Weekly Charts shows details below....
New time Cycle starts...
Death Zone Top with Lost motion above 150% price levels.
Correction from 150% to 50%...
Back to the start from where we started ...
Double Bottom... to 112.5% now...
Imp Price Node....
Happy Trading !!!
TSLA: BUY if 1 hr candle close above 298Possible levels are shown in the chart based on high volume candles.
When a level crosses in 15 mins timeframe & forms a doubl top/bottom (in this case bottom) then trade can be initiated
