PCR Trading Strategies Basics of Options
Options come in two primary types:
Call Options: A call option gives the holder the right to buy the underlying asset at a specific price (known as the strike price) before or on the expiration date. Traders purchase calls if they anticipate the asset's price will rise.
Put Options: A put option gives the holder the right to sell the underlying asset at the strike price before or on expiration. Traders buy puts when they expect the asset's price to fall.
Key terms every options trader must understand:
Underlying Asset: The security or instrument upon which the option derives its value.
Strike Price: The price at which the option holder can buy or sell the underlying asset.
Premium: The price paid to purchase the option.
Expiration Date: The last date the option can be exercised.
In-the-Money (ITM): A call option is ITM if the underlying asset price is above the strike price; a put is ITM if the underlying price is below the strike price.
Out-of-the-Money (OTM): A call option is OTM if the underlying asset is below the strike price; a put is OTM if above.
At-the-Money (ATM): When the underlying price equals the strike price.
Trade ideas

Trading Psychology – The Mental Edge of Successful Traders1. Why Trading Psychology Matters More Than Strategy
A trading strategy is important, but even the best strategy can fail if the trader cannot execute it with discipline.
For example:
A trader may exit too early due to fear.
A trader may hold losing positions due to hope.
A trader may overtrade due to greed or excitement.
A trader may avoid taking trades due to hesitation after losses.
These behaviors have nothing to do with strategy—they are psychological errors. Markets reward logic, not emotions. Thus, mastering psychology is just as important as mastering technical or fundamental analysis.
2. Key Emotional Challenges in Trading
a) Fear
Fear comes in different forms:
Fear of losing money
Fear of missing out (FOMO)
Fear of being wrong
Fear often pushes traders into irrational actions such as not pulling the trigger on a valid setup, placing too tight stop-losses, or chasing the market impulsively.
b) Greed
Greed leads to:
Overtrading
Holding winners too long
Trading oversized positions
Gambling instead of following rules
Greed makes traders believe they can earn more with one big trade, which usually leads to disaster.
c) Overconfidence
After a few winning trades, many traders feel invincible. This leads to:
Ignoring risk management
Taking bigger risks
Abandoning the trading plan
Overconfidence breaks discipline faster than losses.
d) Revenge Trading
Revenge trading happens when a trader tries to recover losses immediately. This emotional state leads to:
Quick, irrational trades
Ignoring setups
Emotional overreaction
Revenge trading is one of the biggest reasons for heavy losses.
e) Impatience
Trading requires waiting for the perfect setup. Many traders:
Enter too early
Exit too early
Switch strategies too often
Impatience destroys consistency.
3. Core Psychological Traits of Successful Traders
a) Discipline
The ability to follow the trading plan strictly.
Discipline prevents impulsive decisions, ensuring consistent behavior regardless of market conditions.
b) Patience
Great traders wait for the market to come to them. They do not chase trades; they choose trades.
c) Confidence
Confidence is not arrogance.
It is the belief in your strategy and ability, built through backtesting, journaling, and experience.
d) Emotional Control
Successful traders are calm during profit and loss.
They understand that:
“One trade does not decide the journey.”
Thus, emotions never control their decisions.
e) Adaptability
Markets constantly change. A strong trading psychology enables traders to adapt without panic or frustration.
4. Psychological Principles for Better Trading
a) Think in Probabilities
Trading is like poker or sports betting—nothing is guaranteed.
Winning traders think in terms of:
Win rate
Reward-to-risk
Long-term edge
They do not expect every trade to win.
b) Accept Losses as Part of the Game
Losses are not failures—they are expenses.
Just like a business has costs, trading has losing trades.
Accepting losses reduces fear and prevents emotional decisions.
c) Process Over Outcome
Focusing only on profit leads to stress and mistakes.
Successful traders focus on:
Following the plan
Managing risk
Executing flawlessly
The outcome naturally improves.
5. The Psychology Behind Market Movements
Markets are driven by collective emotions:
Fear
Greed
Panic
Hope
Euphoria
Understanding these crowd behaviors helps traders
ride trends
avoid traps
identify market reversals
A trader who understands human behavior has a huge edge.
6. How to Build Strong Trading Psychology
a) Create a Clear Trading Plan
A plan should include:
Entry rules
Exit rules
Stop-loss and target rules
Risk per trade
Timeframes and setups
A strong plan removes emotional thinking.
b) Use Strict Risk Management
Risk management reduces emotional pressure.
If you risk only 1% per trade:
fear decreases
losses become manageable
confidence increases
Small, controlled losses reduce emotional damage.
c) Keep a Trading Journal
Journaling helps identify:
emotional mistakes
good trades
bad habits
areas to improve
It is the most powerful tool for psychological growth.
d) Practice Mindfulness and Emotional Awareness
Mindfulness helps you remain aware of:
fear
greed
stress
impulsive urges
It encourages rational thinking under pressure.
e) Backtest and Build Confidence
Backtesting proves your strategy works.
When you trust the system, you stop doubting and stop making emotional decisions.
7. Common Psychological Mistakes Traders Make
Expecting quick results
Trading success takes years of practice.
Relying on instinct instead of rules
The market punishes emotional guesses.
Changing strategies often
Inconsistency destroys psychological stability.
Taking trades to “prove” something
Trading is not about ego; it’s about probabilities.
Ignoring mental health
Stress, burnout, and fatigue lead to poor decisions.
8. Developing a “Professional Trader Mindset”
Professional traders think differently from beginners.
Pros focus on risk; beginners focus on profit.
Professionals ask:
“How much can I lose?”
Beginners ask:
“How much can I make?”
Pros follow systems; beginners follow emotions.
Pros accept uncertainty; beginners look for certainty.
Pros treat trading as a business; beginners treat it as gambling.
Shifting to a professional mindset requires consistent practice and emotional maturity.
9. The Role of Habits and Lifestyle in Trading Psychology
Your lifestyle impacts your mental state.
Healthy traders:
sleep well
exercise
maintain routines
avoid trading during emotional stress
take breaks after big wins or losses
A disciplined life encourages disciplined trading.
10. Final Thoughts: Master Your Mind, Master the Market
Trading psychology is the foundation of long-term trading success.
You can have:
the perfect indicator
advanced strategies
great market knowledge
But without emotional control, you will struggle.
The true trader’s journey is about mastering:
mindset
discipline
patience
acceptance
self-awareness
Once you understand your emotions and behavior, the market becomes much easier to navigate.

Part 3 Learn Institutional Trading Implied Volatility (IV)
IV measures expected market movement.
High IV → expensive premiums
Low IV → cheap premiums
Events like RBI policy, election results, or earnings reports increase IV.
Traders use IV to decide:
When to buy options (low IV)
When to sell options (high IV)

Trade Rate Sensitive Assets: A Comprehensive OverviewIntroduction
In the global financial markets, assets are often influenced by fluctuations in trade rates, currency values, and interest rates. Trade rate sensitive assets are those whose valuations, returns, or profitability are significantly affected by changes in trade rates or related economic variables. Understanding these assets is crucial for investors, traders, and policymakers, as shifts in trade rates can impact everything from corporate earnings to sovereign debt sustainability. In this discussion, we will explore what trade rate sensitive assets are, the types of assets affected, the mechanisms of sensitivity, and practical strategies for managing associated risks.
Definition of Trade Rate Sensitive Assets
Trade rate sensitive assets are financial or physical assets whose value is directly or indirectly influenced by trade rates, exchange rates, or global trade dynamics. In this context, “trade rate” refers to the cost of importing or exporting goods and services, often mediated by currency exchange rates and tariffs. When trade rates fluctuate due to changes in currency valuations, trade policies, or global demand, the cash flows and profitability of these assets can be materially affected.
For example, a company that exports electronics from India to the United States may find that its revenue in Indian Rupees rises or falls depending on the USD/INR exchange rate. Similarly, bonds issued in foreign currency, commodities, or equity of export-driven companies are considered trade rate sensitive.
Categories of Trade Rate Sensitive Assets
Equities of Export-Oriented Companies
Companies engaged in global trade, particularly exporters, are highly sensitive to changes in trade rates. For instance:
Exporters: Revenue depends on foreign currency inflows. A stronger domestic currency reduces the local-currency value of foreign revenue, negatively impacting profits.
Importers: Firms reliant on imported raw materials may face higher costs if the domestic currency weakens, squeezing profit margins.
Examples include:
Technology companies exporting software or hardware.
Commodity companies exporting metals, agricultural products, or chemicals.
Foreign Currency Bonds
Bonds issued in foreign currency expose investors to trade rate and currency risk. When trade rates impact currency valuations:
The local-currency value of coupon payments and principal changes.
Investors holding USD-denominated bonds in emerging markets may gain or lose value depending on the USD exchange rate relative to their home currency.
Commodities
Many commodities are globally traded, so trade rate fluctuations directly influence pricing. For instance:
Oil and gas prices are denominated in USD globally; any currency depreciation in importing countries increases local costs.
Agricultural products, metals, and rare earth minerals are affected similarly, with global trade dynamics impacting supply and demand.
Derivative Instruments
Derivatives such as futures, options, and swaps on foreign currencies, commodities, and trade-sensitive indices also qualify as trade rate sensitive assets. They are particularly useful for hedging or speculating on trade rate movements. For example:
Currency futures can hedge export revenue against domestic currency appreciation.
Commodity futures allow exporters and importers to manage cost volatility.
Real Assets with Trade Exposure
Some physical assets, like factories, warehouses, or ships, are indirectly trade rate sensitive. For example, a shipping company’s revenue is tied to freight rates, which are influenced by global trade activity and currency movements.
Mechanisms of Sensitivity
Trade rate sensitivity arises from several interconnected mechanisms:
Exchange Rate Fluctuations
Exchange rates are a primary determinant of trade rate sensitivity. Assets that generate foreign revenue or require foreign inputs experience profit volatility when exchange rates shift.
A depreciation of the domestic currency improves export competitiveness, potentially increasing revenue.
Conversely, it raises the cost of imported inputs, affecting margins.
Tariffs and Trade Policies
Changes in trade tariffs, quotas, and regulations can directly impact asset value:
Increased tariffs on imported components may raise production costs for domestic manufacturers.
Export restrictions in foreign markets can limit revenue potential.
Global Economic Cycles
Trade-sensitive assets react to changes in global economic growth, as demand for exports fluctuates with industrial production, consumer spending, and investment cycles.
Commodity Prices
Many trade-sensitive assets, especially in resource-driven economies, are influenced by global commodity prices. For example:
Oil exporters benefit from rising crude prices in USD terms.
Agricultural exporters face revenue shifts based on international demand and currency-adjusted prices.
Interest Rate Differentials
Trade-sensitive assets in foreign currency can be indirectly affected by interest rate differentials. Higher domestic interest rates may strengthen the currency, impacting export competitiveness and asset valuations.
Risk and Volatility
Trade rate sensitive assets carry inherent risks due to their exposure to multiple dynamic factors:
Currency Risk: Volatile exchange rates can significantly alter asset values.
Trade Policy Risk: Sudden policy changes, sanctions, or tariffs can disrupt revenue streams.
Commodity Price Risk: Export-driven commodity firms face fluctuations in global prices.
Liquidity Risk: Assets with concentrated trade exposure may be harder to sell during economic shocks.
Investors must recognize that trade rate sensitivity introduces higher volatility compared to domestic-only assets, making risk management essential.
Investment and Hedging Strategies
Investing in trade rate sensitive assets requires careful assessment of global trade trends, currency movements, and economic indicators. Some practical strategies include:
Diversification
Spread investments across regions, sectors, and asset classes to reduce exposure to a single trade-sensitive factor.
Currency Hedging
Use forward contracts, options, or swaps to mitigate currency risk in foreign revenue or bonds.
Commodity Hedging
Exporters and importers can lock in prices via commodity futures or swaps to reduce volatility from global market fluctuations.
Monitoring Policy Developments
Stay informed on tariffs, trade agreements, and geopolitical developments that may affect asset valuations.
Active Portfolio Management
Adjust allocations dynamically based on macroeconomic indicators, exchange rate forecasts, and trade volume trends.
Examples in Real-World Markets
Apple Inc.: Generates significant revenue from exports; USD appreciation can affect international earnings.
Reliance Industries: Exposed to crude oil prices and global trade flows; currency and commodity risks are significant.
Emerging Market Bonds: Sensitive to USD movements and global interest rate changes, affecting repayment in local currencies.
Shipping Companies (e.g., Maersk): Revenue depends on global trade volumes and freight rates, which fluctuate with global economic conditions.
Conclusion
Trade rate sensitive assets form a crucial component of global financial markets, linking macroeconomic trends, currency movements, and international trade dynamics. These assets—ranging from equities, bonds, commodities, derivatives, to physical trade-linked assets—require careful monitoring due to their susceptibility to exchange rates, trade policies, and global demand cycles. Successful investment and risk management in these assets involve a combination of hedging, diversification, and close attention to macroeconomic and geopolitical indicators. Understanding the mechanisms and strategies related to trade rate sensitivity enables investors and policymakers to navigate volatility, optimize returns, and mitigate potential losses in a highly interconnected global economy.
Two Zones Strategy – Nested Zone Breakout (Telugu Explanation)🟦 Two Zones Strategy – Nested Zone Breakout (Telugu Explanation)
🧠 Concept (Main Idea)
ఈ strategy లో రెండు consecutive zones ఏర్పడతాయి. ఆ రెండు zones ఇలా ఉండాలి:
1st Zone High ≤ 2nd Zone High
1st Zone Low ≥ 2nd Zone Low
ఈ structure ని Nested Zone / Contraction Zone అంటారు.
🔍 ఇది ఏమి సూచిస్తుంది?
Price slowగా compress అవుతుంది
Market లో accumulation జరుగుతున్న సూచన
Levels tighten అవుతున్నప్పుడు strong breakout వచ్చే అవకాశం చాలా ఎక్కువ
ఈ pattern ప్రధానంగా momentum breakouts కోసం అత్యంత effective గా పని చేస్తుంది.
🟩 Entry Rule
Entry చాలా simple & clean:
ఏ candle అయినా 2nd Zone High పై close అయితే → అది breakout confirmation
ఆ candle close = Entry Price
అంటే wick కాదు, clean close కావాలి.
🟥 Exit Rule
🎯 Target Calculation
Use 1 : 2 Reward Ratio
2nd Zone size = (2nd Zone High – 2nd Zone Low)
Target = Zone size × 2 (from Entry Price)
Example:
Zone size = 1 point → Target = 2 points above Entry
🛑 Stop Loss (Optional)
SL = 2nd Zone Low
లేదా మీకు risk appetite ఉండి ఉంటే manual trailing కూడా పెట్టుకోవచ్చు
⭐ Strategy Highlights
✔️ Price contraction → Big move potential
✔️ Entry confirmation very clear (Close above Zone High)
✔️ Smaller SL → Higher Reward setups
✔️ Works best in stocks with momentum
✔️ Beginner-friendly breakout method
✔️ Clean RR planning before entry
📌 Suitable For
Swing Traders
Positional Traders
Breakout Traders
Weekly / Daily timeframe followers
📈 Timeframes Recommended
1W (Best)
Avoid using on 5m/15m in volatile stocks

Trading Styles in the Indian Market1. Intraday Trading
Intraday trading, commonly known as day trading, is one of the most popular styles in India due to high volatility and leverage availability. It involves entering and exiting trades within the same trading day. The primary objective is to capture small price movements across large volumes.
Key Features
Short time frames: 1–5 minutes, 15 minutes, or hourly charts.
High leverage: Brokers offer margin for intraday trades.
Targets are small: 0.3% to 1.5% moves.
Risk management is crucial due to high volatility.
Popular Strategies
Momentum trading during market opening.
Breakout and breakdown strategies.
VWAP-based institutional flow tracking.
Reversal trades at key supply-demand zones.
Best Suited For
Traders with quick decision-making skills, emotional discipline, and the ability to monitor charts during market hours.
2. Swing Trading
Swing trading is ideally suited for the Indian market because stocks often move in short-term trends driven by news, earnings expectations, institutional flows, and sector rotation. Swing traders typically hold positions for 2–20 days.
Key Features
Higher timeframe analysis: Daily and weekly charts.
Lower stress compared to intraday.
Ideal for people with jobs who cannot monitor the market all day.
Uses technical patterns like flags, triangles, pullbacks, and breakouts.
Popular Swing Indicators
Moving averages (20, 50, 200)
RSI divergences
Fibonacci retracement zones
MACD crossovers
Best Suited For
Traders who prefer moderate risk, medium-term profits, and structured analysis without minute-to-minute monitoring.
3. Positional Trading
Positional trading involves holding trades for weeks to months based on broader market trends. This style is popular among experienced traders and investors who understand macro trends, sectoral cycles, and company fundamentals.
Key Features
Focus on major trends, not minor fluctuations.
Requires patience and conviction.
Uses weekly and monthly charts.
Less stressful than intraday/swing.
Approach
Use fundamentals for selection and technicals for timing.
Sectors like banking, FMCG, pharma, and IT respond well to positional plays.
Key tool: trendlines, moving averages, sector rotation analysis.
Best Suited For
Working professionals, medium-capital traders, and long-term thinkers.
4. Scalping
Scalping is one of the fastest and most advanced trading styles. The goal is to book very small profits (0.05%–0.3%) multiple times throughout the day. Scalping is extensively used in index derivatives—especially NIFTY, BANK NIFTY, and FINNIFTY—because liquidity and depth are extremely high.
Key Features
Extremely quick trades lasting seconds to minutes.
High frequency, low risk per trade.
Requires stable internet and low-latency execution.
Works best during high liquidity periods—opening hour and closing hour.
Tools
Option order flow
VWAP
Depth of market (DOM) data
Tick charts and footprint charts (for advanced scalpers)
Best Suited For
High-skill professional traders with strong reflexes, emotional control, and advanced tools.
5. Algorithmic and System-Based Trading
Algo trading has grown rapidly in India with the availability of APIs, platforms like Zerodha Streak, Tradetron, and custom Python systems. Algorithmic trading uses rules, automation, and backtesting instead of emotional decision-making.
Key Features
Mechanical, rule-based execution.
Removes emotions from trading.
Can handle high-frequency signals.
Backtesting helps refine strategies.
Popular Algo Styles
Trend-following systems.
Mean-reversion systems.
Statistical arbitrage.
Option selling with hedges.
Market-neutral strategies.
Advantages
Consistency and discipline.
Ability to trade multiple symbols simultaneously.
Works even for part-time traders.
Best Suited For
Tech-savvy traders, engineers, data scientists, or those who prefer automation over discretion.
6. BTST / STBT Trading (Buy Today, Sell Tomorrow / Sell Today, Buy Tomorrow)
BTST and STBT trading styles focus on overnight price movements influenced by global cues, economic announcements, or corporate news.
Key Features
BTST: Carry equity positions overnight to capture gap-up openings.
STBT: Mostly used in F&O due to short selling restrictions.
Trades depend on global markets—Dow, SGX NIFTY, crude oil, and currency moves.
Best Suited For
Swing traders who want to avoid intraday volatility but profit from overnight reactions.
7. Options Buying (Directional)
Options trading has exploded in India due to low capital entry and high reward potential. Directional option buyers predict sharp short-term moves.
Focus Areas
ATM/OTM calls and puts.
Breakout-based entries.
Trend days with strong momentum.
Expiry day (Thursday) trades.
Challenges
High theta decay.
Requires accuracy in direction and timing.
Best Suited For
Experienced traders who understand volatility, Greeks, and market structure.
8. Options Selling (Non-Directional or Semi-Directional)
Option selling is preferred by professional traders because it offers consistent income through premium decay.
Popular Strategies
Straddles & strangles.
Iron condor.
Bull/bear spreads.
Calendar spreads.
Advantages
High probability trades.
Beneficial during low-volume consolidations.
Risks
Requires strict hedging.
Black swan events can cause large losses.
Best Suited For
Capital-rich traders with risk-management experience.
9. Trend Following
Trend following is timeless and works well in trending markets like India. Instead of predicting tops and bottoms, trend followers ride the big wave.
Key Features
Use moving averages (20/50/200).
Enter after confirmation, not prediction.
Works extremely well in bull markets.
Requires fewer but high-quality trades.
Psychology
Trend following is simple but emotionally challenging because you must hold winners and cut losers quickly.
10. News-Based and Event Trading
Event traders focus on volatility around:
RBI policy
Budget announcements
Earnings results
Global macro events
Corporate announcements
Approach
Predict volatility, not direction.
Often uses straddles/strangles.
Fast execution is required.
Conclusion
The Indian market provides opportunities for every type of trader—from beginners to advanced professionals. Each trading style has its strengths, weaknesses, and ideal market conditions. To succeed, traders must choose a style that matches their personality, risk tolerance, time availability, and capital. Mastery comes from specialization, risk management, and continuous learning.

Part 2 Introduction to Candlestick PatternsImportant Trading Principles in Options
1. Don’t Buy Far OTM Options
They look cheap but rarely become profitable.
Most expire worthless due to Theta decay.
2. Focus on ATM and Slightly ITM Options
They respond better to price movement.
3. If You Are a Beginner, Avoid Selling Options
Sellers need:
high capital
strict hedging
risk management
psychological control
4. Never Trade Without a View
Options need direction OR volatility.
5. Avoid Holding to Expiry Unless Experienced
Expiry movement is very fast, risky, and unpredictable.

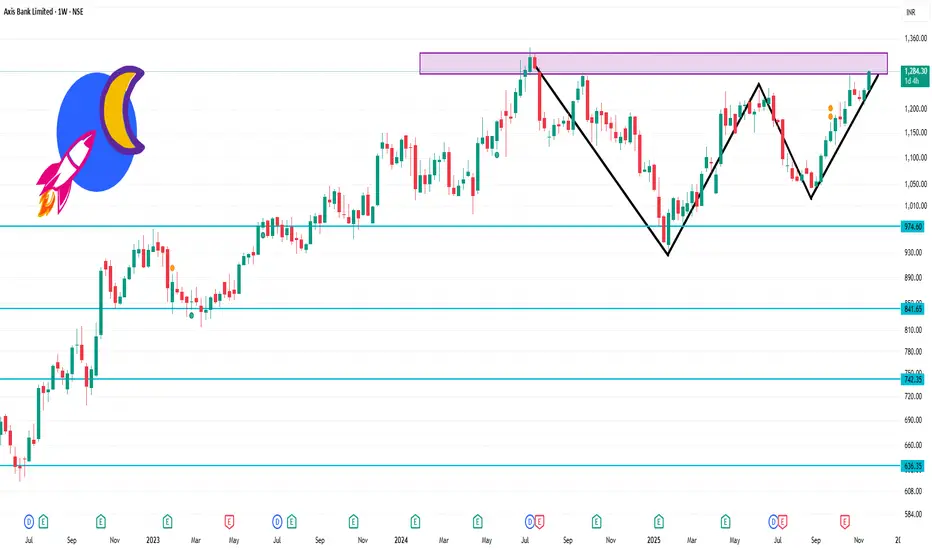
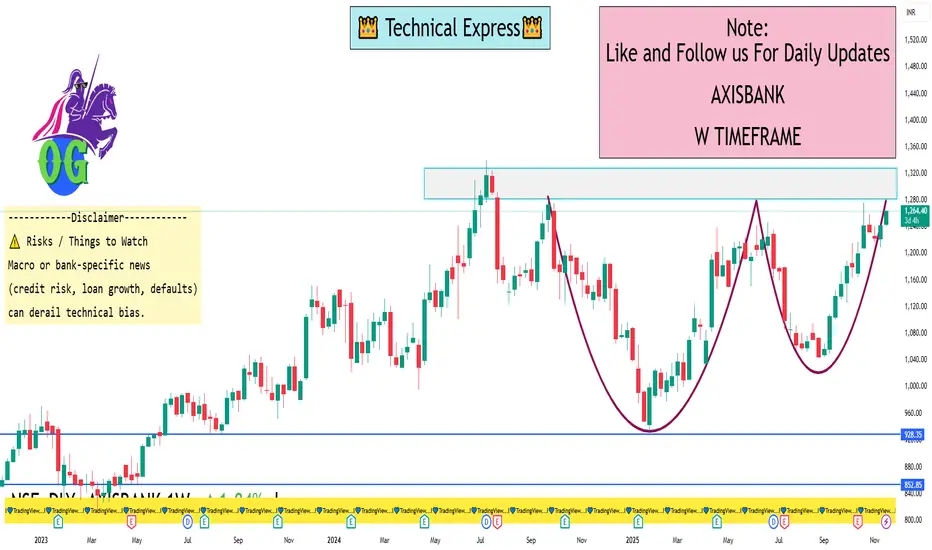
AXISBANK 1 Week Time Frame 🔍 Key Levels for the Week
Based on recent pivot/technical data:
Resistance levels: ~ ₹1,276 to ₹1,282 (around daily R1/R2)
Higher resistance: ~ ₹1,290-₹1,302 if uplink happens
Support levels: ~ ₹1,252-₹1,246 as near-term floor
Broader weekly support: ~ ₹1,232-₹1,218 region if deeper pullback
⚠️ Things to keep in mind
Current price is near the 52-week high region (~₹1,284) which increases risk of resistance/strain.
Short-term signals/pivots are useful but market news, macro banking events, FII/DII flows can quickly shift dynamics.
Use stop-losses or risk-controls if trading around these levels given the tight range and possible whipsaw.
Axis Bank Ltd.(AXISBANK)Time cycles are routines that allow you to map a stock movement by measuring the number of days or periods over which the stocks highs and lows occur. But this does not prove whether a reversal will occur in the next time cycle; it is only a possibility.
Regardless of the outcome, the candle formed on the day of the Time Cycle holds significant significance. It's crucial that the market respects this candle, whether it moves up or down. The Time Cycle will often pause briefly near the candle. You'll notice on the chart that this often resembles a support or resistance area.
The candle of the time cycle tells you about the continuity or reversal as well, but you have to forgive the high and low of the candle formed on the time cycle.
You do not have to take any decision on your own. This is its specialty.
Technical Market Explode1. What Is a “Technical Market Explosion”?
A “market explosion” refers to a rapid price breakout driven purely by technical triggers—no fundamental news is required.
It typically includes:
A sudden spike in bullish or bearish momentum
Breakout from a key technical zone
Large volume expansion
Wide-range candles
Fast movement toward next liquidity zones
High volatility and increased trader participation
This is the type of move that surprises many traders because price travels faster than normal and often exceeds expected levels.
2. What Causes a Technical Market Explosion?
(A) Breakout from Key Support/Resistance Zones
When price is stuck inside a range, buyers and sellers accumulate their orders. Once price breaks the range, trapped traders exit, and new participants join the move.
This results in:
Short-covering or long liquidation
Fresh momentum
Increased volatility
This combination sparks explosive movement.
(B) Market Structure Shift
A technical explosion often begins with a market structure change, usually identified by:
Higher high + higher low (bullish shift)
Lower low + lower high (bearish shift)
Break of trendline
Break of previous swing high/low
Once market structure shifts, technical traders jump in, creating momentum that pushes price aggressively.
(C) High Volume Breakouts
Volume is the fuel behind explosive moves.
When a resistance is broken with 3–4x above-average volume, the breakout is genuine.
Volume tells us:
Institutional participation
Less chance of false breakout
Strong follow-through
High volume acts as confirmation that the move is real.
(D) Liquidity Hunting and Stop Loss Triggers
Behind every explosive move is a series of stop orders placed by traders.
For example:
When price breaks resistance, short sellers’ stop-losses get hit → leads to panic buying
When price breaks support, long traders’ stop-losses trigger → leads to panic selling
This creates automatic order flow, pushing prices further and fueling the explosion.
(E) Imbalance and Fair Value Gaps
In modern technical analysis (especially Smart Money Concepts), explosive moves originate from imbalances.
These appear as:
Large bullish or bearish candles
Gaps between price levels
Very fast moves due to no opposite orders
When an imbalance occurs, price often travels fast without pullbacks, creating the explosive effect.
(F) Breakout of Consolidation Zones
Before every big move, price usually consolidates because:
Market is building orders
Institutions are accumulating
Traders are waiting for direction
Suddenly breaking out of a long consolidation zone results in a strong directional rally.
3. Technical Indicators Behind Market Explosions
(1) Moving Averages (MA & EMA)
Explosive moves commonly happen during:
Golden Cross (50 EMA > 200 EMA)
EMA breakout (price breaks above 20 or 50 EMA with volume)
Retest of EMA support
MAs align trend, confirming power.
(2) RSI + Momentum Indicators
Before a big explosion, RSI often shows:
Bullish divergence
Oversold reversal
Strong momentum above 60
Bearish divergence in downtrends
Momentum indicators help traders anticipate sharp moves.
(3) Volume Profile
Volume Profile reveals zones of:
High liquidity (value areas)
Low liquidity (low-volume nodes)
When price enters a low-volume zone, it travels very fast, causing explosive moves.
(4) Bollinger Bands Expansion
Before a market explodes, Bollinger Bands typically:
CONTRACT → volatility squeezes
Then EXPAND → breakout move begins
This is known as the Bollinger Band Squeeze breakout.
(5) MACD Crossover
MACD crossovers confirm trend strength.
A powerful MACD crossover above the zero line often signals:
Strong bullish explosion
Trend continuation
Institutional involvement
4. Chart Patterns That Lead to Explosive Market Moves
(A) Triangle Breakout
Symmetrical Triangle
Ascending Triangle
Descending Triangle
These patterns store compression.
When breakout happens → price explodes.
(B) Cup and Handle
This pattern is known for strong post-breakout rallies, often leading to multi-week explosive trends.
(C) Flag and Pennant Patterns
These are continuation patterns.
When breakout happens:
Momentum increases
Volume increases
Price explodes towards next target
(D) Double Bottom or Double Top Breakouts
When neckline breaks → explosion occurs due to aggressive traders piling in.
5. Institutional Trading and Market Explosions
Technical explosions are heavily influenced by institutional traders, who generate:
Large order blocks
Big liquidity shifts
Volume spikes
Long-range impulsive moves
Institutions often accumulate quietly, then trigger big moves that retail traders interpret as “explosive”.
6. Trader Psychology Behind Explosive Moves
A market explosion is powered by emotional reactions:
Fear of missing out (FOMO)
Panic buying/panic selling
Forced stop-loss exits
Momentum chasing
Quick profit-booking
These emotional behaviours create rapid price movement.
7. How Traders Identify a Technical Market Explosion Before It Happens
To predict explosion moments, traders watch for:
Squeeze or compression in price
Sharp increase in buying or selling pressure
Volume begins rising
Breakout from structure
Liquidity zones nearby
Imbalances in market
Momentum indicators turning positive
When all these align, the probability of a market explosion becomes extremely high.
8. How To Trade a Technical Market Explosion
Entry Strategies
Enter on breakout candle close
Enter after retest
Enter on volume confirmation
Enter on EMA bounce
Stop-Loss Placement
Below breakout zone
Below retest level
Below previous swing lows
Profit Targets
Next resistance level
Fibonacci extensions
Volume profile high-volume nodes
Risk Management
Explosive moves can reverse quickly; use:
1:2 or 1:3 risk-reward
Trailing stop-loss
Partial profit booking
9. Examples of Explosive Moves in Markets
Indices breaking all-time highs
Stocks breaking multi-month resistance
Commodity surges after long consolidation
Small-cap stocks breaking out on high volume
Each explosive move follows the same technical principles described above.
Conclusion
A technical market explosion is one of the most profitable and exciting events in trading. It results from a combination of chart patterns, volume expansion, liquidity hunts, market structure shifts, and trader psychology. Traders who understand these elements can anticipate explosive moves before they occur and enter early with confidence.
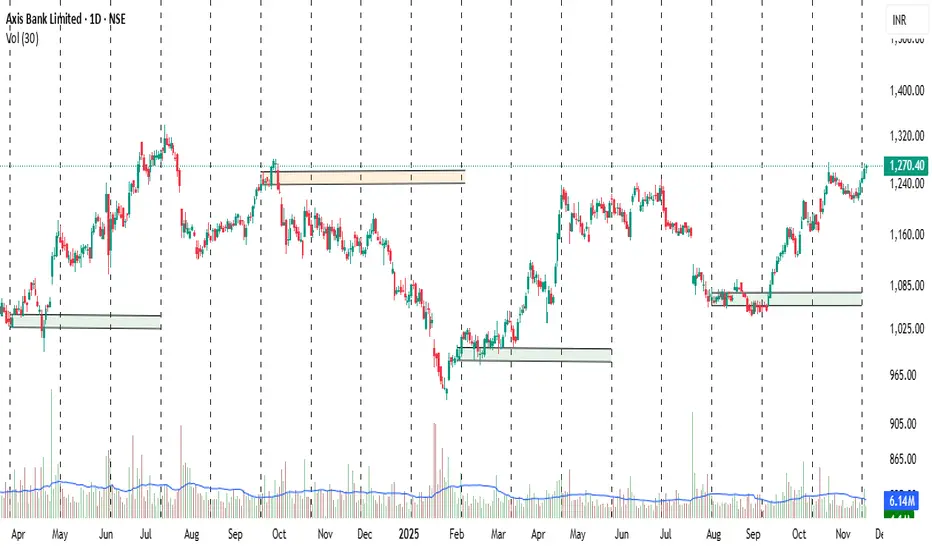
AXISBANK 1 Week View 📌 Key Levels & Data
Latest price roughly ₹1,250-₹1,260 per share.
52-week high ~ ₹1,276.10.
52-week low ~ ₹933.50.
Weekly (20-period) moving average ~ ₹1,143.27.
Weekly Bollinger Bands: Upper band ~ ₹1,285.22, Lower band ~ ₹1,001.32.
Weekly Pivot levels (Classic):
Pivot ~ ₹1,232.33
R1 ~ ₹1,255.27, R2 ~ ₹1,268.93, R3 ~ ₹1,291.87
Support S1 ~ ₹1,218.67, S2 ~ ₹1,195.73, S3 ~ ₹1,182.07
⚠️ Risks / Things to Watch
Macro or bank-specific news (credit risk, loan growth, defaults) can derail technical bias.
If weekly candle closes strongly below the 20-week SMA (or lower support), it could invalidate the bullish case.
Volume confirmation: For a strong breakout or pullback, check weekly volume — weak volume may lead to false moves.
Zero-Day Option Trading (0DTE)1. What Are Zero-Day Options?
A Zero-Day option is simply a regular option contract on its expiration day. Because U.S. indices like the S&P 500 (SPX), Nasdaq 100 (NDX) and ETFs like SPY, QQQ now have multiple expirations per week—and SPX has daily expirations—traders can access 0DTE opportunities every single trading day.
Key Characteristics
No time left → options decay extremely fast.
Highly sensitive (high gamma) → small price changes lead to large premium moves.
Very cheap or very expensive depending on proximity to strike.
Used for intraday speculation and hedging.
Cash-settled index options (like SPX) avoid assignment risk.
Because of the intense speed and leverage, 0DTE trading is often compared to day trading with derivatives on steroids.
2. Why 0DTE Became So Popular
a. High Leverage
A trader can control thousands of dollars of market exposure for a very low premium. For example, a deep out-of-the-money SPX option might cost only a few dollars but can balloon 10×–30× if the index rallies quickly.
b. Immediate Results
Traders don’t wait weeks or months—profits or losses occur in minutes or hours.
c. High Liquidity
Because major indices have huge participation, 0DTE options have:
fast fills,
tight bid–ask spreads,
minimal slippage (especially on SPX).
d. Attractive to Both Retail and Institutions
Retail traders seek quick profits.
Institutions often sell 0DTE options for income due to rapid theta decay.
3. Understanding the Mechanics
a. Time Decay (Theta)
Theta is at maximum on expiration day. Options lose value rapidly, especially after midday.
A call option worth $4 at 10:00 AM might be worth $1 by 1:00 PM—even if price hasn’t moved.
b. Gamma Exposure
Gamma determines how fast delta changes. On 0DTE:
delta moves extremely fast,
a 5-point SPX move can flip an option from worthless to highly profitable instantly.
c. Volatility’s Impact
Implied volatility (IV) plays a crucial role:
High IV → higher premiums, more unpredictable movement.
Low IV → cheaper premiums, easier theta decay for sellers.
Understanding the interplay of theta, gamma, and IV is the core of 0DTE expertise.
4. Types of Traders in 0DTE Markets
1. Buyers (Directional Traders)
They seek big intraday moves and are willing to risk small amounts for the chance of large returns. Suitable for:
breakout traders,
news-event traders,
momentum scalpers.
2. Sellers (Income Traders)
They benefit from:
rapid premium decay,
mean-reversion behavior.
These traders often sell:
spreads,
iron condors,
credit put spreads (CSP),
credit call spreads (CCS).
Institutions typically dominate this side because selling naked options carries unlimited risk.
5. Popular 0DTE Trading Strategies
1. ATM Straddle (High-Volatility Bet)
Buy both a call and a put at-the-money. Profit if the market makes a large move in either direction.
Used for:
major economic announcements (CPI, FOMC, NFP)
index breakout or breakdown days
Risk: Expensive strategy and requires big movement to break even.
2. OTM Strike Buying (Lottery Ticket Style)
Buying cheap far OTM calls or puts that cost very little. They can explode in value if the index rallies quickly.
Pros:
High reward-to-risk
Small capital required
Cons:
Very low probability of success
Most expire worthless
3. Credit Spreads
Selling an option and buying another further OTM for protection.
Example: Sell 5000 put, buy 4990 put (bull put spread).
Pros:
Higher probability of profit
Defined risk
Benefit from time decay
Cons:
Low reward-to-risk ratio
Must manage risk tightly
This is one of the most popular ways institutions use 0DTE.
4. Iron Condor
Sell OTM call spread and OTM put spread simultaneously. Profit if price stays within a range.
Pros:
High win rate
Income-style strategy
Cons:
Vulnerable to sharp moves
Quick adjustments needed
5. Directional Scalping With Options
Buying short-term scalp options (ATM or near ATM) for a few minutes to ride intraday momentum.
Best for:
Price-action traders
VWAP, support–resistance levels
Trend-following
Risk: Requires excellent timing and discipline.
6. When Traders Use 0DTE Options
1. News Events
0DTE options are extremely popular during:
Federal Reserve announcements (FOMC)
Inflation reports (CPI, PCE)
Jobs data (NFP)
Earnings of major tech companies (for QQQ, NDX)
These events cause large intraday swings—ideal for fast movers.
2. Expiration Day Index Movements
SPX often moves erratically around expiry due to dealer hedging flows.
3. Intraday Trend Days
When markets show clear momentum, 0DTE buyers can ride strong sweeps.
7. Benefits of Zero-Day Option Trading
1. Limited Risk (for Buyers)
Maximum loss is the option premium.
2. High Potential Returns
0DTE buyers can see:
50% profit in minutes,
200%+ intraday,
occasional 10×–30× moves.
3. Flexibility for Any Market Condition
Trend days → buy calls or puts
Range days → sell condors
Volatile days → buy straddles
0DTE offers something for every style.
8. Major Risks of 0DTE Trading
1. Extremely Fast Time Decay
Even correct directional trades can lose money if price moves too slowly.
2. Emotional Pressure
0DTE trading requires:
instant decision-making
tight stop-loss discipline
ability to handle rapid price swings
Many traders overtrade due to adrenaline.
3. Liquidity and Slippage (During News)
Although normally liquid, bid–ask spreads can widen by 5× during major announcements.
4. Margin Risk for Sellers
Selling naked 0DTE options can cause:
huge losses,
margin calls,
account blow-ups.
Beginners should avoid naked selling entirely.
9. Best Practices for Safe 0DTE Trading
Always trade with defined risk (spreads or small-position buying).
Set time-based rules (e.g., exit all trades by 3:15 PM).
Avoid trading during the first 5–10 minutes of market open due to volatility.
Wait for direction—don’t guess the first move of the day.
Use stop-loss and take-profit rules.
Avoid revenge trades.
Track win rate, average gain, and average loss.
Avoid over-leveraging—capital preservation is key.
10. Who Should Trade 0DTE Options?
Suitable for:
Experienced traders
Price-action and volatility traders
Traders comfortable with fast decision-making
Not suitable for:
Beginners
Traders with emotional discipline issues
Anyone relying on hope instead of strategy
0DTE trading is best when you have strong knowledge of technical analysis, option Greeks, and intraday market behavior.
Conclusion
Zero-Day option trading is one of the most powerful and exciting forms of modern trading. It offers unmatched leverage, fast-paced decision-making, and profit potential that few financial instruments can match. However, it is equally dangerous without discipline, strategy, and risk management.
For traders who understand price action, volatility, and the Greeks, 0DTE can be a highly rewarding tool. For others, it can quickly lead to significant losses. Mastery comes from practice, data-driven decision-making, and emotional control. If used responsibly, 0DTE options can enhance both income and directional trading strategies in today’s fast-moving markets.
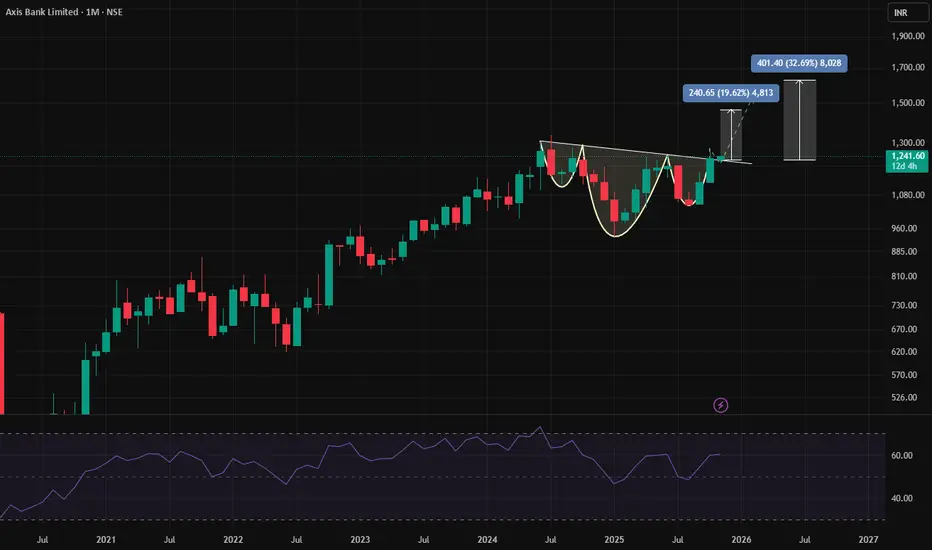
Understanding the Inverse Head & Shoulder Breakout in Axis BankEducational Article: Understanding the Inverse Head & Shoulder Breakout in Axis Bank.
Axis Bank, currently trading around ₹1241 on the monthly charts, is showing a classic inverse head & shoulder breakout at the top of a consolidation zone. This setup, combined with the Relative Strength Index (RSI) trending above 50 and preparing to cross 60, provides a strong technical case for potential upside momentum.
🔍What is an Inverse Head & Shoulder Pattern?
Structure:
Left Shoulder: Initial decline followed by a rebound.
Head: A deeper decline forming the lowest point.
Right Shoulder: A smaller decline, mirroring the left shoulder.
Neckline: The resistance line connecting the peaks of the shoulders.
Breakout Signal: When price breaks above the neckline, it indicates a reversal from bearish to bullish sentiment.
In Axis Bank’s Case:
The pattern has formed after a consolidation phase.
Price is now breaking out of the neckline, suggesting strength and potential continuation upward.
📊 Role of RSI in Confirming Breakouts
The Relative Strength Index (RSI) is a momentum oscillator that measures the speed and change of price movements.
Key Levels:
Above 50 → Indicates bullish momentum.
Crossing 60 → Adds further strength to the uptrend.
Axis Bank’s RSI:
Currently trending above 50.
Preparing to move above 60, which aligns with the breakout, reinforcing the bullish case.
🎯 Learning Points for Traders
Pattern Recognition:
Spotting inverse head & shoulder patterns helps identify potential reversals.
Always confirm with a breakout above the neckline.
Momentum Confirmation:
RSI above 50 signals strength.
A move above 60 during breakout adds conviction to the trade.
Consolidation Context:
Breakouts from consolidation zones often lead to strong directional moves.
Axis Bank’s breakout is happening after a prolonged consolidation, increasing reliability.
Risk Management:
Place stop-loss below the right shoulder or neckline to manage risk.
Avoid chasing the move without confirmation.
📝 Conclusion
The inverse head & shoulder breakout in Axis Bank, supported by RSI strength, presents a textbook example of how price action and momentum indicators work together. For learners, this is a valuable case study in combining chart patterns with RSI confirmation to identify high-probability trading opportunities.
Trading Plans for Success1. Why a Trading Plan is Essential
Markets are emotional places. Prices move fast, news flows unexpectedly, and traders often react out of fear or greed. A trading plan removes this emotional bias by giving you pre-defined rules. Instead of thinking “Should I buy or sell?” in the moment, you act according to a system you created when you were calm and logical.
A trading plan is your personal constitution.
It answers essential questions:
What market conditions will I trade?
What strategies will I use?
How much capital will I risk per trade?
How will I manage winners and losers?
What will I track and improve over time?
Successful traders spend more time refining their trading plan than blindly hunting for signals.
2. Core Components of a Successful Trading Plan
A robust plan includes these core pillars:
A. Personal Profile & Trading Goals
Every trader is different.
Ask yourself:
What is my financial goal?
How much time can I give to trading daily?
Am I a conservative, moderate, or aggressive trader?
Do I prefer short-term (scalping, intraday), medium-term (swing), or long-term (position) trading?
Your plan should match your personality. For example, if you are emotional and impatient, scalping may be risky. If you have a full-time job, swing trading may suit you better.
B. Market Selection
Do not trade everything. Select a niche.
Equity cash
Index futures
Stock options
Commodity futures
Forex pairs
Crypto (if allowed and you understand the risks)
Traders who trade too many instruments lose focus. Choosing 2–4 instruments allows you to understand their behaviour, volatility, and volume profiles more deeply.
C. Entry & Exit Strategy
Your plan must explain exactly when you enter and exit trades.
This includes:
Indicators or price patterns you use
Timeframes (e.g., 5-min, 15-min, 1-hr, daily)
Conditions that validate a trade
Conditions that invalidate a trade
Profit targets
Stop loss placement
Scaling in or out rules
For example, your plan may say:
“Buy only when price is above 20 EMA, RSI is above 50, and volume is increasing.”
A clear system removes guesswork.
D. Risk Management Rules
This is the heart of a successful trading plan.
Maximum risk per trade (e.g., 1–2% of total capital)
Maximum daily loss (e.g., stop trading if 3% capital lost in a day)
Position sizing formula
Avoiding over-trading
Rules for trading during high-impact news events
Most traders lose not because of wrong analysis, but because of poor risk control.
E. Trade Management
After entering a trade, the plan guides:
Do you move SL to breakeven after certain profit?
Do you trail stop loss?
Do you exit partially at certain levels?
When do you accept that the trend is reversing?
Your plan should protect both your capital and your profits.
3. Psychology & Discipline in a Trading Plan
Even the best strategy fails without discipline. A trading plan gives structure, but psychology keeps you following the structure.
Key psychological rules:
Never revenge trade
Never add to losing positions
Avoid checking P&L constantly
Follow the plan even after losses
Take breaks if emotionally unstable
A calm mind trades better than a brilliant mind.
4. Journaling and Performance Tracking
A successful plan requires tracking and improvement. Every trade should be recorded in a journal:
Why you entered
Why you exited
Profit or loss
Market conditions
Emotional state
What you learned
This data helps you identify patterns in your behaviour and refine your plan further.
5. Backtesting & Forward Testing
Before risking real capital, a strategy should be tested.
Backtesting: Check how your strategy performs on past data
Forward testing: Try the strategy on paper trading or small capital
Optimization: Adjust rules based on results
Validation: Ensure the changes make logical sense
This step deletes emotional biases and gives confidence in your system.
6. Daily, Weekly, and Monthly Routines
To maintain consistency, a trader needs routines.
Daily Routine:
Pre-market scan
Identify key levels
Review economic events
Decide what setups you are willing to trade today
After market: Journal trades
Weekly Routine:
Review all trades of the week
Identify mistakes
Study one pattern or strategy
Plan watchlist for next week
Monthly Routine:
Equity curve analysis
Win/loss ratios
Average profit per trade
Areas of improvement
Trading success is built on routines.
7. Adapting the Plan to Market Conditions
Markets change. A plan should not be rigid; it should evolve.
Different conditions require different approaches:
Trending markets
Range-bound markets
High volatility
Low volatility
News-driven markets
Your plan should define how you adjust position sizes, setups, and risk in each environment.
8. Common Mistakes Traders Make Without a Plan
Over-trading
Fear of missing out (FOMO)
Jumping between strategies
Trading based on news noise
Lack of risk control
Emotional exits
No proper review of trades
A plan removes these mistakes.
9. Building a Sample Trading Plan (Simple Version)
Here’s a short example:
Trading Style: Intraday index futures
Instruments: Nifty & Bank Nifty
Entry Rule:
Buy when price breaks VWAP + bullish candle + rising volume
Exit Rule:
SL = last swing low
Target = 1:2 risk-reward
Risk Rules:
Max loss per trade = 1%
Max daily loss = 3%
Stop trading after 2 consecutive losses
Psychology:
No revenge trades
Take break after big loss
Review:
Journal every trade
Weekly performance check
A real plan will be much more detailed, but this shows the structure.
10. Final Thoughts: A Trading Plan is a Lifelong Process
Success in trading is not about predicting markets; it is about controlling yourself. A trading plan helps you act like a professional, not a gambler. It builds consistency, discipline, and confidence—three pillars of long-term success.
Trading plans evolve as you grow. Over months and years, your plan becomes sharper, simpler, and more powerful. Ultimately, the goal is not to create the perfect plan, but a plan that makes you trade with clarity, control, and confidence.

Axis bank is forming a good buy scenario.Axis Bank is in slow selling for weeks after a strong rally and now forming a bullish scenario.
It is taking reversal from protection trendline and braking out bearish trendline.
It is also taking support from daily order block.
it is also taking rejection from 21 EMA
All other Higher duration EMAs are synced in upside direction.
Rejection point is forming a cluster of multiple parameters .
All these in combination making it an attractive buying scenario....
Note – if you liked this analysis, please boost the idea so that other can also get benefit of it.
Also follow me for notification for incoming ideas.
Also Feel free to comment if you have any input to share.
Disclaimer: This analysis is for educational purposes only and does not constitute investment advice. Please do your own research (DYOR) and check with your financial advisor before making any trading decisions.

Technical Analysis and Chart PatternsIntroduction
Technical analysis is a cornerstone of modern trading and investing. It involves studying price charts and market data to forecast future price movements. Unlike fundamental analysis, which focuses on financial statements, earnings, and economic indicators, technical analysis revolves around price action, volume, and market psychology. It assumes that all relevant information is already reflected in the price, and history tends to repeat itself through recognizable chart patterns and trends.
Core Principles of Technical Analysis
Technical analysis operates on three main principles:
Price Discounts Everything:
All known information—economic data, earnings, market sentiment, or political events—is already factored into the stock price. Therefore, analyzing price action alone can reveal the collective behavior of market participants.
Price Moves in Trends:
Markets rarely move randomly. Prices tend to move in identifiable trends—upward, downward, or sideways. Recognizing these trends early allows traders to position themselves advantageously.
History Repeats Itself:
Human psychology drives markets—fear, greed, hope, and panic repeat across generations. Therefore, patterns formed in the past tend to recur, providing clues about future price action.
Types of Technical Charts
Before identifying patterns, one must understand chart types used in technical analysis:
Line Chart:
It connects closing prices over a specific period, providing a simple view of the trend.
Bar Chart:
Each bar represents the open, high, low, and close (OHLC) for a given period. It gives more insight than a line chart.
Candlestick Chart:
The most popular chart among traders, candlesticks visually show market psychology. A bullish candle (close > open) is often green or white, while a bearish candle (close < open) is red or black.
Candlestick formations help identify reversals and continuations in price.
Trend Analysis
A trend is the general direction of price movement. It can be classified as:
Uptrend: Series of higher highs and higher lows.
Downtrend: Series of lower highs and lower lows.
Sideways/Range: Prices oscillate between support and resistance.
Traders use trendlines and channels to visualize and trade along the trend. The saying “Trend is your friend” highlights the importance of trading with the prevailing direction rather than against it.
Key Tools in Technical Analysis
Support and Resistance Levels:
Support: A price level where buying pressure prevents further decline.
Resistance: A level where selling pressure halts price advances.
When a resistance is broken, it can turn into new support and vice versa.
Moving Averages:
They smooth out price data to identify trend direction.
Simple Moving Average (SMA) – average of closing prices over a period.
Exponential Moving Average (EMA) – gives more weight to recent prices.
Common crossovers like the Golden Cross (short-term MA crosses above long-term MA) and Death Cross (short-term MA crosses below long-term MA) indicate trend reversals.
Volume Analysis:
Volume measures market participation. Increasing volume confirms the strength of a trend, while declining volume may signal weakening momentum.
Indicators and Oscillators:
Tools like Relative Strength Index (RSI), Moving Average Convergence Divergence (MACD), Bollinger Bands, and Stochastic Oscillator help identify overbought/oversold conditions, momentum shifts, and trend confirmation.
Chart Patterns in Technical Analysis
Chart patterns are visual formations created by price movements. They represent the psychological struggle between buyers and sellers and help traders predict potential outcomes.
Patterns are generally divided into reversal patterns and continuation patterns.
1. Reversal Patterns
These indicate that a current trend is likely to change direction.
a. Head and Shoulders
One of the most reliable reversal patterns.
Appears at the end of an uptrend.
Consists of three peaks: a higher middle peak (head) between two smaller ones (shoulders).
Neckline break confirms a bearish reversal.
Inverse Head and Shoulders appears at the bottom of a downtrend and signals a bullish reversal.
b. Double Top and Double Bottom
Double Top: Price hits a resistance twice, forming an “M” shape, signaling a bearish reversal.
Double Bottom: Price touches support twice, forming a “W” shape, indicating a bullish reversal.
c. Triple Top and Triple Bottom
Similar to double patterns but with three peaks or troughs. They confirm stronger reversals after multiple failed attempts to break support/resistance.
d. Rounding Bottom (Saucer Bottom)
Indicates a gradual shift from bearish to bullish sentiment over time. Common in long-term trend reversals.
e. Falling and Rising Wedges
Falling Wedge: Occurs during a downtrend and signals a bullish reversal.
Rising Wedge: Forms during an uptrend and signals a bearish reversal.
The breakout direction typically opposes the wedge slope.
2. Continuation Patterns
These suggest that the existing trend will continue after a brief pause or consolidation.
a. Triangles
Ascending Triangle: Horizontal resistance with rising support. Usually bullish.
Descending Triangle: Horizontal support with falling resistance. Usually bearish.
Symmetrical Triangle: Converging trendlines; breakout can occur in either direction.
b. Flags and Pennants
Flags: Small rectangular consolidations that form after a sharp move (flagpole). Breakout in the same direction resumes the prior trend.
Pennants: Similar to flags but shaped like small symmetrical triangles.
c. Rectangles (Price Channels)
When price oscillates between parallel support and resistance lines, it indicates accumulation or distribution. A breakout determines the next direction.
d. Cup and Handle
Looks like a tea cup: a rounded “cup” followed by a small “handle” consolidation. A breakout above the handle signals bullish continuation.
Candlestick Patterns
In addition to chart patterns, candlestick patterns offer short-term trading signals:
Bullish Engulfing: Large bullish candle engulfs the previous bearish candle—signals buying momentum.
Bearish Engulfing: Large bearish candle engulfs the previous bullish one—signals selling pressure.
Doji: Open and close prices are nearly equal, indicating indecision.
Hammer & Inverted Hammer: Found at bottoms, indicating potential reversals.
Shooting Star: Appears at tops, suggesting bearish reversal.
Combining Patterns with Indicators
Professional traders often combine chart patterns with technical indicators for confirmation.
Example:
A head and shoulders pattern confirmed by falling RSI strengthens the bearish outlook.
A cup and handle confirmed by rising volume adds validity to a bullish move.
This multi-factor approach reduces false signals and increases accuracy.
Advantages of Technical Analysis
Quick Decision-Making: Real-time charts provide instant trading opportunities.
Universal Application: Works across stocks, forex, commodities, and crypto.
Captures Market Psychology: Reflects fear and greed through patterns.
Supports Short-Term Trading: Ideal for day traders and swing traders.
Limitations of Technical Analysis
Subjectivity: Two traders may interpret the same chart differently.
False Breakouts: Patterns may fail, especially in volatile markets.
Lagging Indicators: Some tools like moving averages react after price changes.
No Fundamental Insight: It ignores earnings, news, and macroeconomic data.
Conclusion
Technical analysis is both an art and a science. By studying chart patterns, trends, and indicators, traders can anticipate potential price moves with greater confidence. However, success in technical analysis demands discipline, patience, and risk management. Patterns don’t guarantee results; they only increase probabilities. Combining chart patterns with volume analysis, market context, and proper stop-loss strategies creates a strong foundation for consistent profitability.
Ultimately, mastering technical analysis means understanding how market psychology shapes price movements—and using that knowledge to stay one step ahead of the crowd.
Patterns & Their Behaviors Friends I have Explained one of the complex patterns
i have explained how they are complex in nature and How they tend to behave on real time
If you have any Questions please feel free to ask me
This is education content
Good luck

Part 2 Ride The Big Moves How Option Prices Are Determined
Option prices are influenced by several factors. The most common model used to calculate the theoretical value of an option is the Black-Scholes Model. The key factors that affect option prices include:
Underlying Asset Price: The higher the price of the asset, the higher the value of a call option and the lower the value of a put option.
Strike Price: The difference between the strike and current market price affects the intrinsic value of the option.
Time to Expiration: The more time left until expiration, the higher the premium (because there’s more time for the option to become profitable).
Volatility: Higher volatility increases option premiums since the chance of large price movement rises.
Interest Rates and Dividends: These can slightly influence option values, especially for longer-term options.

Part 7 Trading Master Class With Experts How Options Work
Let’s take an example:
Suppose you buy a Call Option on Reliance Industries with a strike price of ₹2,500 and pay a premium of ₹50 per share.
If the stock rises to ₹2,600, you can exercise your right to buy at ₹2,500, making ₹100 profit per share (₹2,600 – ₹2,500), minus the premium (₹50). Net profit = ₹50.
If the stock falls below ₹2,500, you will not exercise the option. You lose only the premium of ₹50.
Similarly, a Put Option works the opposite way:
If you buy a Put Option with a strike price of ₹2,500 and the stock falls to ₹2,400, you can sell it at ₹2,500 and make a profit of ₹100 per share minus the premium.
This flexibility makes options a powerful tool for speculation and risk management.

Smart Money Concepts (SMC) and Institutional Order Flow1. Introduction: Understanding the Market Beyond Retail Noise
Most retail traders lose money not because they lack effort but because they follow the market’s surface moves rather than its hidden intentions. Price charts show what has already happened — but Smart Money Concepts (SMC) and Institutional Order Flow reveal why it happened.
SMC is a modern trading framework built on the idea that large institutions, hedge funds, and banks — the so-called “smart money” — drive market trends. Their goal is not to “trade” but to accumulate and distribute liquidity. Retail traders, often unknowingly, provide that liquidity.
SMC teaches traders how to identify where institutional players are entering and exiting positions. It focuses on understanding liquidity, market structure, order blocks, and the psychology of accumulation and manipulation.
2. The Foundation of Smart Money Concepts
Smart Money Concepts evolved from the teachings of ICT (Inner Circle Trader) and Wyckoff theory. It blends market structure analysis, liquidity theory, and institutional footprints into a unified framework.
At its core, SMC assumes that the market moves through a cycle driven by institutional intentions:
Accumulation – Smart money builds long positions quietly.
Manipulation (Stop Hunt) – Price is driven below or above key levels to trigger liquidity.
Distribution (Expansion) – Price moves strongly in the intended direction.
Re-Accumulation or Redistribution – Trend continuation or reversal zones form.
The retail mindset looks for patterns (double tops, indicators), but SMC looks for intentions — where smart money must buy or sell to fill massive orders.
3. The Core Principles of Smart Money Concepts
A. Market Structure
Market structure is the backbone of SMC. It identifies the direction of institutional order flow — whether the market is making higher highs and higher lows (bullish) or lower highs and lower lows (bearish).
Key structural elements include:
BOS (Break of Structure) – When price breaks the previous swing high or low, signaling a continuation.
CHOCH (Change of Character) – A shift from bullish to bearish structure (or vice versa), often indicating a reversal.
Market structure shows where institutions are likely to transition from accumulation to expansion phases.
B. Liquidity
Liquidity refers to clusters of orders resting at obvious levels — such as stop-losses above swing highs or below swing lows. Institutions need liquidity to fill large positions, so they manipulate price toward these zones.
Common liquidity pools include:
Equal Highs/Lows – Where stop orders are concentrated.
Trendline Liquidity – Price repeatedly bounces off a line, attracting more retail traders.
Session Highs/Lows – Intraday liquidity pools, especially during London and New York sessions.
Once these areas are raided, the true move — aligned with institutional direction — often begins.
C. Order Blocks
An order block (OB) is the last opposite candle before an impulsive move. It represents the footprint of institutional accumulation (in bullish moves) or distribution (in bearish moves).
Types:
Bullish Order Block – The last bearish candle before a strong bullish push.
Bearish Order Block – The last bullish candle before a strong bearish drop.
Price often retraces to these OBs to “rebalance” before continuing. They act as institutional zones of interest.
D. Imbalance or Fair Value Gaps (FVG)
When price moves aggressively in one direction, it can leave behind an imbalance — a region with unfilled orders. These are inefficiencies institutions may later revisit to complete their transactions.
In SMC, traders look for FVG retracements as potential entries when the overall structure aligns with institutional direction.
E. Inducement
Before price reaches an order block or liquidity pool, it often creates smaller “bait” structures — inducements — to trap early traders. For example, a mini double-top before a liquidity sweep ensures enough orders are available for institutions to enter.
4. Institutional Order Flow: The Engine Behind SMC
Order flow represents the sequence and intention of institutional buying and selling. Unlike retail traders who react to indicators, institutions plan their trades around liquidity collection.
Here’s how order flow unfolds institutionally:
Position Building (Accumulation) – Institutions buy/sell in fragments at key zones, keeping price within a range.
Liquidity Engineering – They allow retail traders to establish positions by creating obvious patterns (e.g., false breakouts).
Stop Hunt / Manipulation Phase – Price violently breaks the structure to grab liquidity (stops and pending orders).
Market Expansion – Once liquidity is captured, institutions drive price toward their true profit targets.
Distribution / Exit – They unload positions gradually, creating new liquidity traps for the next cycle.
This cycle repeats on all timeframes, from the 1-minute chart to the daily.
5. The Smart Money Cycle: Accumulation to Distribution
To understand institutional order flow, visualize the market as a four-phase process:
Phase 1: Accumulation
Price ranges in a tight zone. Retail traders view this as consolidation, but institutions are building positions quietly. Volume may rise slightly but with no clear trend.
Clues:
Flat structure with equal highs/lows.
Multiple liquidity pools forming on both sides.
Inducement wicks below or above range lows/highs.
Phase 2: Manipulation
The market suddenly sweeps one side of the range — a fake breakout. This is the “stop hunt” where liquidity is collected. Retail traders get trapped here.
Clues:
A large candle pierces a liquidity pool.
Market immediately reverses, leaving a wick.
FVG or order block forms right after.
Phase 3: Expansion
Institutions push price rapidly in their true direction. This is the most profitable phase — the trend traders catch late if they don’t understand SMC.
Clues:
Strong BOS confirming new structure.
Continuous creation of higher highs/lows (bullish) or lower highs/lows (bearish).
Minor retracements to order blocks or FVGs.
Phase 4: Distribution
As price matures, institutions begin to offload their positions. This often looks like a slowdown in momentum or a range after a strong move — preparing for the next cycle.
6. SMC Entry Models: Precision with Institutional Logic
SMC traders use refined entry techniques to align with order flow and liquidity behavior.
1. Liquidity Grab + CHOCH
Wait for a liquidity sweep (stop hunt), followed by a structure shift in the opposite direction. This combination often signals a true reversal.
2. Order Block Retest
Once a BOS occurs, price frequently returns to the last valid order block. This provides a high-probability entry aligned with institutional footprints.
3. FVG Mitigation
After a sharp move, look for price to retrace partially into the imbalance zone before continuing.
4. Premium vs Discount Zones
Using a Fibonacci tool, smart money looks to sell in premium zones (above 50%) and buy in discount zones (below 50%) relative to the swing range.
These methods ensure entries occur in areas of high institutional interest rather than random mid-range levels.
7. Time and Session Theory in SMC
Institutions trade based on global liquidity timings:
London Open (7:00–9:00 GMT) – Initial liquidity sweep and false moves.
New York Open (12:00–14:00 GMT) – Real directional push; often the true institutional move.
Asia Session (00:00–05:00 GMT) – Accumulation and low-volatility phases.
Understanding session order flow allows traders to predict when manipulation or expansion phases are likely to occur.
8. Multi-Timeframe Confluence: The SMC Edge
SMC traders never analyze a single timeframe in isolation. Instead:
Higher timeframe (HTF) defines the directional bias (institutional order flow).
Lower timeframe (LTF) offers refined entries using liquidity sweeps and order blocks.
For example:
Daily or 4H chart may show bullish structure.
15M or 5M chart reveals liquidity grabs and CHOCH for precise entry points.
This top-down approach aligns retail participation with institutional timing.
9. Tools and Indicators Supporting SMC
Although SMC is primarily a price-action-based framework, a few tools can enhance precision:
Volume Profile or Delta Order Flow – Shows where large volume or aggressive buying/selling occurred.
Session Indicators – Visualize liquidity timings.
FVG and Order Block Indicators – Mark potential mitigation zones automatically.
However, the true power of SMC lies in naked chart reading — interpreting pure price movement through logic, not lagging signals.
10. Psychology Behind Smart Money Movements
Institutions exploit human behavior. Most retail traders operate on fear and greed — placing stops too close, chasing breakouts, or trading without patience. SMC reverses this psychology.
Smart Money:
Buys when others panic (fear).
Sells when others are euphoric (greed).
Creates fake moves to manipulate these emotions.
A trader adopting SMC must rewire their mindset: the goal is not to follow the crowd but to think like the institutions who move the crowd.
11. Common Mistakes in Applying SMC
Overdrawing zones – Not every candle is an order block. Quality > quantity.
Ignoring HTF bias – Taking entries against the dominant order flow reduces accuracy.
Trading every liquidity grab – Wait for confirmation via CHOCH or BOS.
No patience for mitigation – Smart money retraces; traders must wait for it.
Overleveraging – Even with SMC precision, risk management remains key.
12. Risk Management in SMC Trading
Institutions never risk randomly, and neither should retail traders.
Stop-Loss Placement – Beyond liquidity zones or invalidation points.
Risk-to-Reward (RR) – Minimum 1:3 setups are standard.
Partial Profits – Secure profits at intermediate FVGs or liquidity pools.
Trade Management – Move stops to breakeven after structural confirmation.
Risk control ensures survival even through inevitable false setups.
13. The Power of Institutional Order Flow in Modern Markets
With algorithmic and HFT systems dominating liquidity today, understanding order flow has become vital. Market moves are not random — they reflect large-scale positioning, hedging, and rebalancing activities.
Institutional order flow analysis allows traders to:
Detect accumulation zones before the trend.
Avoid fake breakouts.
Enter with optimal timing.
Predict where liquidity will be targeted next.
When combined with volume analysis or footprint charts, order flow provides near-institutional visibility into price intention.
14. Conclusion: Trading with the Smart Money
Smart Money Concepts and Institutional Order Flow represent the evolution of trading psychology — shifting focus from indicators to intent, from reaction to anticipation.
By mastering liquidity theory, order blocks, and market structure, traders can align with institutional footprints rather than fall victim to them. The market is not random; it’s a battlefield of liquidity, manipulation, and precision — and SMC is the map that reveals the hidden strategy of the elite.
The Need for a Consistent Trading PlanIntroduction
Trading in financial markets—whether in equities, commodities, forex, or derivatives—is often perceived as an exciting path to wealth creation. However, behind the scenes of every successful trader lies one defining trait: consistency. Consistency is not born out of luck or intuition—it is the result of a well-structured, disciplined, and thoroughly tested trading plan. A consistent trading plan acts as the trader’s compass, providing clarity, direction, and control in an environment that is inherently uncertain and volatile.
Without a trading plan, traders often operate based on emotions, market noise, or impulse decisions, which inevitably leads to losses. On the other hand, a well-defined and consistently executed trading plan transforms randomness into a structured process. It allows traders to manage risk, measure performance, and refine strategies over time. This essay explores the concept of a consistent trading plan, its importance, components, and the discipline required to execute it effectively.
1. What is a Trading Plan?
A trading plan is a detailed, rule-based framework that defines how a trader approaches the market. It includes the criteria for identifying trade opportunities, entry and exit rules, position sizing, risk management strategies, and post-trade evaluation procedures.
Think of it as a business plan for trading. Just as a business outlines its goals, market strategy, and risk controls, a trader’s plan defines how they will interact with the market to achieve consistent profitability.
A good trading plan answers key questions such as:
What markets and instruments will I trade?
What is my risk per trade and overall capital exposure?
What are my entry and exit signals?
How will I track my performance and learn from my mistakes?
By answering these questions in advance, traders avoid making impulsive decisions in the heat of the moment.
2. Why Consistency Matters in Trading
In trading, success is not measured by one or two profitable trades, but by long-term, repeatable performance. Market conditions constantly change—bullish trends, bearish phases, sideways consolidations, or high-volatility spikes. A consistent trading plan helps traders adapt to these variations while keeping their emotions under control.
Consistency offers several key benefits:
Reduces Emotional Trading:
Fear and greed are the two biggest enemies of traders. A consistent plan acts as a stabilizer, ensuring decisions are based on predefined logic rather than emotional reactions.
Enables Objective Decision-Making:
Without a plan, traders may chase market noise or react to every piece of news. A trading plan enforces objectivity—each trade is taken based on established criteria.
Improves Risk Management:
Consistent execution ensures that traders control losses and protect their capital through stop-loss levels and position sizing rules.
Enhances Learning and Refinement:
When trades follow a structured plan, it becomes easier to review results, identify strengths and weaknesses, and make data-driven improvements.
Builds Long-Term Confidence:
Confidence in trading doesn’t come from winning trades—it comes from knowing you’re following a system that works over time. Consistency breeds trust in one’s process.
3. Components of a Consistent Trading Plan
To build a consistent trading plan, traders must focus on certain core components that collectively define their market approach:
a. Trading Goals and Objectives
Every plan begins with clear, measurable goals. These may include monthly return targets, maximum drawdown limits, or growth percentages. Goals must be realistic and aligned with one’s risk tolerance, time availability, and experience level.
For example, a goal like “I aim for 2–3% monthly returns while limiting losses to 1% per trade” gives structure to performance evaluation.
b. Market and Timeframe Selection
Consistency requires focus. A trader cannot master every market at once. Choosing a few instruments (like NIFTY, BANKNIFTY, or gold futures) and timeframes (1-day, 1-hour, or 15-minute charts) helps maintain clarity and specialization.
c. Entry and Exit Criteria
This section defines when to buy or sell. Traders may use technical indicators (e.g., moving averages, RSI, MACD), chart patterns (e.g., breakouts, pullbacks), or price action setups. The entry must be rule-based, not guesswork. Similarly, exits should be pre-planned—whether taking profits at a target level or cutting losses with a stop-loss.
d. Risk Management and Position Sizing
No plan is complete without robust risk management. Professional traders prioritize capital preservation above profit. A common rule is to risk only 1–2% of total capital per trade.
Position sizing—how many shares or contracts to buy—should be determined mathematically, based on account size and stop-loss distance.
e. Trade Management Rules
A consistent trader doesn’t simply “enter and hope.” Trade management involves adjusting stop-loss levels, booking partial profits, or trailing positions as the market evolves. This keeps risk and reward balanced throughout the trade.
f. Record-Keeping and Journaling
Every trade should be documented: the reasoning, entry and exit points, emotional state, and outcome. Reviewing this journal regularly provides invaluable insights into behavioral patterns and strategy performance.
g. Review and Improvement Cycle
A consistent trading plan is dynamic. Markets evolve, and so must the plan. Regular performance reviews help identify areas for improvement. The key is evolution, not random changes—adjustments should be data-driven.
4. The Psychological Edge of Consistency
A consistent trading plan doesn’t just enhance strategy—it strengthens psychology. The emotional rollercoaster of trading—fear of missing out (FOMO), revenge trading, overconfidence after wins, panic after losses—can destroy discipline.
Consistency offers psychological stability by turning trading into a structured process rather than an emotional gamble.
Here’s how:
Reduces Anxiety: Knowing you have clear rules removes uncertainty and decision fatigue.
Builds Patience: Traders wait for valid setups instead of forcing trades.
Encourages Discipline: You learn to follow the plan, not market noise.
Manages Expectations: When you know your system’s average win rate and risk-reward ratio, you stop chasing unrealistic profits.
In essence, consistency transforms trading from a game of luck into a business of probability and process.
5. The Dangers of Trading Without a Plan
Many traders enter markets driven by excitement, social media influence, or quick-profit fantasies. Without a plan, they rely on instincts, tips, or random indicators—eventually leading to repeated losses.
Here’s what happens without consistency:
Emotional Trading: Decisions are based on fear, greed, or impatience.
Overtrading: Jumping into multiple trades without strategy or confirmation.
Lack of Risk Control: Traders often hold onto losing trades, hoping for reversal.
No Learning Path: Without tracking and review, mistakes are repeated endlessly.
Statistics suggest that over 90% of retail traders lose money, not because the markets are unfair, but because they lack a structured, consistent plan.
6. Building Consistency Through Testing and Backtesting
Before going live with any plan, traders must test their strategies on historical data (backtesting) and real-time demo trading (forward testing). This process validates whether the plan has a statistical edge.
For example, if a swing trader tests a breakout strategy on the NIFTY 50 index and finds it profitable across multiple time periods, they gain confidence in executing it consistently. Testing filters out randomness and reveals realistic performance expectations—win rates, drawdowns, and average returns.
7. Adapting Consistency to Market Conditions
While consistency is vital, rigidity can be harmful. A consistent trading plan doesn’t mean never changing—it means changing systematically.
For instance, in volatile markets, a trader might widen stop-loss levels or reduce position size. During low-volatility phases, they might switch to mean-reversion strategies. The key is to maintain the same disciplined process even when strategies are adjusted.
8. Consistency in Risk and Money Management
Consistency extends beyond strategy execution—it must also apply to money management. Traders who randomly change lot sizes, risk percentages, or capital allocation undermine their own progress.
A consistent approach ensures:
Stable risk per trade.
Balanced portfolio exposure.
Protection against large drawdowns.
Even with a 60% win rate, consistent risk control ensures long-term profitability.
9. The Role of Patience and Discipline
Two pillars support every consistent trading plan: patience and discipline.
Patience allows traders to wait for the right setups; discipline ensures they act according to the plan, even when tempted to deviate. The best traders are not those who predict markets perfectly, but those who execute consistently under all conditions.
10. Case Study Example
Consider two traders, A and B.
Trader A follows a defined swing trading plan: trades only NIFTY and BANKNIFTY, risks 1% per trade, uses a 2:1 risk-reward ratio, and journals every trade.
Trader B trades based on social media tips, changes indicators weekly, and risks variable amounts based on “gut feeling.”
Over a year, Trader A may have losing streaks but will likely grow steadily. Trader B, despite some big wins, will end up inconsistent and likely lose capital. The difference is not skill—it’s discipline and consistency.
11. Conclusion
In the world of trading, consistency is the bridge between knowledge and success. The market rewards those who operate with structure, patience, and emotional control—qualities only a consistent trading plan can instill.
A trading plan does not guarantee profits in every trade, but it guarantees process integrity—a structured way to manage uncertainty. With a consistent plan, traders can measure progress, adapt intelligently, and sustain longevity in the markets.
Ultimately, trading is not about predicting every market move—it’s about preparing for every possibility. And that preparation begins with one essential tool: a consistent trading plan.

Part 6 Learn Instiutitonal Trading Factors Influencing Option Prices
Option prices (premiums) are affected by several variables, collectively analyzed under option pricing models such as the Black-Scholes model. The main factors include:
Underlying Asset Price: Higher prices increase call premiums and decrease put premiums.
Strike Price: The closer the strike price is to the current price, the higher the premium.
Volatility: More volatility means higher premiums due to increased uncertainty.
Time to Expiry: Longer durations mean more time value.
Interest Rates: Higher interest rates slightly increase call premiums.
Dividends: Expected dividends can reduce call premiums and increase put premiums.

The Inflation Nightmare: A Global Economic Crisis UnfoldingUnderstanding the Roots of Inflation
Inflation occurs when the general price level of goods and services rises, eroding purchasing power. While moderate inflation is a natural byproduct of economic growth, the current surge is driven by a confluence of factors.
Monetary Policies and Excess Liquidity
Central banks worldwide, in response to the COVID-19 pandemic, adopted aggressive monetary policies, including slashing interest rates and implementing quantitative easing. These measures aimed to stimulate economic activity but also led to an unprecedented increase in the money supply. As the economy began to recover, this excess liquidity contributed to rising demand, outpacing supply and fueling inflation.
Supply Chain Disruptions
The pandemic-induced disruptions in global supply chains have had lasting effects. Lockdowns, labor shortages, and transportation bottlenecks have hindered the production and distribution of goods, leading to shortages and, consequently, higher prices. Industries such as semiconductors, energy, and agriculture have been particularly affected, with ripple effects across various sectors.
Geopolitical Tensions and Energy Prices
Geopolitical events, notably the conflict in Ukraine, have exacerbated energy prices. Sanctions and trade restrictions have disrupted the supply of oil and natural gas, leading to soaring energy costs. Higher energy prices increase production costs across industries, from manufacturing to agriculture, thereby contributing to overall inflation.
Labor Market Dynamics
In many advanced economies, labor markets have tightened, with unemployment rates reaching historic lows. This scarcity of workers has led to increased wages as employers compete for talent. While higher wages are beneficial for workers, they also lead to higher production costs, which businesses often pass on to consumers in the form of higher prices.
Global Implications of Rising Inflation
The ramifications of persistent inflation are far-reaching, affecting various aspects of the global economy.
Erosion of Purchasing Power
For consumers, inflation means that their money buys less than before. Essential goods such as food, housing, and healthcare have seen significant price increases, disproportionately impacting low- and middle-income households. This erosion of purchasing power can lead to decreased standards of living and increased poverty rates.
Central Bank Dilemmas
Central banks face a delicate balancing act. To combat inflation, they may raise interest rates, which can cool economic activity and potentially lead to a recession. Conversely, maintaining low rates to support growth can exacerbate inflation. The Federal Reserve's struggle with this dilemma has been evident, with critics arguing that prolonged low-interest rates contributed to the current inflationary pressures.
American Enterprise Institute
Investment Market Volatility
Inflation impacts investment markets by altering the real returns on assets. Equities may suffer as higher costs squeeze corporate profits, while fixed-income securities lose value as interest rates rise. Commodities like gold and oil may see price increases, but their volatility can deter investors seeking stability. This environment has led to increased market volatility, with investors reassessing risk and return expectations.
Social and Political Unrest
Economic hardship resulting from inflation can lead to social unrest. Protests and strikes have erupted in various countries as citizens demand government intervention to address rising costs. Politicians face mounting pressure to implement policies that can alleviate the burden on consumers without stifling economic growth.
Sectoral Impacts
Different sectors experience inflation differently, with some benefiting and others suffering.
Housing Market
In many regions, housing prices have surged due to increased demand and limited supply. While homeowners may benefit from rising property values, prospective buyers face affordability challenges. Renters also feel the pinch as landlords pass on increased costs.
Technology Sector
The technology sector, particularly semiconductor manufacturing, has been affected by supply chain disruptions. Shortages of key components have led to delays and increased costs, impacting everything from smartphones to automobiles.
Agriculture and Food Industries
Rising energy and labor costs, coupled with supply chain issues, have led to higher food prices. Farmers face increased input costs, while consumers experience higher grocery bills. This sector's challenges are compounded by climate-related events affecting crop yields.
Policy Responses and Proposed Solutions
Governments and central banks have implemented various measures to combat inflation.
Monetary Tightening
Central banks have raised interest rates to curb inflation. While this can help reduce demand, it also risks slowing economic growth and increasing borrowing costs.
Fiscal Stimulus and Subsidies
Some governments have introduced subsidies to alleviate the impact of rising costs on consumers. However, such measures can be fiscally burdensome and may not address the underlying causes of inflation.
Supply-Side Reforms
Addressing supply chain bottlenecks and increasing production capacity can help alleviate inflationary pressures. Investments in infrastructure and technology can enhance efficiency and reduce costs in the long term.
Wage and Price Controls
In extreme cases, governments may consider implementing wage and price controls to directly limit inflation. However, such measures can lead to shortages and reduced quality of goods and services if not carefully managed.
Looking Ahead: Navigating the Inflationary Landscape
The path forward requires a balanced approach that addresses both demand and supply factors contributing to inflation. Policymakers must remain vigilant, adapting strategies as economic conditions evolve. International cooperation is also crucial, as global supply chains and markets are interconnected.
For individuals, financial planning becomes paramount. Diversifying investments, controlling debt, and focusing on savings can provide some protection against inflation's erosive effects. Staying informed and adaptable will be key to navigating this challenging economic landscape.
Conclusion
The current inflationary crisis is a complex phenomenon with deep-rooted causes and widespread effects. Its resolution will require coordinated efforts across governments, central banks, businesses, and individuals. While the path to stability may be fraught with challenges, proactive and informed actions can mitigate the adverse impacts and pave the way for a more resilient economic future.
