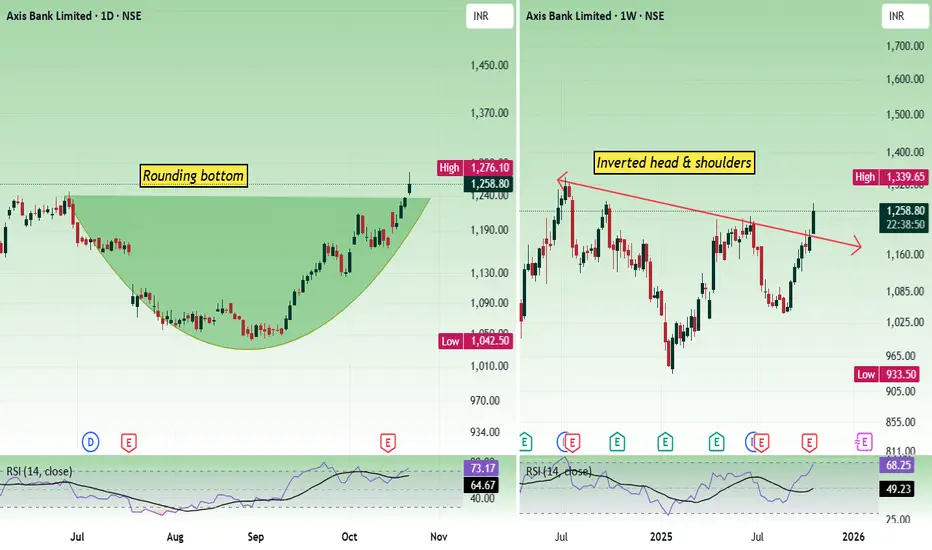
Axis bank - Multi time frame analysisIn the daily time frame, the price has formed a rounding bottom pattern. In the weekly time frame, the price has formed an inverted head and shoulders pattern. Both are bullish patterns.
As long as the price is sustained above 1200, bulls have the chance to move the price up.
Price can bounce from the level 1230 - 1245.
If price shows bearish strength from the current levels and falls down, buy above 1240 with the stop loss of 1222 for the targets 1258, 1276, 1294 and 1312.
If the price opens flat and shows bullish strength, buy above 1260 with the stop loss of 1244 for the targets 1274, 1288, 1304 and 1318.
Always do your analysis before taking any trade.
Trade ideas
AXISBANK 1 Dya Time Frame 📈 Intraday Resistance Levels
R1 (Standard Pivot): ₹1,249.50
R2 (Fibonacci Pivot): ₹1,260.20
R3 (Camarilla Pivot): ₹1,241.92
R4 (Woodie's Pivot): ₹1,245.70
📉 Intraday Support Levels
S1 (Standard Pivot): ₹1,232.70
S2 (Fibonacci Pivot): ₹1,226.60
S3 (Camarilla Pivot): ₹1,232.68
S4 (Woodie's Pivot): ₹1,217.05
Blockchain and Tokenized Assets1. Introduction to Blockchain Technology
Blockchain is a decentralized digital ledger that records transactions across a network of computers in a secure, transparent, and immutable manner. Unlike traditional centralized systems, blockchain eliminates the need for intermediaries, enabling peer-to-peer transactions that are verified through consensus mechanisms.
1.1 Key Features of Blockchain
Decentralization: Data is not stored in a single location but distributed across a network of nodes, reducing vulnerability to attacks or system failures.
Transparency: Every transaction is recorded and visible to all participants in the network, fostering trust and accountability.
Immutability: Once a transaction is validated and added to the blockchain, it cannot be altered or deleted, ensuring integrity.
Security: Advanced cryptographic techniques protect transaction data from unauthorized access or tampering.
1.2 Types of Blockchains
Public Blockchain: Open to anyone (e.g., Bitcoin, Ethereum), promoting transparency but requiring energy-intensive consensus protocols like Proof of Work (PoW).
Private Blockchain: Restricted to selected participants, often used by enterprises to enhance efficiency and confidentiality.
Consortium Blockchain: Controlled by a group of organizations, offering a balance between decentralization and privacy.
2. Tokenized Assets: Definition and Concept
Tokenized assets represent real-world or digital assets in the form of digital tokens on a blockchain. Essentially, they are a digital representation of ownership or a claim on an underlying asset, such as real estate, equities, commodities, or even art.
2.1 How Tokenization Works
Tokenization involves converting the rights to an asset into a blockchain-based digital token. Each token is uniquely identifiable, can be traded on digital platforms, and carries ownership rights or benefits associated with the underlying asset.
For example:
A commercial property worth $1 million could be tokenized into 1 million tokens, each representing $1 of ownership.
These tokens can be bought, sold, or traded on digital marketplaces without the traditional friction of physical asset transfer.
2.2 Types of Tokenized Assets
Security Tokens: Represent ownership of real-world financial assets such as stocks, bonds, or revenue-sharing agreements. These are regulated under securities laws.
Utility Tokens: Grant access to a product or service within a blockchain ecosystem, like tokens used in decentralized applications (dApps).
Asset-Backed Tokens: Linked to tangible or intangible assets like gold, real estate, or intellectual property.
Non-Fungible Tokens (NFTs): Unique tokens representing ownership of digital or physical collectibles, art, or intellectual property.
3. Advantages of Blockchain and Tokenized Assets
Blockchain and tokenized assets provide several benefits over traditional financial systems:
3.1 Increased Liquidity
Traditionally, assets like real estate, fine art, or private equity have low liquidity due to complex legal processes and high transaction costs. Tokenization fractionalizes these assets, allowing smaller investors to participate and enabling easier, faster trading.
3.2 Transparency and Trust
Blockchain ensures that all transactions are recorded transparently and securely. Tokenized assets’ ownership can be traced with a clear chain of custody, reducing fraud and disputes.
3.3 Reduced Costs and Intermediaries
By eliminating middlemen such as brokers, clearinghouses, and custodians, blockchain lowers transaction fees and streamlines processes. Smart contracts—self-executing code on blockchain—automate asset transfers and payments efficiently.
3.4 Global Accessibility
Tokenized assets can be traded across borders without the need for traditional banking infrastructure. This opens investment opportunities to a global audience and democratizes access to high-value assets.
3.5 Programmable Assets
Smart contracts allow tokenized assets to carry automated rules, such as dividend payments, voting rights, or rental income distribution, enhancing efficiency and reducing human errors.
4. Applications of Tokenized Assets
Tokenized assets are being applied across multiple sectors, transforming traditional investment models.
4.1 Real Estate
Real estate is one of the most prominent use cases. Fractional ownership via tokenization enables investors to buy shares of high-value properties, participate in global real estate markets, and receive rental income through smart contracts.
4.2 Financial Securities
Tokenization of stocks, bonds, and ETFs allows instant settlement, 24/7 trading, and lower costs. Some platforms now offer tokenized equity, enabling investors to trade private company shares on secondary markets.
4.3 Commodities and Precious Metals
Gold, silver, oil, and other commodities can be tokenized for easier trading and storage. Investors can gain exposure without physically holding the asset.
4.4 Art and Collectibles
NFTs have revolutionized the art market, allowing digital and physical artworks to be tokenized and sold globally. Blockchain ensures provenance and authenticity.
4.5 Intellectual Property
Patents, trademarks, and licenses can be tokenized, allowing creators to sell or license rights while maintaining transparency of ownership.
5. Challenges and Risks
Despite their potential, blockchain and tokenized assets face certain challenges:
5.1 Regulatory Uncertainty
Tokenized assets, particularly security tokens, must comply with complex regulatory frameworks that differ across countries. Uncertainty around classification and legal enforcement can hinder adoption.
5.2 Market Volatility
Digital tokens, especially in cryptocurrency markets, can be highly volatile. This risk extends to tokenized assets linked to speculative markets.
5.3 Technology Risks
While blockchain is secure, vulnerabilities in smart contracts or poorly designed platforms can lead to hacks, fraud, or loss of funds.
5.4 Liquidity Concerns
While tokenization enhances liquidity, some tokenized markets may still lack sufficient participants, causing price inefficiencies or delays in trade execution.
5.5 Legal and Ownership Disputes
Although blockchain records transactions immutably, disputes over actual asset ownership or misrepresentation can arise, requiring legal arbitration outside the blockchain.
6. The Future of Blockchain and Tokenized Assets
The convergence of blockchain and tokenization has the potential to reshape financial markets fundamentally:
6.1 Integration with Traditional Finance
Financial institutions are increasingly exploring blockchain for asset management, cross-border payments, and securities trading. Tokenized assets could complement traditional investment vehicles, offering more efficient alternatives.
6.2 Democratization of Investment
By lowering investment thresholds and enabling fractional ownership, tokenization could make high-value assets accessible to retail investors, fostering inclusive growth.
6.3 Decentralized Finance (DeFi)
Tokenized assets are the backbone of DeFi, where financial products like lending, borrowing, and yield farming operate without intermediaries. This innovation promises to create an open, transparent financial ecosystem.
6.4 Cross-Border Asset Exchange
Global liquidity pools for tokenized assets can emerge, allowing seamless trading across borders and reducing reliance on local banking infrastructure.
6.5 Enhanced Automation and Efficiency
Smart contracts will continue to automate payments, dividend distribution, and compliance, reducing administrative overhead and human error.
7. Conclusion
Blockchain and tokenized assets represent a paradigm shift in the financial world. They provide unprecedented transparency, efficiency, and accessibility while enabling fractional ownership and global trading. Despite challenges in regulation, technology, and market adoption, the potential of these innovations is immense. As the ecosystem matures, tokenized assets could become a mainstream investment avenue, bridging the gap between traditional finance and the decentralized digital economy.
Investors, businesses, and regulators must navigate this space carefully, embracing its opportunities while mitigating risks. The next decade is likely to witness widespread adoption of tokenized assets, transforming the global financial landscape into a more inclusive, transparent, and efficient system.
Part 2 Candle Stick PatternStrike Price and Expiry Date
Every option has a strike price (the agreed-upon price for buying/selling) and an expiry date (the last date the option can be exercised). These two factors determine an option’s time value and overall profitability.
Premium – The Cost of the Option
The premium is the price paid by the buyer to the seller (writer) of the option. It represents the maximum loss for the buyer and potential profit for the seller if the option expires worthless.

Part 9 Tradding Master ClassOption Greeks: Measuring Sensitivity
The Option Greeks are metrics that measure how different factors affect an option’s price. The key Greeks include:
Delta: Change in option price relative to the underlying asset’s price.
Theta: Time decay effect.
Vega: Sensitivity to volatility changes.
Gamma: Rate of change of Delta.
Rho: Sensitivity to interest rates.
These Greeks help traders understand risk exposure and manage positions scientifically. For example, a trader might use Theta to manage time decay in short-term options or Vega to hedge against volatility spikes. Mastery of Greeks is crucial for professional option traders who aim for consistency and precision.

Cryptocurrency as a digital assetIntroduction
The rise of cryptocurrency has fundamentally transformed the financial and technological landscape. Cryptocurrency is a form of digital asset that relies on cryptography for security and operates independently of a central authority, such as a government or central bank. It represents a shift from traditional, physical forms of money to decentralized, blockchain-based systems. Digital assets like cryptocurrencies have become an integral part of global finance, investment strategies, and technological innovation, driving discussions about the future of money, digital ownership, and decentralized finance (DeFi).
Definition of Cryptocurrency
A cryptocurrency is a type of digital or virtual currency that uses cryptography for secure financial transactions. Unlike traditional currencies, cryptocurrencies are decentralized, meaning they are not issued or controlled by any single authority. They are typically built on a blockchain, which is a distributed ledger that records all transactions across a network of computers. The decentralized and encrypted nature of cryptocurrencies ensures transparency, security, and resistance to censorship or fraud.
Some of the key features of cryptocurrencies include:
Decentralization: No single entity controls the network.
Security: Transactions are secured by cryptographic algorithms.
Anonymity/Pseudonymity: Users can make transactions without revealing personal identities.
Digital Scarcity: Many cryptocurrencies, like Bitcoin, have a limited supply.
Cryptocurrency as a Digital Asset
A digital asset is any asset that exists in digital form and provides economic value. Cryptocurrencies fit into this definition because they are entirely digital, have intrinsic economic value, and can be used for investment, transactions, or as a medium of exchange. Digital assets are increasingly recognized alongside traditional assets like stocks, bonds, and commodities.
Cryptocurrencies are distinct from conventional digital representations of money (like online bank balances) because they:
Exist outside traditional financial institutions.
Can be transferred peer-to-peer without intermediaries.
Are programmatically scarce, meaning algorithms limit their supply (e.g., Bitcoin’s 21 million coin cap).
Can function as programmable money, enabling smart contracts and decentralized applications.
Historical Evolution of Cryptocurrency
The concept of digital currency existed for decades, but modern cryptocurrency began with Bitcoin, introduced in 2008 by an anonymous person or group under the pseudonym Satoshi Nakamoto. Bitcoin aimed to create a decentralized form of money immune to inflation and manipulation by governments.
Key milestones in cryptocurrency history include:
Bitcoin Launch (2009): Bitcoin’s open-source software allowed users to mine, transfer, and store digital currency without a central authority.
Altcoins Emergence (2011 onward): Other cryptocurrencies, called altcoins, were developed, including Litecoin, Ripple, and Ethereum.
Ethereum & Smart Contracts (2015): Ethereum introduced programmable blockchain functionality, enabling smart contracts and decentralized applications (dApps).
DeFi Revolution (2020 onward): Decentralized finance platforms began offering financial services like lending, borrowing, and trading without intermediaries.
Types of Cryptocurrencies
Cryptocurrencies can be broadly categorized based on their purpose and functionality:
Currency Coins:
Example: Bitcoin (BTC), Litecoin (LTC)
Primary function: Medium of exchange, store of value
Platform Coins:
Example: Ethereum (ETH), Solana (SOL)
Primary function: Power decentralized applications and smart contracts
Stablecoins:
Example: Tether (USDT), USD Coin (USDC)
Primary function: Pegged to fiat currencies for stability, reducing volatility
Privacy Coins:
Example: Monero (XMR), Zcash (ZEC)
Primary function: Ensure anonymity and untraceable transactions
Tokenized Assets:
Example: NFT tokens, utility tokens
Primary function: Represent ownership of digital or real-world assets
Blockchain Technology and Cryptocurrency
Blockchain is the backbone of cryptocurrencies. It is a distributed ledger system that stores transactions in blocks, which are linked together using cryptographic hashes. This architecture ensures security, immutability, and transparency.
Key components of blockchain include:
Nodes: Computers that maintain copies of the blockchain.
Consensus Mechanisms: Algorithms like Proof of Work (PoW) and Proof of Stake (PoS) validate transactions.
Smart Contracts: Self-executing contracts that run when certain conditions are met, enabling decentralized applications.
Blockchain technology not only underpins cryptocurrency but also enables other digital assets and innovations, including supply chain management, identity verification, and decentralized finance.
Cryptocurrency as an Investment Asset
Cryptocurrencies are increasingly treated as alternative investments. Investors buy cryptocurrencies to diversify portfolios, hedge against inflation, or capitalize on speculative gains.
Characteristics as an investment:
Volatility: Prices can fluctuate dramatically in short periods, offering opportunities for high returns but also high risks.
Liquidity: Major cryptocurrencies like Bitcoin and Ethereum are highly liquid, while smaller altcoins may be less tradable.
Accessibility: Anyone with an internet connection can participate in crypto markets.
Decentralization: Investment is not tied to traditional financial institutions, reducing exposure to systemic risk.
Institutional adoption has increased the legitimacy of cryptocurrencies, with companies and funds investing in digital assets, offering crypto ETFs, and integrating blockchain solutions.
Cryptocurrency in the Global Economy
Cryptocurrency is reshaping global finance by enabling:
Cross-border transactions: Transfers are faster and cheaper than traditional banking systems.
Financial inclusion: People in underbanked regions can access financial services using digital wallets.
Decentralized finance: Lending, borrowing, and trading can occur without intermediaries.
New economic models: Token economies incentivize network participation and innovation.
However, challenges remain, including regulatory uncertainty, market manipulation, and energy consumption concerns.
Risks and Challenges
While cryptocurrency offers tremendous potential, it also carries significant risks:
Regulatory Risk: Governments worldwide are still defining how to regulate digital assets. Sudden regulatory changes can impact prices.
Security Risk: Hacks and scams are prevalent, and losing private keys can result in permanent loss of funds.
Market Volatility: Prices are highly sensitive to speculation, news, and market sentiment.
Environmental Concerns: Proof of Work cryptocurrencies, like Bitcoin, consume substantial energy.
Legal and Tax Implications: Tax treatment varies across countries, complicating compliance.
Investors must weigh potential rewards against these risks before entering the market.
Future of Cryptocurrency as a Digital Asset
The future of cryptocurrencies looks promising but uncertain. Key trends shaping the next decade include:
Institutional Adoption: More financial institutions are offering crypto services and investment products.
Central Bank Digital Currencies (CBDCs): Governments may issue their own digital currencies, potentially coexisting with cryptocurrencies.
Technological Innovation: Layer 2 scaling solutions, interoperability protocols, and eco-friendly mining will enhance usability and sustainability.
Integration with Traditional Finance: Crypto may increasingly integrate with banks, payment processors, and stock markets.
Global Regulation: Regulatory clarity will help mainstream adoption while addressing risks like fraud and money laundering.
Cryptocurrencies could evolve from speculative assets to mainstream financial tools, reshaping money, payments, and investment landscapes.
Conclusion
Cryptocurrency represents a paradigm shift in finance, transforming how value is stored, transferred, and invested. As a digital asset, it combines the principles of cryptography, decentralization, and blockchain technology to create secure, transparent, and programmable financial instruments. While cryptocurrencies carry risks, they also offer unprecedented opportunities for global financial inclusion, innovation, and economic efficiency.
Their growing role in global finance, technological advancements, and increasing adoption by individuals, institutions, and governments suggest that digital assets like cryptocurrencies will continue to shape the economic and technological future. For investors, technologists, and policymakers, understanding cryptocurrency as a digital asset is essential to navigating the rapidly evolving financial landscape.
Part 1 Intraday Trading Definition and Mechanism:
Option trading is a financial contract that gives the buyer the right, but not the obligation, to buy or sell an underlying asset (like stocks, indices, or commodities) at a predetermined price within a specified period. There are two types: Call options (right to buy) and Put options (right to sell). Traders use options to hedge risks or speculate on price movements. Unlike direct stock trading, options allow leverage, meaning a small investment can control a larger position. However, the risk of losing the entire premium exists if the option expires worthless.

Part 2 Ride The Big Moves Key Components of Option Contracts
Every option has specific terms that determine its value and use:
Underlying Asset: The stock, index, or commodity the option is based on.
Strike Price: The pre-decided price at which the buyer can buy or sell the asset.
Premium: The price paid to purchase the option.
Expiry Date: The date when the option contract ends.
Lot Size: The number of shares per contract (e.g., 50 shares for NIFTY options).
The value of an option depends on factors such as the market price of the asset, time left to expiry, and volatility. These factors influence whether the option is in-the-money (ITM), at-the-money (ATM), or out-of-the-money (OTM).

The Challenge of Growing a Small Trading Account1. Understanding the Limitations of a Small Account
The first challenge of growing a small trading account is understanding its inherent limitations. A small account, often ranging from a few hundred to a few thousand dollars, restricts the trader's ability to diversify and take large positions. Limited capital means that even minor mistakes can significantly affect overall performance.
Position Sizing: Small accounts require smaller trade sizes to avoid devastating losses. However, this also limits profit potential because even successful trades generate modest returns.
Diversification Constraints: With limited funds, traders cannot spread capital across multiple assets or markets, increasing vulnerability to single trade losses.
Leverage Risks: Many traders turn to leverage to amplify gains, but higher leverage dramatically increases the risk of margin calls and complete account wipeouts.
2. Psychological Pressures of Small Account Trading
Trading with a small account exerts intense psychological pressure. The fear of losing even a small percentage of capital can lead to hesitation or impulsive decision-making. Traders often experience emotional swings that impact their judgment:
Overtrading: Small accounts may push traders to take excessive trades to achieve significant returns, often leading to mistakes.
Fear and Anxiety: Losing a small portion of a tiny account feels proportionally larger, which can magnify fear and trigger panic selling.
Greed: The desire to quickly grow a small account may tempt traders to take risky, high-reward trades that exceed their risk tolerance.
Psychology plays a larger role in small account trading because each trade’s impact is magnified. Successful small account growth requires strict emotional discipline and the ability to detach psychologically from individual trades.
3. The Problem of Compounding Small Gains
A critical challenge in small account trading is generating meaningful growth through compounding. Unlike larger accounts where gains can be substantial with modest percentages, small accounts require higher percentage returns to make a significant impact. For example, turning $500 into $1000 requires a 100% gain, whereas turning $50,000 into $51,000 requires just a 2% gain.
Patience: Traders must accept that growth will be slow if they employ safe, consistent strategies.
Discipline: Consistently capturing small, high-probability trades is essential for gradual compounding.
Strategic Planning: Overly aggressive strategies to achieve fast growth often result in catastrophic losses.
Small account growth is a marathon, not a sprint. Traders must cultivate a mindset focused on consistent performance rather than instant gratification.
4. Risk Management is Paramount
Risk management is the cornerstone of small account trading. Due to limited capital, traders cannot afford large losses. Implementing proper risk controls is critical to survive and thrive:
Setting Stop-Loss Orders: Every trade must have a defined risk limit to prevent disproportionate losses.
Position Sizing: Trades should never risk more than a small percentage (typically 1-2%) of the total account balance.
Risk-Reward Ratio: Traders should aim for trades with a favorable risk-to-reward ratio to ensure long-term profitability.
Neglecting risk management can turn a small account into a zero account very quickly. Therefore, discipline and strict adherence to risk rules are non-negotiable.
5. Strategy Selection for Small Accounts
Choosing the right trading strategy is another major challenge. Aggressive strategies may promise high returns but can devastate small accounts. Conversely, overly conservative strategies may result in negligible growth. Successful small account traders often use:
Scalping and Day Trading: Capturing small price movements multiple times a day allows gradual account growth.
Swing Trading: Identifying medium-term trends can provide higher rewards per trade while controlling risk.
Low-Leverage, High-Probability Trades: Focusing on trades with strong probability setups preserves capital while allowing steady growth.
The key is to find a strategy that balances profitability and risk, tailored to the limitations of a small account.
6. Market Knowledge and Experience
Small account traders cannot afford to learn through trial and error with large losses. Market knowledge and experience are critical:
Technical Analysis Skills: Understanding chart patterns, indicators, and price action helps identify high-probability trades.
Fundamental Awareness: Knowledge of macroeconomic factors, news events, and earnings reports can prevent unexpected losses.
Continuous Learning: Markets evolve, and traders must constantly update their knowledge and adapt strategies.
Experienced traders can navigate the challenges of small account trading more effectively, as they minimize mistakes and capitalize on opportunities.
7. Psychological Pitfalls: Greed vs. Fear
A recurring theme in small account trading is the struggle between greed and fear. Traders often face two conflicting emotions:
Greed: The desire for rapid account growth may lead to oversized trades or chasing high-risk opportunities.
Fear: Fear of losing even a small amount may prevent traders from taking profitable trades or cutting losses promptly.
Balancing these emotions is crucial. Successful traders maintain emotional neutrality, executing trades according to strategy rather than emotion.
8. The Role of Leverage
Leverage can be both a blessing and a curse for small account traders. It magnifies gains, allowing small accounts to potentially grow faster, but it also increases the risk of total account loss:
Controlled Leverage: Using moderate leverage can enhance returns without exposing the account to excessive risk.
Understanding Margin: Traders must understand margin requirements and avoid over-leveraging positions.
Leverage Discipline: The temptation to “go big” with leverage can lead to catastrophic losses if not carefully managed.
Leverage is a tool, not a crutch. Small account traders must respect it and use it strategically.
9. Managing Expectations
Many traders underestimate the time and effort required to grow a small account. Unrealistic expectations often lead to frustration and poor decision-making:
Setting Realistic Goals: A small account should focus on consistent percentage gains rather than absolute dollar amounts.
Accepting Slow Growth: Sustainable growth often means accepting small profits over time rather than chasing large, risky wins.
Evaluating Performance Objectively: Traders should assess performance based on consistency, risk management, and strategy adherence.
Managing expectations helps small account traders avoid burnout and maintain long-term focus.
10. Practical Tips for Growing a Small Trading Account
Despite the challenges, small accounts can grow steadily with discipline and strategy. Here are practical tips:
Prioritize Risk Management: Limit risk per trade to protect capital.
Start Small, Grow Slowly: Focus on consistent, small wins rather than aggressive trades.
Develop a Trading Plan: Define strategy, risk parameters, and performance metrics.
Keep Emotions in Check: Avoid impulsive decisions driven by fear or greed.
Leverage Wisely: Use leverage conservatively to enhance growth without jeopardizing the account.
Track and Analyze Trades: Review successes and failures to improve strategy.
Continuous Learning: Stay informed about markets, trading tools, and evolving strategies.
Conclusion
Growing a small trading account is a journey that demands discipline, patience, and strategic thinking. The challenges range from financial limitations and risk management constraints to intense psychological pressures. However, traders who master these aspects can gradually build capital while developing skills that will serve them throughout their trading careers. Small account trading is less about instant wealth and more about cultivating the mindset, discipline, and strategy needed for long-term success. With careful planning, patience, and persistence, a small account can indeed become a foundation for significant trading growth.
Technical Analysis and Chart PatternsIntroduction to Technical Analysis
Technical Analysis (TA) is the study of historical price and volume data to forecast future price movements in financial markets. Unlike fundamental analysis, which focuses on the intrinsic value of an asset, technical analysis relies on patterns, trends, and statistical indicators to identify trading opportunities. It is widely used across equity, forex, commodities, and cryptocurrency markets by traders of all timeframes, from intraday scalpers to long-term investors.
The foundation of technical analysis rests on three main assumptions:
Market Action Discounts Everything: All information, whether public or private, is already reflected in the current price of an asset.
Prices Move in Trends: Markets follow trends rather than random movement, and identifying these trends can help traders profit.
History Tends to Repeat Itself: Human psychology drives market behavior, and patterns formed in the past tend to recur under similar conditions.
1. Key Principles of Technical Analysis
Trend Analysis
Uptrend: Characterized by higher highs and higher lows. Indicates bullish sentiment.
Downtrend: Characterized by lower highs and lower lows. Indicates bearish sentiment.
Sideways/Range-bound Trend: Occurs when prices move horizontally, often leading to breakout opportunities.
Support and Resistance Levels
Support: A price level where demand is strong enough to prevent further decline. Often a buying opportunity.
Resistance: A price level where selling pressure prevents further rise. Often a selling opportunity.
Breakouts and Breakdowns: Breaching these levels can signal the start of new trends.
Volume Analysis
Volume reflects the intensity of a price movement.
Rising prices with increasing volume confirm trends, whereas divergences (e.g., rising price with falling volume) indicate potential reversals.
Momentum Indicators
Measure the speed and strength of price movements.
Examples: Relative Strength Index (RSI), Moving Average Convergence Divergence (MACD), Stochastic Oscillator.
Moving Averages
Smooth out price fluctuations to identify trends.
Common types: Simple Moving Average (SMA), Exponential Moving Average (EMA).
Crossovers (e.g., 50-day SMA crossing 200-day SMA) are key trading signals.
2. Chart Types
Understanding chart types is crucial for recognizing patterns:
Line Charts
Simple representation connecting closing prices.
Useful for identifying long-term trends but lacks intraday information.
Bar Charts
Displays open, high, low, and close (OHLC) for each period.
Provides more detailed insight into market sentiment.
Candlestick Charts
Originated in Japan; visually appealing and widely used.
Each candlestick shows open, high, low, and close, forming recognizable patterns that signal market direction.
Point and Figure Charts
Ignores time; focuses solely on price changes.
Useful for identifying strong trends and breakout points.
3. Chart Patterns
Chart patterns are visual representations of market psychology, helping traders anticipate future price action. They can be broadly categorized into reversal and continuation patterns.
3.1 Reversal Patterns
Reversal patterns indicate a potential change in trend.
Head and Shoulders
Signifies a trend reversal from bullish to bearish.
Features a left shoulder, a head (higher peak), and a right shoulder.
The neckline is the support level; breaking it confirms the trend reversal.
Inverse Head and Shoulders
Opposite of the standard head and shoulders.
Signals reversal from bearish to bullish.
Double Top
Occurs after an uptrend; two peaks at roughly the same level.
Breaking the support level between the peaks signals a downtrend.
Double Bottom
Occurs after a downtrend; two troughs at a similar level.
Breaking the resistance confirms a bullish reversal.
Triple Top/Bottom
Less common but more reliable than double tops or bottoms.
Indicates stronger resistance or support levels.
3.2 Continuation Patterns
Continuation patterns suggest that the existing trend is likely to continue.
Triangles
Ascending Triangle: Bullish; flat resistance and rising support. Breakout likely upwards.
Descending Triangle: Bearish; flat support and descending resistance. Breakout likely downwards.
Symmetrical Triangle: Neutral; breakout direction depends on the preceding trend.
Flags and Pennants
Short-term consolidation patterns after strong moves.
Flags: Rectangular consolidation; pennants: small symmetrical triangles.
Typically continue in the direction of the previous trend.
Rectangles (Trading Ranges)
Horizontal consolidation between support and resistance.
Breakout indicates trend continuation.
3.3 Candlestick Patterns
Candlestick patterns provide detailed insight into market sentiment:
Single Candlestick Patterns
Doji: Indicates indecision; potential reversal if appearing after a strong trend.
Hammer/Inverted Hammer: Bullish reversal after a downtrend.
Shooting Star: Bearish reversal after an uptrend.
Multiple Candlestick Patterns
Engulfing Pattern: Bullish or bearish reversal depending on candle alignment.
Morning Star/Evening Star: Signals trend reversal.
Three White Soldiers/Three Black Crows: Strong trend continuation patterns.
4. Indicators and Oscillators
Technical analysis often combines chart patterns with indicators:
Trend Indicators
Moving Averages, MACD, ADX (Average Directional Index)
Momentum Indicators
RSI, Stochastic Oscillator, Rate of Change (ROC)
Volatility Indicators
Bollinger Bands, Average True Range (ATR)
Volume Indicators
On-Balance Volume (OBV), Chaikin Money Flow (CMF)
5. Technical Analysis in Trading Strategy
Technical analysis is integrated into different trading strategies:
Day Trading
Focuses on intraday price movements using candlestick patterns and intraday indicators.
Swing Trading
Capitalizes on short to medium-term trends using support/resistance and chart patterns.
Position Trading
Long-term trend following; relies on moving averages, trendlines, and breakout patterns.
Algorithmic Trading
Combines TA rules with automated systems for high-frequency trading.
6. Advantages of Technical Analysis
Quick decision-making due to focus on charts and indicators.
Applicable across different asset classes and timeframes.
Helps identify entry and exit points with greater precision.
7. Limitations of Technical Analysis
Reliance on historical data; past performance doesn’t guarantee future results.
Can produce false signals in highly volatile or low-volume markets.
Requires experience and discipline to interpret patterns accurately.
8. Combining Technical Analysis with Other Tools
Many traders combine TA with fundamental analysis to improve accuracy.
Sentiment analysis, news events, and macroeconomic data can enhance decision-making.
Risk management is essential: stop-loss, position sizing, and portfolio diversification mitigate losses.
Conclusion
Technical analysis and chart patterns provide traders with a structured way to interpret market behavior. While no method guarantees success, mastery of TA enables traders to identify high-probability setups, manage risk, and make informed decisions. With the right combination of pattern recognition, indicator use, and disciplined execution, technical analysis can be a powerful tool in the trader’s arsenal.
By understanding trends, patterns, support/resistance levels, and combining them with indicators and sound risk management, traders can navigate financial markets with greater confidence and precision.
Algorithmic Trading in India1. Introduction to Algorithmic Trading
Algorithmic trading refers to the use of computer algorithms to automate the process of trading financial securities — such as stocks, derivatives, commodities, or currencies — based on predefined rules and market conditions. These algorithms analyze market data, identify trading opportunities, and execute buy or sell orders with minimal human intervention.
At its core, algorithmic trading combines finance, mathematics, and computer science to create intelligent trading systems that can process information and act faster than any human trader. These systems follow strict quantitative models to determine the timing, price, and volume of trades to achieve optimal results.
In India, algorithmic trading gained popularity after the National Stock Exchange (NSE) introduced Direct Market Access (DMA) in 2008, allowing institutional investors to place orders directly into the market using automated systems. Over time, the technology has become more sophisticated, enabling both institutional and retail participation.
2. Evolution of Algorithmic Trading in India
The evolution of algo trading in India can be divided into distinct phases:
a. Pre-2000: Manual Trading Era
Before 2000, most trades were executed manually on the exchange floor. Brokers used phone calls and physical slips to place orders. This process was time-consuming, error-prone, and inefficient.
b. 2000–2010: Electronic Trading Emerges
With the digital transformation of the NSE and BSE, electronic order matching systems replaced the open outcry method. By 2008, the introduction of DMA and co-location facilities laid the foundation for algorithmic and high-frequency trading (HFT).
c. 2010–2020: Rise of Quantitative Strategies
Institutional investors and hedge funds started employing quantitative trading models to gain an edge in execution and strategy. The Securities and Exchange Board of India (SEBI) also began formulating guidelines to regulate algorithmic trading practices, ensuring fairness and transparency.
d. 2020–Present: Democratization and Retail Adoption
With advancements in technology, lower computing costs, and the rise of retail trading platforms (like Zerodha, Upstox, and Dhan), algorithmic trading tools have become accessible to individual investors. Today, APIs, Python-based strategies, and machine learning models are widely used by Indian traders to automate their trades.
3. How Algorithmic Trading Works
Algorithmic trading operates through a systematic process involving data analysis, model development, order execution, and monitoring. Here’s a simplified overview:
Market Data Collection:
Algorithms collect large volumes of market data in real time, including price, volume, and volatility metrics.
Signal Generation:
Based on mathematical models and indicators, the algorithm identifies trading opportunities. For example, if a moving average crossover occurs, it may trigger a buy signal.
Order Execution:
Once a signal is generated, the algorithm places orders automatically through an API or exchange gateway.
Risk Management:
Algorithms include predefined risk controls like stop losses, position sizing, and exposure limits to prevent large losses.
Backtesting and Optimization:
Before deployment, strategies are tested on historical data to validate performance under various market conditions.
Live Monitoring:
After implementation, algorithms are continuously monitored for slippage, latency, and performance.
4. Regulatory Framework in India
The Securities and Exchange Board of India (SEBI) regulates algorithmic trading to maintain market integrity and prevent unfair practices. Some key regulations include:
Exchange Approval:
Brokers and firms must obtain exchange approval for deploying algorithmic strategies.
Order-to-Trade Ratio:
To prevent market overload, SEBI has imposed limits on the ratio of orders to actual trades.
Risk Controls:
Mandatory controls such as price band checks, quantity limits, and self-trade prevention are required.
Co-location and Latency Equalization:
Exchanges provide co-location facilities (servers near exchange data centers) to minimize latency, though SEBI monitors for potential unfair advantages.
Audit Trail:
All algorithmic trades must have complete audit trails for transparency and accountability.
Retail Algorithmic Trading Guidelines (2022):
SEBI recently proposed a framework for retail algo trading via APIs, ensuring that brokers vet and approve algorithms before deployment.
This regulatory vigilance has allowed India to balance innovation with investor protection.
5. Benefits of Algorithmic Trading
Algorithmic trading has numerous advantages over manual methods:
a. Speed and Efficiency
Algorithms can analyze and execute thousands of trades in milliseconds, far faster than any human could.
b. Elimination of Emotion
By following pre-coded rules, algo systems eliminate emotional biases such as fear and greed, leading to disciplined trading.
c. Lower Transaction Costs
Automation reduces manual intervention, improving execution quality and minimizing brokerage costs.
d. Improved Liquidity
With higher trading volumes and tighter spreads, liquidity in the markets improves, benefiting all participants.
e. Enhanced Risk Management
Predefined risk parameters ensure controlled exposure and prevent large drawdowns.
f. Consistent Strategy Execution
Algorithms ensure consistent and accurate execution of strategies without deviation due to human fatigue or emotion.
6. Popular Algorithmic Trading Strategies in India
Several quantitative strategies are commonly deployed by Indian traders and institutions:
a. Trend-Following Strategies
These rely on indicators like Moving Averages, MACD, and RSI to identify momentum and follow the direction of the market trend.
b. Mean Reversion Strategies
These assume that prices will revert to their mean over time. Bollinger Bands and RSI divergence are typical indicators used.
c. Arbitrage Strategies
Exploiting price differences across exchanges or instruments, such as cash-futures arbitrage or inter-exchange arbitrage, to generate risk-free profits.
d. Statistical Arbitrage
Uses complex mathematical models to identify mispriced securities in correlated pairs or baskets.
e. Market Making
Involves placing simultaneous buy and sell orders to profit from the bid-ask spread while providing liquidity.
f. News-Based or Event-Driven Trading
Algorithms use NLP (Natural Language Processing) to interpret news or social sentiment and execute trades based on real-time events.
g. High-Frequency Trading (HFT)
Involves ultra-fast order execution and minimal holding times to exploit micro price movements, typically used by institutions.
7. Technologies Behind Algorithmic Trading
Algorithmic trading relies on an integration of cutting-edge technologies:
Programming Languages:
Python, C++, Java, and R are widely used for coding strategies and handling data.
APIs and Market Data Feeds:
APIs like Zerodha Kite Connect, Upstox API, and Interactive Brokers API allow real-time market access.
Machine Learning & AI:
Predictive models using neural networks, regression, and reinforcement learning enhance decision-making accuracy.
Cloud Computing:
Cloud-based deployment enables low-latency processing and scalability.
Big Data Analytics:
Helps in analyzing terabytes of market and sentiment data for pattern recognition.
Blockchain Integration (Emerging):
Enhances transparency and security in trade settlements.
8. Challenges and Risks in Algorithmic Trading
Despite its advantages, algorithmic trading comes with its share of risks:
a. Technical Failures
System glitches or connectivity issues can lead to massive losses in seconds.
b. Overfitting
Strategies that perform well on historical data may fail in real markets due to over-optimization.
c. Latency Issues
Even microseconds of delay can make or break an HFT strategy.
d. Market Manipulation Risks
Flash crashes or spoofing (placing fake orders) can disrupt markets.
e. High Costs for Infrastructure
Co-location servers and data feeds can be expensive for smaller firms.
f. Regulatory Complexity
Constantly evolving SEBI regulations require compliance and technical audits, adding to operational overhead.
9. Retail Participation and the Rise of DIY Algo Trading
One of the most exciting developments in India’s market landscape is the growing retail participation in algorithmic trading.
Platforms like Streak, AlgoTest, Tradetron, and Dhan Algo Lab have simplified algo development for individual traders by providing drag-and-drop interfaces, backtesting tools, and prebuilt strategies.
Retail traders can now:
Build and deploy algos without coding.
Use Python notebooks to design custom strategies.
Access historical market data for analysis.
Automate trades through broker APIs.
This democratization of technology is reshaping the retail trading landscape, allowing individuals to compete in efficiency with institutional players.
10. The Future of Algorithmic Trading in India
The future of algorithmic trading in India looks highly promising. Several trends are shaping its trajectory:
a. Artificial Intelligence Integration
AI-powered systems will increasingly predict market behavior, making trading smarter and adaptive.
b. Quantum Computing
The potential for near-instantaneous computation could revolutionize complex trading models.
c. Blockchain-Based Settlements
Blockchain could bring greater efficiency and transparency to clearing and settlement processes.
d. Wider Retail Access
As costs decrease and regulations evolve, retail traders will gain greater access to institutional-grade tools.
e. Cross-Market Integration
Algo systems will expand to commodities, currency markets, and international exchanges, creating a unified global trading environment.
f. Regulatory Innovation
SEBI’s proactive approach ensures that the market remains transparent and competitive, promoting sustainable growth.
11. Conclusion
Algorithmic trading represents the future of financial markets in India. What began as a niche practice among institutional investors has now become a mainstream phenomenon, empowering traders with data-driven precision and unmatched efficiency.
With strong regulatory oversight, robust technological infrastructure, and increasing retail adoption, India’s algorithmic trading ecosystem is poised for exponential growth. However, traders must approach automation with responsibility — focusing on robust strategy design, risk management, and compliance.
In essence, algorithmic trading in India symbolizes a perfect blend of technology and finance, paving the way for smarter, faster, and more efficient markets — where innovation meets opportunity.
Part 12 Trading Master ClassMastering the Art of Option Trading
Option trading blends mathematics, psychology, and market logic. It’s not just about predicting direction but understanding probabilities, risk management, and timing. Successful traders treat options as tools for strategic advantage — not gambling tickets.
In essence:
Options = Flexibility + Leverage + Protection.
They empower traders to define risk, hedge intelligently, and profit across market cycles.
But to master them, one must study pricing models, volatility behavior, and trade discipline.
Whether you’re a hedger protecting a portfolio or a speculator chasing momentum, options are the bridge between risk and opportunity — making them one of the most powerful innovations in modern financial markets.

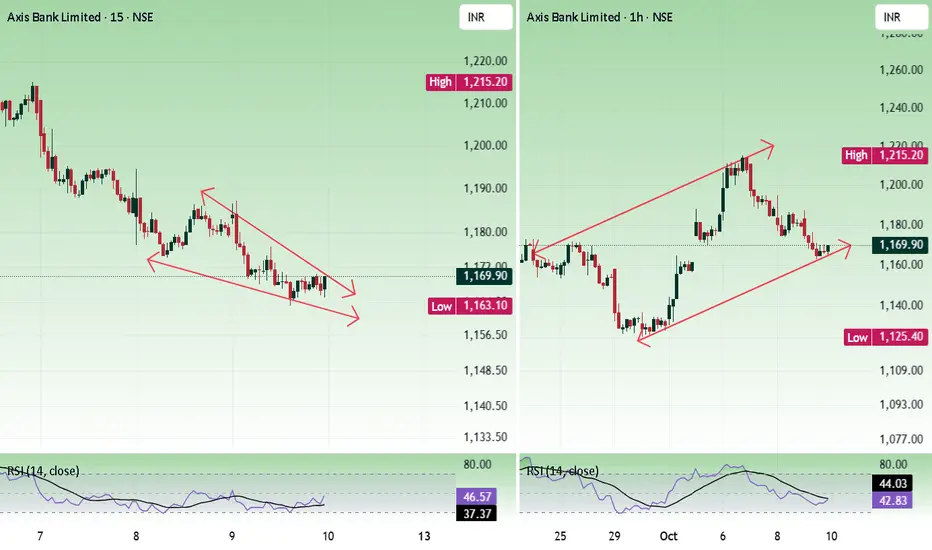
Axis bankPrice faced resistance at the 1200 - 1220 zone and falling. In higher time, the price is moving inside an ascending triangle. In a lower time frame, a falling wedge has formed. Both are bullish patterns. Holding 1160 is important for bulls.
Buying is risky if the price dont have volume strength.
Buy above 1168 with the stop loss of 1161 for the targets 1174, 1182, 1190, and 1198.
Sell below 1156 with the stop loss of 1164 for the targets 1148, 1140, 1132, and 1126.
Always do your analysis before taking any trade.
Bank Nifty Neowave UpdateNSE:BANKNIFTY
Namaskaram Everyone
Welcome to intelligent investor, we provide market insights by synchronising and combining all the price action waves from different time frames and gives you single trend.
Degree Information

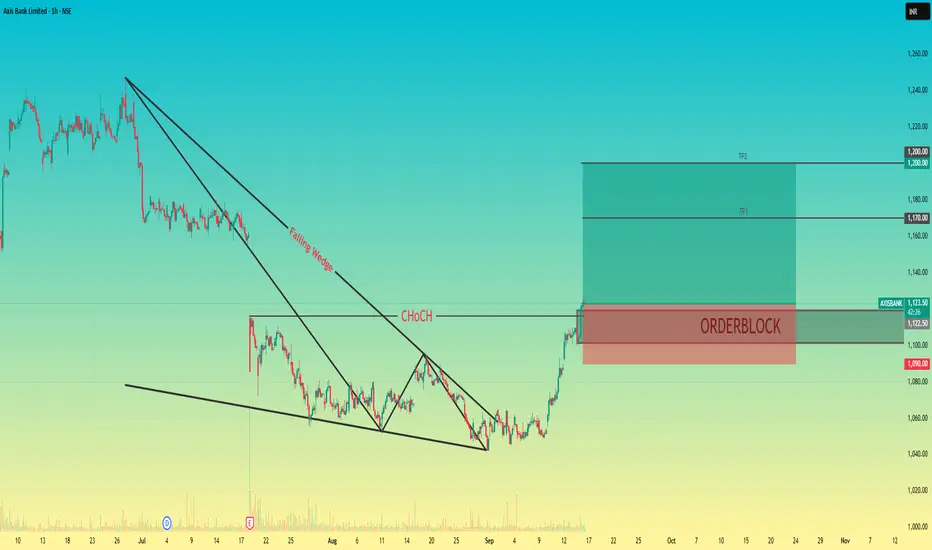
Bullish Reversal on Axis Bank | Falling Wedge + Demand Zone📝 Analysis: Axis Bank (1H Chart)
Pattern: Price formed a Falling Wedge, a bullish reversal pattern.
CHoCH (Change of Character): Market structure shift confirms that bearish momentum has weakened and bulls have taken control.
Order Block: A bullish order block has been identified around ₹1,120 – ₹1,100, which is acting as a demand zone.
Entry: Current price has tapped into the order block zone, offering a potential long opportunity.
Targets:
TP1: ₹1,170
TP2: ₹1,200
Stop Loss: Below ₹1,090 (order block invalidation).
📌 Trade Idea:
Bias: Bullish
Risk-Reward Ratio: Favourable if entries are taken around the order block.
Confirmation: Further bullish candles from this zone strengthen the case for upside continuation.
WEAK AXIS BANK CHART ON 75MINUTE AND DAILYAXIS BANK CURRENTLY TRADING AT 1160 in cash segment and 1168 in Oct futures.
Axis Bank Oct future can be sold at 1168 with SL of 1190 for a target of 1100-1090 in Oct expiry. Also as per Gann pressure dates on 04-Oct (Market Closed) the effect will be seen on 03-Oct or 06-Oct-2025.
Lets hit the target.
📉 THIS CHANNEL IS ONLY FOR EDUCATIONAL PURPOSES.
Disclaimer: I am Not a SEBI registered analyst. I just share my positions to do paper trading and no where its a recommendation! Please do your own analysis before taking any trade.

AXISBANK 1D Time frameTrading close to ₹1,130.
This is slightly below the earlier ₹1,160–₹1,170 zone we discussed, so the range shifts down.
🔼 Upside (Rise Possibility)
Immediate resistance near ₹1,140 – ₹1,145.
If price breaks and sustains above this, it can move to ₹1,155 – ₹1,165.
Strong momentum above ₹1,165 may extend toward ₹1,175.
🔽 Downside (Fall Possibility)
First support is at ₹1,120 – ₹1,115.
If that breaks, price could slip toward ₹1,105 – ₹1,095.
Closing below ₹1,095 would weaken the trend further.
✅ Summary for Today
Above ₹1,140 → rise possible till ₹1,155 – ₹1,165.
Below ₹1,120 → fall possible till ₹1,105 – ₹1,095.
Between ₹1,120 – ₹1,140 → sideways range.

Part 2 Candle Stick Pattern 1. Introduction to Option Trading
In the world of financial markets, traders and investors are constantly looking for ways to maximize returns while managing risks. Beyond the conventional buying and selling of stocks, bonds, or commodities lies the fascinating arena of derivatives. Among derivatives, options stand out as one of the most versatile and widely used financial instruments.
An option is essentially a contract that gives the holder the right, but not the obligation, to buy or sell an underlying asset at a predetermined price before or at a specified expiration date. This flexibility allows traders to hedge risks, speculate on market movements, or design complex strategies to suit different risk appetites.
Option trading is a double-edged sword: it can generate extraordinary profits in a short span but also result in significant losses if misunderstood. Hence, before stepping into this market, it is essential to understand the fundamentals, mechanics, and strategies behind option trading.
2. Basics of Options
To understand option trading, let us first dissect the essential components.
2.1 Call Options
A call option gives the buyer the right, but not the obligation, to buy the underlying asset at a predetermined price (strike price) within a specific period.
If the asset’s price rises above the strike price, the call option holder can buy at a lower price and profit.
If the price falls below the strike, the buyer may let the option expire worthless, losing only the premium paid.
Example: If you buy a call option on Stock A at ₹100 strike and the stock rises to ₹120, you profit by exercising the option or selling it in the market.
2.2 Put Options
A put option gives the buyer the right, but not the obligation, to sell the underlying asset at the strike price before or at expiration.
If the asset price falls below the strike, the put holder benefits.
If it rises above the strike, the option may expire worthless.
Example: If you buy a put option on Stock A at ₹100 and the stock falls to ₹80, you can sell it at ₹100, making a profit.
2.3 Strike Price
The pre-agreed price at which the underlying asset can be bought or sold.
2.4 Premium
The price paid by the option buyer to the seller (writer) for acquiring the option contract. It represents the upfront cost and is influenced by time, volatility, and underlying asset price.
2.5 Expiration Date
Options have a finite life and must be exercised or left to expire on a specific date.
3. Types of Options
Options vary based on style, market, and underlying assets.
American Options – Can be exercised anytime before expiration.
European Options – Can only be exercised on the expiration date.
Equity Options – Based on shares of companies.
Index Options – Based on stock indices like Nifty, S&P 500, etc.
Commodity Options – Based on gold, silver, crude oil, etc.
Currency Options – Based on forex pairs like USD/INR.
4. Participants in Option Trading
Every option trade involves two primary parties:
Option Buyer – Pays the premium, enjoys the right but no obligation.
Option Seller (Writer) – Receives the premium but carries the obligation if the buyer exercises the contract.
The buyer has limited risk (premium paid), but the seller has theoretically unlimited risk and limited profit (premium received).
5. Why Trade Options?
Traders and investors use options for multiple reasons:
Hedging – Protecting existing investments from adverse price moves.
Speculation – Betting on market directions with limited risk.
Income Generation – Writing options to collect premiums.
Leverage – Controlling a large position with a relatively small investment.

Axis Bank Bullish Long Term ActivationKey Points
Trend Type- Long Term
Rally is already started, but still a long way to go up.So buy on retracements.
If you have the stock than hold it for few months and more.
Like and share is appreciated.
Thank You
To understand how our coding works read the below post-
NSE:AXISBANK

Key Trading Terminology Every Pro Should Know1. Market Basics
1.1 Asset Classes
Understanding asset classes is fundamental. These include:
Equities/Stocks: Ownership shares in a company.
Bonds: Debt instruments representing a loan made by an investor to a borrower.
Commodities: Physical goods like gold, oil, and wheat traded on exchanges.
Forex: Currency pairs traded in the global foreign exchange market.
Derivatives: Financial instruments whose value derives from an underlying asset, including options and futures.
1.2 Market Participants
Key players in markets include:
Retail Traders: Individual investors trading with personal capital.
Institutional Traders: Organizations such as mutual funds, hedge funds, and banks.
Market Makers: Entities that provide liquidity by quoting buy and sell prices.
Brokers: Intermediaries facilitating trading for clients.
HFT Firms: High-frequency traders using algorithms for rapid trades.
1.3 Market Orders
Orders are instructions to buy or sell an asset:
Market Order: Executed immediately at the current market price.
Limit Order: Executed only at a specified price or better.
Stop Order: Becomes a market order once a specific price is reached.
Stop-Limit Order: Combines stop and limit orders for precise execution.
2. Trading Styles and Strategies
2.1 Day Trading
Buying and selling within the same trading day to capitalize on intraday price movements.
2.2 Swing Trading
Holding positions for several days to weeks to profit from medium-term price swings.
2.3 Position Trading
Longer-term trades based on trends over weeks or months.
2.4 Scalping
Ultra-short-term trading, often seconds to minutes, targeting small profits.
2.5 Algorithmic Trading
Using automated programs to execute trades based on predefined strategies.
3. Technical Analysis Terminology
3.1 Candlestick Patterns
Visual representations of price movements:
Doji: Indicates market indecision.
Hammer: Potential bullish reversal signal.
Shooting Star: Possible bearish reversal.
3.2 Support and Resistance
Support: Price level where buying pressure prevents further decline.
Resistance: Price level where selling pressure prevents further rise.
3.3 Trend and Trendlines
Uptrend: Series of higher highs and higher lows.
Downtrend: Series of lower highs and lower lows.
Trendline: Straight line connecting significant price points to identify direction.
3.4 Indicators and Oscillators
Moving Averages: Smooth price data to identify trends (SMA, EMA).
RSI (Relative Strength Index): Measures overbought or oversold conditions.
MACD (Moving Average Convergence Divergence): Trend-following momentum indicator.
Bollinger Bands: Volatility-based price envelopes.
4. Fundamental Analysis Terminology
4.1 Key Financial Ratios
P/E Ratio: Price-to-earnings ratio indicating valuation.
P/B Ratio: Price-to-book ratio reflecting company worth relative to book value.
ROE (Return on Equity): Profitability relative to shareholder equity.
Debt-to-Equity Ratio: Financial leverage indicator.
4.2 Earnings and Revenue
EPS (Earnings Per Share): Profit allocated per outstanding share.
Revenue Growth: Increase in sales over time.
Profit Margin: Percentage of revenue converted to profit.
4.3 Macroeconomic Indicators
GDP Growth: Economic expansion rate.
Inflation (CPI/WPI): Changes in price levels.
Interest Rates: Cost of borrowing money.
5. Risk Management Terminology
5.1 Position Sizing
Determining the size of each trade relative to portfolio capital.
5.2 Stop Loss and Take Profit
Stop Loss: Limits losses if the market moves against you.
Take Profit: Automatically closes a trade when a target profit is reached.
5.3 Risk-to-Reward Ratio
Ratio of potential loss to potential gain; crucial for evaluating trade viability.
5.4 Diversification
Spreading investments across multiple assets to reduce risk exposure.
6. Derivatives and Options Terminology
6.1 Futures
Contracts to buy/sell an asset at a predetermined price and date.
6.2 Options
Contracts giving the right but not obligation to buy (call) or sell (put) an asset.
6.3 Greeks
Measure sensitivity to various factors:
Delta: Price change relative to underlying asset.
Gamma: Rate of change of delta.
Theta: Time decay of option value.
Vega: Sensitivity to volatility changes.
6.4 Leverage
Using borrowed funds to amplify trading exposure; increases potential gains and losses.
7. Market Conditions and Events
7.1 Bull and Bear Markets
Bull Market: Rising prices and investor optimism.
Bear Market: Falling prices and investor pessimism.
7.2 Volatility
Degree of price fluctuations; often measured by VIX for equities.
7.3 Liquidity
Ability to buy/sell assets quickly without affecting price significantly.
7.4 Gap
Difference between closing and opening prices across trading sessions.
7.5 Market Sentiment
Overall attitude of investors toward a market or asset.
8. Order Types and Execution Terms
Fill: Execution of an order.
Partial Fill: Only part of the order is executed.
Slippage: Difference between expected price and execution price.
Spread: Difference between bid and ask prices.
Bid/Ask: Highest price buyers are willing to pay vs lowest sellers accept.
9. Advanced Trading Terminology
9.1 Arbitrage
Exploiting price differences between markets to earn risk-free profits.
9.2 Hedging
Using instruments to offset potential losses in another investment.
9.3 Short Selling
Selling borrowed shares anticipating a price decline to buy back at lower prices.
9.4 Margin
Borrowed funds to increase position size.
9.5 Carry Trade
Borrowing at a low interest rate to invest in higher-yielding assets.
9.6 Position vs Exposure
Position: Current holdings in an asset.
Exposure: Potential risk from current positions.
10. Psychological and Behavioral Terms
FOMO (Fear of Missing Out): Emotional bias leading to impulsive trades.
Fear and Greed Index: Measures market sentiment extremes.
Overtrading: Excessive trades driven by emotions rather than strategy.
Confirmation Bias: Seeking information that supports pre-existing views.
Loss Aversion: Tendency to fear losses more than value gains.
11. Key Metrics and Reporting Terms
Volume: Number of shares/contracts traded.
Open Interest: Total outstanding derivative contracts.
Volatility Index (VIX): Market’s expectation of future volatility.
Market Capitalization: Total value of a company’s shares.
Index: Measurement of market performance (e.g., Nifty 50, S&P 500).
12. Global Market Terms
ADR/GDR: Instruments for trading foreign shares in domestic markets.
Forex Pairs: Currency combinations like EUR/USD or USD/JPY.
Emerging Markets: Developing economies with growth potential but higher risk.
Commodities Exchange: Platforms like MCX, NYMEX for commodity trading.
13. Regulatory and Compliance Terms
SEBI/NSE/BSE Regulations: Regulatory frameworks governing trading in India.
FATCA/AML: Compliance rules for taxation and anti-money laundering.
Circuit Breaker: Market mechanism to halt trading during extreme volatility.
14. Conclusion: Why Terminology Matters
Mastering trading terminology is crucial for professional success. Knowledge of terms enhances decision-making, improves risk management, and fosters confidence when interpreting market conditions. Professional traders are not just skilled in execution—they understand the language of the market. From basic orders to complex derivatives, every term is a tool to decode price movements, optimize strategy, and ultimately, achieve consistent profitability.
AXISBANK 1D Time frame📊 Daily Snapshot
Closing Price: ₹1,166.10
Day’s Range: ₹1,153.40 – ₹1,171.80
Previous Close: ₹1,158.80
Change: Up +0.28%
52-Week Range: ₹933.50 – ₹1,281.65
Market Cap: ₹3.59 lakh crore
P/E Ratio: 12.9
Dividend Yield: 1.2%
EPS (TTM): ₹90.00
Beta: 1.1 (moderate volatility)
🔑 Key Technical Levels
Immediate Support: ₹1,153.33
Immediate Resistance: ₹1,153.33
Weekly Outlook: Immediate support at ₹1,109.23; major support at ₹1,082.57; immediate resistance at ₹1,153.33; major resistance at ₹1,170.77.
📈 Analyst Insights
Intrinsic Value: Estimated at ₹1,511.77 based on median valuation models, suggesting the stock is trading below its fair value.
📈 Strategy (1D Timeframe)
1. Bullish Scenario
Entry: Above ₹1,153.33
Stop-Loss: ₹1,109.23
Target: ₹1,170.77 → ₹1,200.00
2. Bearish Scenario
Entry: Below ₹1,109.23
Stop-Loss: ₹1,153.33
Target: ₹1,082.57 → ₹1,050.00
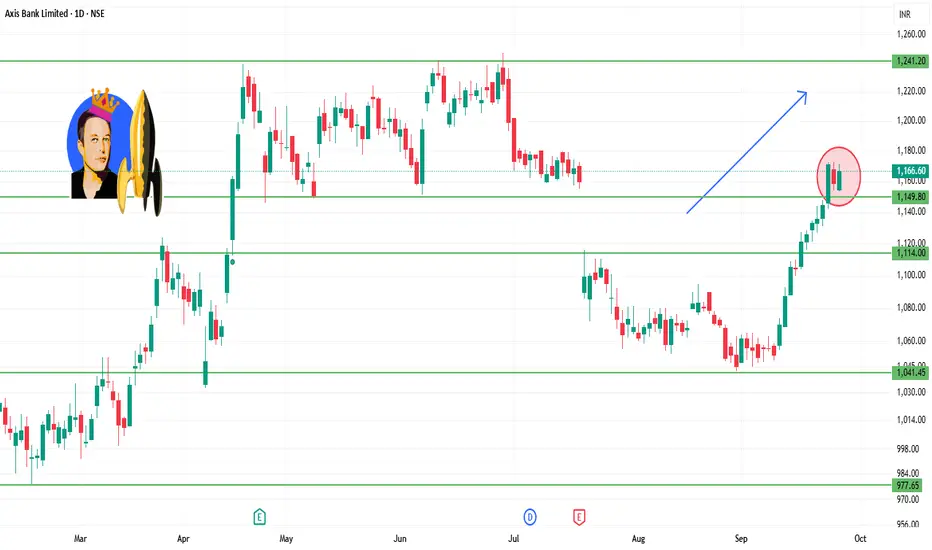
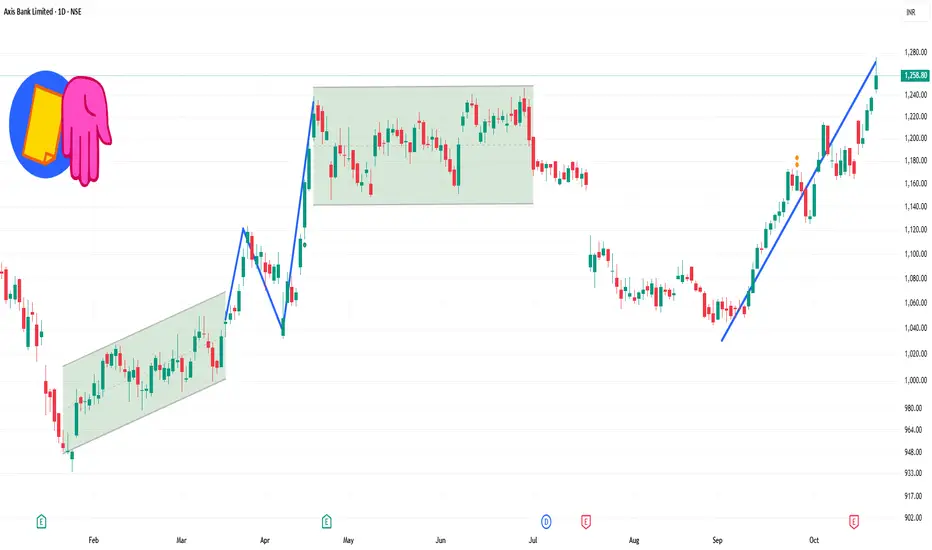
Axis Bank rally faces overbought pressureTopic statement:
Axis Bank has rallied sharply over the past 10 sessions, but signs of short-term exhaustion and resistance suggest a potential pause or pullback.
Key points:
1. The recent price surge has filled the gap created on 18th July 2025, reaching a potential resistance zone
2. MFI is elevated at 86, indicating the stock is highly overbought in the short term
3. Candlesticks have formed a steep 70-degree ascent, reflecting sharp bullish intensity
4. Price has jumped above both the 50 and 200-day EMAs, signaling strong momentum but potential overheating
5. The stock may now consolidate below the 1200 level due to increased selling pressure
6. The long-term bullish channel remains intact, as price bounced off the lower trendline support during its recent move

PCR Trading Strategy1. What is Option Trading?
Option trading is a type of financial trading where instead of directly buying or selling an asset (like stocks, commodities, or currencies), you buy a contract that gives you the right (but not the obligation) to buy or sell that asset at a specific price within a certain period.
Think of it like this:
You pay a small fee (called premium) for the “option” to make a deal in the future.
If the deal becomes profitable, you exercise your option.
If not, you simply let the option expire.
This way, your maximum loss is limited to the premium you paid.
2. Types of Options
There are two main types of options:
Call Option – Right to buy an asset at a fixed price.
Example: You buy a call option on Reliance at ₹2,500. If the stock goes to ₹2,700, you can still buy at ₹2,500, making profit.
Put Option – Right to sell an asset at a fixed price.
Example: You buy a put option on Infosys at ₹1,500. If the stock falls to ₹1,300, you can still sell at ₹1,500, protecting yourself.
3. Key Terms in Option Trading
Strike Price – The fixed price at which you can buy/sell the asset.
Premium – The cost of buying the option contract.
Expiry Date – The last day when the option can be exercised.
In the Money (ITM) – When exercising the option is profitable.
Out of the Money (OTM) – When exercising gives no profit.
Lot Size – Options are traded in lots, not single shares. For example, 1 Nifty option lot = 50 units.
4. Why Do People Trade Options?
Hedging (Risk Protection): Investors use options to protect their portfolio against sudden price moves.
Speculation (Profit Seeking): Traders use options to bet on market direction with small capital.
Income Generation: Selling options can generate steady income, though with higher risk.
5. Example for Simplicity
Suppose you think Nifty (index) will rise from 20,000 to 20,200 in one week.
You buy a Call Option with strike price 20,000 at a premium of ₹100.
If Nifty goes to 20,200, your profit = (200 × lot size) – (100 × lot size).
If Nifty stays below 20,000, you lose only the premium.
6. Advantages of Option Trading
✔ Limited risk (for buyers).
✔ Requires less money compared to buying shares.
✔ Flexible – you can profit in rising, falling, or even sideways markets.
7. Risks of Option Trading
❌ Sellers of options face unlimited risk.
❌ Time decay – options lose value as expiry nears.
❌ Requires knowledge of volatility, pricing, and strategies.
8. Strategies in Option Trading
Some popular strategies include:
Covered Call – Selling call against stocks you own.
Protective Put – Buying a put to protect your portfolio.
Straddle & Strangle – Betting on high volatility.
Iron Condor – Earning from sideways markets.
