Part 1 Ride The Big Moves 1. Introduction
Option trading is one of the most exciting parts of the stock market. It allows traders and investors to speculate, hedge risk, and generate income in ways that simple stock buying and selling cannot. But because options involve contracts with specific rights and obligations, they can seem complicated at first glance.
In this explanation, we’ll go step by step — covering what options are, how they work, the different types, common strategies, risks, and benefits.
2. What Are Options?
An option is a financial contract that gives the buyer the right, but not the obligation, to buy or sell an asset at a pre-decided price within a fixed time frame.
The asset could be a stock, index, commodity, or currency.
The price is called the strike price.
The time frame is the contract’s expiry date.
Think of an option like a reservation. For example, if you pay a small deposit to lock in the price of a phone that you might buy next month, you have an “option.” If the phone price goes up, you’re happy because you can still buy it at the old locked price. If the price goes down, you can choose not to buy — but you lose the deposit.
That’s exactly how options work in financial markets.
3. Types of Options
There are two main types:
Call Option – This gives the holder the right to buy the asset at the strike price.
Traders buy calls if they expect prices to go up.
Put Option – This gives the holder the right to sell the asset at the strike price.
Traders buy puts if they expect prices to go down.
Example:
Stock ABC is trading at ₹100.
A call option with strike price ₹105 gives you the right to buy at ₹105 before expiry.
If the stock rises to ₹120, your call becomes valuable.
If it stays below ₹105, the option may expire worthless.
4. Key Terms in Options Trading
Before going deeper, let’s understand the basic terminology:
Premium: The price paid by the option buyer to the seller.
Strike Price: The pre-decided price at which the asset can be bought/sold.
Expiry Date: The last day the option is valid.
In the Money (ITM): When exercising the option would lead to profit.
Out of the Money (OTM): When exercising would not make sense.
At the Money (ATM): When the stock price equals the strike price.
Trade ideas

Market Rotation and Its Types1. Introduction
Market rotation is a core concept in financial markets that refers to the movement of capital from one sector, asset class, or investment style to another. It is a natural outcome of the ever-changing economic, political, and financial environment. By understanding market rotations, investors and traders can anticipate trends, optimize portfolio performance, and manage risks effectively.
Market rotations are often influenced by macroeconomic conditions, monetary policy, investor sentiment, interest rate cycles, inflation trends, and geopolitical developments. They reflect the underlying shifts in investor risk appetite and the changing opportunities across different segments of the market.
Importance of Market Rotation
Enhances Investment Returns: By investing in sectors or styles that are in favor, investors can capitalize on trends before they peak.
Reduces Risk: Market rotation helps avoid sectors or assets that may underperform during certain economic phases.
Portfolio Optimization: Active investors and fund managers use rotation strategies to balance growth and defensive assets.
Economic Insight: Observing rotations provides insight into where the economy is headed, as different sectors react differently to economic cycles.
2. The Concept of Market Rotation
Market rotation can be understood as a strategic reallocation of capital across different market segments. Investors move their money based on perceived risk, expected returns, and economic cycles. These rotations are cyclical and often predictable to some extent, making them an essential tool for traders and portfolio managers.
Rotations can happen:
Between sectors (e.g., technology to energy)
Between investment styles (e.g., growth to value)
Across regions (e.g., emerging markets to developed markets)
Between asset classes (e.g., stocks to bonds or commodities)
Within market capitalizations (e.g., large-cap to small-cap)
Characteristics of Market Rotation
Cyclical: Rotations often follow the economic cycle: expansion, peak, contraction, and recovery.
Predictable to Some Extent: Historical data and economic indicators can provide clues.
Influenced by External Factors: Geopolitical events, monetary policy changes, inflation, and market sentiment play key roles.
Sector-Specific: Not all sectors respond similarly to economic changes; some outperform while others lag.
3. Types of Market Rotation
Market rotations can be broadly classified into several types. Understanding these types helps investors position themselves strategically in different market conditions.
3.1 Sector Rotation
Sector rotation occurs when capital shifts from one industry sector to another based on economic conditions or market cycles. Different sectors perform differently during different stages of the business cycle.
Economic Cycle and Sector Performance
Expansion Stage: Economic growth is strong, consumer demand is high.
Best Performing Sectors: Consumer discretionary, industrials, technology.
Why: Companies expand, invest, and consumer spending rises.
Peak Stage: Growth reaches its highest point, inflation may rise.
Best Performing Sectors: Energy, materials, financials.
Why: Rising interest rates favor financials; inflation benefits commodity-linked sectors.
Contraction Stage: Economic growth slows or falls, unemployment rises.
Best Performing Sectors: Utilities, consumer staples, healthcare.
Why: These sectors provide essential goods and services, acting as defensive investments.
Recovery Stage: Economy begins to grow after a downturn.
Best Performing Sectors: Industrials, technology, cyclicals.
Why: Increased capital expenditure and demand for goods and services spur growth.
Example of Sector Rotation:
During the 2008-2009 financial crisis, capital moved from financials and cyclicals to defensive sectors like utilities and consumer staples. Post-crisis, recovery saw a rotation back to technology, industrials, and consumer discretionary sectors.
3.2 Style Rotation
Style rotation refers to the movement of capital between different investment styles, most commonly growth and value investing.
Growth vs. Value
Growth Stocks: Companies with high expected earnings growth, often tech or emerging sectors.
Value Stocks: Companies trading at lower valuations relative to earnings, assets, or dividends.
Drivers of Style Rotation
Interest Rate Changes: Rising interest rates generally favor value over growth stocks because growth stocks have high future earnings discounted more heavily.
Economic Conditions: Economic recovery may favor growth stocks; recession may favor value stocks with stable earnings.
Investor Sentiment: Risk-on sentiment favors growth; risk-off sentiment favors value.
Example:
In 2022, inflation and interest rate hikes triggered a style rotation from growth tech stocks to value sectors like energy, financials, and industrials.
3.3 Geographic Rotation
Geographic rotation involves the movement of capital between countries or regions. Investors shift funds based on macroeconomic conditions, currency strength, and geopolitical stability.
Key Considerations
Developed vs. Emerging Markets: During risk-on periods, capital often flows into emerging markets for higher returns. In risk-off periods, funds move to safer developed markets.
Currency Movements: Strong domestic currencies can attract foreign investment; weak currencies may discourage inflows.
Political and Economic Stability: Investors prefer regions with stable governance and economic policies.
Example:
During periods of global uncertainty, investors may rotate capital from emerging markets like Brazil or India to safer markets like the US or Germany.
3.4 Asset Class Rotation
Asset class rotation is the shifting of capital between equities, bonds, commodities, and cash equivalents.
Drivers of Asset Rotation
Interest Rate Changes: Rising rates make bonds less attractive and equities more attractive in certain sectors like financials.
Inflation: Commodities often outperform during high inflation.
Risk Appetite: During uncertainty, investors rotate from equities to bonds or gold as safe havens.
Example:
In 2020, during the COVID-19 crisis, investors rotated heavily into bonds and gold, while equities suffered. As markets recovered, capital rotated back into equities, particularly tech and healthcare.
3.5 Market Capitalization Rotation
Market capitalization rotation refers to capital moving between large-cap, mid-cap, and small-cap stocks based on risk appetite and economic conditions.
Characteristics
Small-Cap Stocks: Higher growth potential but higher risk; perform well during economic expansion.
Mid-Cap Stocks: Balanced risk and growth; often outperform during early recovery.
Large-Cap Stocks: Stable and defensive; preferred during market uncertainty or downturns.
Example:
During the 2020 recovery, small-cap and mid-cap indices in India and the US outperformed large-cap indices as investors sought higher growth potential.
4. Drivers of Market Rotations
Market rotations are driven by several macroeconomic, financial, and behavioral factors:
Economic Cycles: Each stage of the business cycle favors different sectors or investment styles.
Interest Rates: Central bank policies affect discount rates and equity valuations.
Inflation Trends: Inflation favors commodities and value stocks, while low inflation favors growth stocks.
Monetary and Fiscal Policy: Quantitative easing, stimulus packages, or tightening measures shift capital allocation.
Geopolitical Events: Wars, sanctions, and political instability trigger risk-on/risk-off rotations.
Market Sentiment and Psychology: Investor optimism or fear often leads to defensive or aggressive rotations.
5. Indicators to Track Market Rotations
Sector Performance Charts: Monitor relative strength of sectors against indices.
ETF Fund Flows: Money inflows/outflows indicate where capital is rotating.
Interest Rate Spreads and Yield Curves: Signal upcoming rotation between growth and value.
Commodities and Currency Movements: Rising commodity prices may trigger rotation into energy and materials sectors.
Market Breadth Indicators: Identify which sectors or asset classes are leading or lagging.
6. Popular Rotation Patterns
Cyclical → Defensive: Seen during economic slowdowns; investors move to utilities, consumer staples, healthcare.
Growth → Value: Triggered by rising interest rates or market uncertainty.
Large-Cap → Small/Mid-Cap: Risk-on environments favor smaller, high-growth companies.
Equities → Bonds/Gold: Risk-off periods push investors into safer assets.
Commodity-Led Rotation: Inflationary trends favor metals, energy, and materials.
7. Tools and Strategies for Tracking Rotations
Relative Strength Analysis: Compare sector ETFs or indices to identify outperformers.
ETF Investing: Easy way to rotate capital across sectors without picking individual stocks.
Quantitative and AI Models: Predict sector rotation using economic indicators.
Momentum and Trend Following: Rotate into sectors with strong price momentum.
Fund Flow Analysis: Monitor institutional and retail investor activity.
8. Historical Examples of Market Rotations
2008-2009 Financial Crisis: Defensive sectors like utilities and staples outperformed; cyclicals and financials lagged.
2020 COVID-19 Crisis: Rotation from equities to bonds and gold. Post-crisis recovery saw rotation back into tech, healthcare, and consumer discretionary.
2022 Inflation and Rate Hikes: Growth stocks underperformed, value sectors and commodities led the market.
9. Advanced Topics in Market Rotation
Cross-Asset Rotations: Understanding correlations between stocks, bonds, commodities, and currencies.
Intermarket Analysis: Using bond yields, equity indices, and commodity prices to anticipate rotation.
Quantitative Models and AI Predictions: Using data-driven methods to predict rotation trends.
Behavioral Finance Insights: How fear, greed, and sentiment drive rotations.
Global Macro Rotations: Monitoring central bank policies, geopolitical events, and trade developments.
10. Conclusion
Market rotation is an essential concept in trading and investing. By understanding its types, drivers, and patterns, investors can make informed decisions, optimize portfolios, and capitalize on trends.
Sector Rotation: Aligns investments with economic cycles.
Style Rotation: Adjusts between growth and value stocks.
Geographic Rotation: Shifts capital based on regional opportunities and risks.
Asset Class Rotation: Moves funds across stocks, bonds, commodities, and cash.
Market Capitalization Rotation: Optimizes risk-reward by moving across large, mid, and small-cap stocks.
Incorporating market rotation strategies into investment planning can significantly enhance returns while managing risk, making it a vital tool for traders, fund managers, and individual investors alike.

Divergence Secrets1. Understanding Options: The Foundation
Options are derivative instruments that derive their value from an underlying asset, such as stocks, indices, commodities, or currencies. They grant the buyer the right—but not the obligation—to buy or sell the underlying asset at a predetermined price within a specified period. There are two primary types of options:
Call Option: Provides the right to buy the underlying asset at a specified price (strike price) before or at expiration.
Put Option: Provides the right to sell the underlying asset at a specified price before or at expiration.
Key Terms:
Strike Price: The price at which the underlying asset can be bought or sold.
Expiration Date: The date on which the option contract expires.
Premium: The cost paid by the buyer to acquire the option.
In-the-Money (ITM): When exercising the option is profitable.
Out-of-the-Money (OTM): When exercising the option is not profitable.
Options provide leverage, enabling traders to control large positions with a relatively small capital outlay, creating unique opportunities for profit in both bullish and bearish markets.
2. Market Opportunities in Options Trading
Options trading opportunities are vast, ranging from directional plays to hedging strategies. The unique characteristics of options allow market participants to exploit price volatility, market inefficiencies, and changing investor sentiment.
2.1. Directional Opportunities
Traders can use options to profit from price movements in underlying assets:
Bullish Outlook: Buying call options allows traders to benefit from rising stock prices with limited risk.
Bearish Outlook: Buying put options provides an opportunity to profit from falling prices without short-selling.
Example: If a stock trading at ₹1,500 is expected to rise to ₹1,650 in two months, a trader could buy a call option with a strike price of ₹1,520. The profit potential is theoretically unlimited, while the maximum loss is limited to the premium paid.
2.2. Hedging Opportunities
Options provide risk mitigation for portfolios, protecting against adverse price movements:
Protective Puts: Investors holding stocks can buy put options to hedge against potential declines.
Covered Calls: Investors owning shares can sell call options to generate income, reducing portfolio volatility.
Example: An investor holding 100 shares of a stock priced at ₹2,000 may buy a put option at a ₹1,950 strike price. If the stock falls to ₹1,800, losses in the stock are offset by gains in the put option.
2.3. Income Generation
Options can be used to generate consistent income through premium collection:
Cash-Secured Puts: Selling put options on stocks an investor wants to acquire can generate premium income.
Covered Call Writing: Selling call options on held stock can earn income while potentially selling the stock at a target price.
2.4. Volatility-Based Opportunities
Options prices are highly sensitive to implied volatility, creating opportunities even when the market direction is uncertain:
Long Straddles: Buying both call and put options at the same strike price allows traders to profit from significant price swings, irrespective of direction.
Long Strangles: Similar to straddles but with different strike prices, strangles are cost-effective strategies for volatile markets.

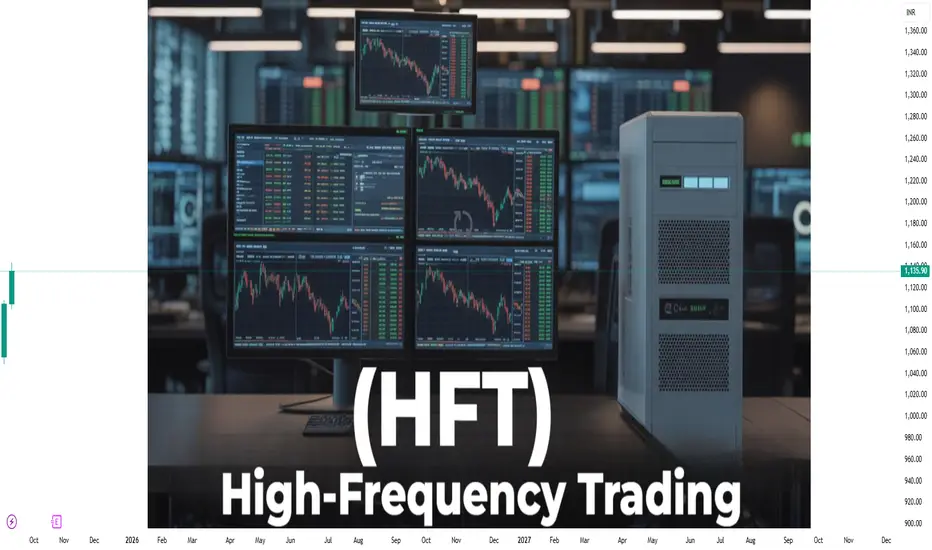
High-Frequency Trading (HFT)1. The Evolution of Trading Technology
1.1 From Manual to Electronic Trading
Before HFT, financial markets relied primarily on human traders, floor brokers, and telephonic transactions. Orders were manually placed, reviewed, and executed—a process that was time-consuming and prone to errors.
The 1980s and 1990s witnessed a revolution in trading technology with the emergence of electronic trading platforms. Nasdaq became one of the first fully electronic markets, offering automated order execution, real-time price quotes, and faster transaction speeds. This shift laid the groundwork for algorithmic trading and, eventually, HFT.
1.2 Algorithmic Trading
Algorithmic trading refers to using pre-programmed instructions to execute trades based on market data. Algorithms can react to price movements, volumes, and news faster than any human. HFT is essentially an extreme form of algorithmic trading where execution speed is the primary advantage.
2. Core Characteristics of High-Frequency Trading
HFT differs from conventional trading in several key aspects:
2.1 Ultra-Low Latency
Latency is the time delay between market data reception and order execution. HFT firms invest heavily in technology to reduce latency to microseconds. They co-locate their servers near exchange data centers to gain nanoseconds in execution speed.
2.2 Massive Order Volumes
HFT strategies often involve placing thousands to millions of orders daily. Most orders are canceled within fractions of a second, a practice called “order-to-trade ratio management.”
2.3 Short Holding Periods
HFT trades rarely hold positions longer than a few seconds. Some strategies may close trades in milliseconds. Profits rely on exploiting tiny price discrepancies that exist only briefly.
2.4 Reliance on Market Data
HFT depends on real-time market data, including order books, trade histories, and economic news. Algorithms analyze this data continuously to identify patterns and opportunities invisible to human traders.
3. High-Frequency Trading Strategies
HFT strategies can be broadly categorized based on their objectives and techniques.
3.1 Market Making
Market-making HFT firms provide liquidity by continuously quoting bid and ask prices. They profit from the bid-ask spread, earning small but frequent gains on each trade. Their activity reduces price volatility and enhances market efficiency.
3.2 Statistical Arbitrage
Statistical arbitrage involves exploiting price inefficiencies across related assets. For instance, HFT algorithms may detect mispricings between futures and underlying stocks, executing trades that profit when the discrepancy corrects.
3.3 Event-Driven Strategies
Event-driven HFT reacts to news events, economic data releases, or corporate announcements. Algorithms scan news feeds and social media in real time, executing trades within microseconds of market-moving information.
3.4 Momentum Ignition
Some HFT strategies attempt to trigger rapid price movements by placing a series of orders designed to provoke reactions from other traders. This technique is controversial and often falls under regulatory scrutiny.
3.5 Latency Arbitrage
Latency arbitrage exploits time differences in price reporting between different exchanges. Firms can buy an asset on one exchange and sell it milliseconds later on another where the price has not yet adjusted.
4. Technological Infrastructure
HFT requires cutting-edge technology. Firms invest millions in the following areas:
4.1 Hardware
Ultra-Fast Servers: HFT firms use servers with high processing power to minimize computation time.
FPGAs (Field-Programmable Gate Arrays): Custom hardware accelerates data processing, reducing latency.
High-Speed Networking: Direct fiber-optic lines and microwave communication are employed to reduce transmission time between exchanges.
4.2 Software
Low-Latency Algorithms: Optimized to execute in microseconds.
Real-Time Analytics: Processes incoming market data instantly to make trade decisions.
Risk Management Systems: Monitor exposures, automatically adjusting or canceling orders to prevent significant losses.
4.3 Co-Location
Many exchanges offer co-location services, allowing HFT servers to be physically close to exchange servers. Proximity can reduce latency by fractions of a millisecond, which is crucial in a speed-sensitive environment.
5. Market Impact
5.1 Liquidity Enhancement
HFT provides liquidity by constantly placing buy and sell orders, reducing spreads and improving market depth. This allows other market participants to execute trades more efficiently.
5.2 Price Discovery
HFT accelerates the incorporation of new information into asset prices. By rapidly reacting to market signals, HFT helps markets reflect underlying values more accurately.
5.3 Volatility Concerns
Critics argue that HFT can exacerbate market volatility. During periods of market stress, algorithms may simultaneously withdraw liquidity, leading to flash crashes or sudden price swings.
5.4 Unequal Playing Field
HFT firms enjoy advantages unavailable to retail traders, including co-location, proprietary data feeds, and ultra-fast hardware. Critics contend that this undermines market fairness.
6. Regulation of High-Frequency Trading
Global regulators have increasingly focused on HFT due to its complexity and potential risks. Key regulatory measures include:
6.1 Market Surveillance
Exchanges and regulators monitor HFT activity to detect manipulative practices, such as quote stuffing (placing excessive orders to slow down competitors) and spoofing (placing orders with no intent to execute).
6.2 Minimum Resting Times
Some markets have introduced minimum order resting times, requiring orders to remain on the book for a short period to reduce excessive cancellations.
6.3 Trade Reporting and Transparency
Regulators require HFT firms to provide detailed trade reporting, ensuring oversight and traceability of rapid trading activity.
7. Advantages and Criticisms
7.1 Advantages
Increased Liquidity: HFT enhances market efficiency by providing continuous buy and sell orders.
Lower Spreads: Narrow bid-ask spreads benefit all market participants.
Efficient Price Discovery: Speeds up reflection of information in market prices.
Innovation in Trading Technology: Drives advancements in software and hardware.
7.2 Criticisms
Market Manipulation Risk: Certain strategies can manipulate prices temporarily.
Systemic Risk: Highly automated systems can exacerbate crashes.
Unequal Access: Retail traders cannot compete on speed or technology.
Short-Term Focus: HFT focuses on minuscule, fleeting opportunities rather than long-term value creation.
8. Case Studies and Notable Events
8.1 The Flash Crash of 2010
On May 6, 2010, U.S. stock markets experienced a sudden, dramatic drop, with the Dow Jones falling nearly 1,000 points in minutes. HFT algorithms amplified the crash by rapidly selling and withdrawing liquidity, illustrating the risks of ultra-fast trading.
8.2 HFT in Global Markets
HFT is not limited to U.S. exchanges. European and Asian markets have also witnessed significant HFT activity, with local regulations adapting to manage associated risks. In some regions, HFT has contributed positively to liquidity and price efficiency, demonstrating the dual nature of its impact.
9. The Future of High-Frequency Trading
9.1 Technological Advancements
HFT will continue to evolve with innovations such as quantum computing, AI-driven predictive analytics, and next-generation networking technologies. These may further reduce latency and enhance decision-making.
9.2 Regulation and Ethical Considerations
Regulators will likely impose stricter rules to prevent systemic risk and maintain fairness. The industry may need to balance speed-driven profits with broader market stability.
9.3 Integration with Other Trading Forms
HFT may increasingly interact with other forms of algorithmic trading, including options, futures, and cryptocurrency markets, creating complex, interconnected trading ecosystems.
Conclusion
High-Frequency Trading represents a pinnacle of technological integration into financial markets. It has reshaped the landscape, providing liquidity, speeding up price discovery, and introducing new risks. While it benefits markets in terms of efficiency and narrower spreads, it also raises concerns about fairness, volatility, and systemic risk. Understanding HFT requires recognizing its dual nature: a tool of innovation and speed that must be managed carefully to prevent unintended consequences.
As global markets become more interconnected, HFT will remain a critical area of study for traders, regulators, and technologists alike. Its future will be defined by the interplay between technological innovation, market dynamics, and regulatory oversight.
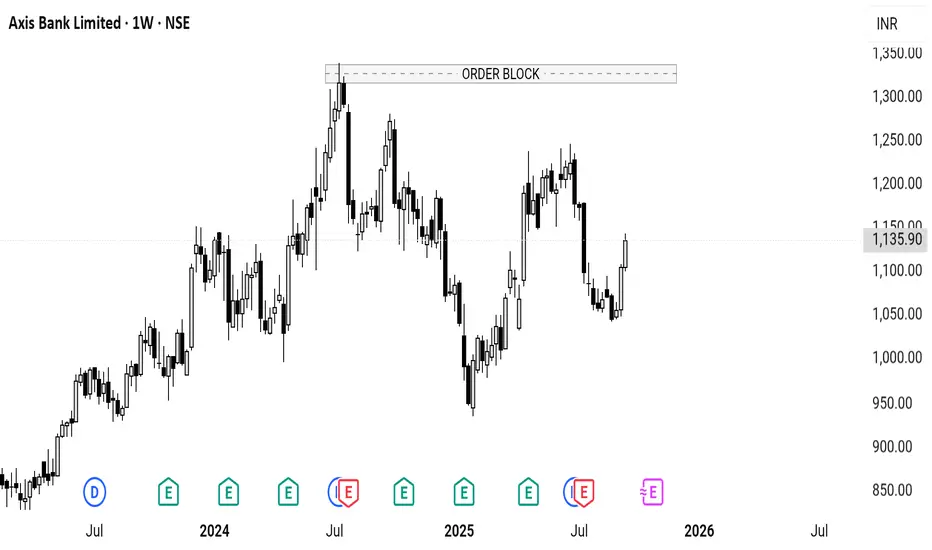
Axis has created a resistance at the top.As it has a pending correction & a good resistance at the top, it might see a fall till 600
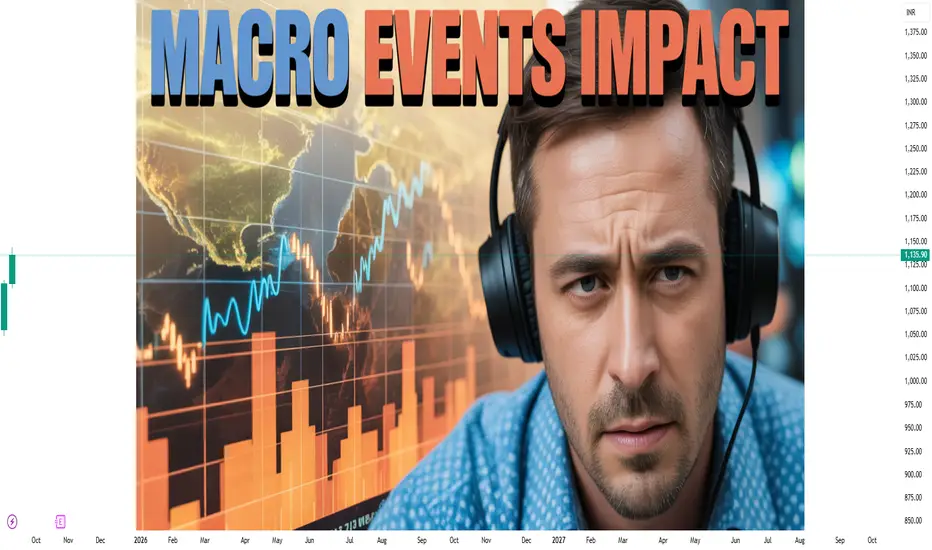
Micro Events, Macro Impact: Trading the Small SignalsUnderstanding Micro Events
At its core, a micro event is a seemingly minor incident or signal that, while small in isolation, carries the potential to trigger broader market reactions. Examples include:
Minor corporate announcements: Small changes in guidance, product launches, or leadership shifts.
Order flow imbalances: Subtle surges in buy or sell orders within a short timeframe.
News snippets: A brief comment by an industry expert or a regulator’s minor statement.
Technical micro-signals: Price patterns like a micro double bottom, micro breakouts, or brief volume spikes.
These events might appear insignificant to the casual observer. However, when a skilled trader recognizes the context and potential ripple effects, these micro signals become invaluable for crafting trading strategies.
The Science Behind Micro Events
The efficacy of micro-event trading is grounded in market psychology and structure. Financial markets are a network of participants—retail traders, institutional investors, hedge funds, and algorithmic traders—reacting in real-time to information. Small events often act as catalysts, triggering larger market reactions because they interact with existing positions, expectations, or technical structures.
For example, consider a minor supply chain disruption reported by a mid-tier company. While the headline might not grab media attention, it could foreshadow a ripple in the entire sector if institutional traders recognize the potential impact. Markets, in essence, amplify micro events because participants react collectively, creating macro-level price movements.
Categories of Micro Events
Micro events can be classified into several categories:
Corporate Micro Events:
Insider trades, subtle guidance changes, or small earnings beats/misses.
Example: A tech company slightly upgrades its quarterly guidance due to increased orders. This could lead to sector-wide optimism and a short-term surge in related stocks.
Technical Micro Signals:
Minute chart patterns, support/resistance tests, or tiny volume surges.
Example: A stock repeatedly bouncing at a micro support level could indicate accumulation, foreshadowing a breakout.
Market Microstructure Events:
Order book imbalances, unusual options activity, or flash trades.
Example: A sudden spike in call option volume may signal bullish sentiment before broader market recognition.
News Micro Events:
Subtle statements from regulators, small policy shifts, or low-profile analyst upgrades/downgrades.
Example: A brief comment on interest rate policy may cause immediate, small-scale currency movements, which can be leveraged by nimble forex traders.
Why Micro Events Matter
Most traders chase macro events, such as inflation data, central bank decisions, or corporate earnings. These events are widely covered, highly anticipated, and often priced in by the time they occur. Micro events, on the other hand, offer early insights and first-mover advantage:
Preemptive Trading Opportunities: Spotting a micro signal allows traders to position themselves before larger market participants react.
Lower Competition: Fewer traders monitor these small signals, reducing crowded trades and potential slippage.
Precision Entry and Exit: Micro events often provide tighter risk/reward ratios since they generate localized price movements.
In short, trading micro events is about turning subtle observations into actionable strategies, capturing profits that others might miss.
Identifying Micro Events
Identifying micro events requires a combination of market awareness, technical expertise, and psychological insight. Here are the key steps:
1. Monitor Market Flow
Pay attention to order books, trade volumes, and market depth. Unusual spikes in activity, even if minor, can hint at upcoming price shifts. Algorithmic and institutional traders often act on these micro signals, creating patterns that observant traders can exploit.
2. Track Minor News and Announcements
Not all news is created equal. Small updates—like a management reshuffle, patent approval, or minor regulation—may seem inconsequential. However, if they alter future growth expectations or competitive dynamics, they can trigger a ripple effect.
3. Analyze Technical Micro Patterns
Micro-level chart patterns—visible on 1-minute, 5-minute, or intraday charts—can be critical. Examples include:
Micro double tops/bottoms
Small-scale trendline breaks
Tiny consolidation zones before breakout
These patterns often precede larger movements and can guide entry and exit points.
4. Observe Sentiment Shifts
Even minor changes in sentiment can create micro events. Social media chatter, analyst micro-reports, or investor forum discussions can signal underlying momentum. Traders with real-time sentiment analysis tools often capitalize on these subtle shifts.
Trading Strategies Based on Micro Events
Once identified, micro events can be leveraged through specialized trading strategies. Here’s a breakdown:
1. Scalping Micro-Moves
Scalping involves capturing tiny price movements within a short time frame, often minutes. Micro events, such as sudden volume surges or small technical breakouts, are ideal triggers.
Example: A sudden uptick in buying activity for a stock forming a micro support level. A scalper enters a long position, targeting a 0.5–1% price gain.
Key considerations: Tight stop losses, fast execution, and real-time monitoring are essential. Scalpers thrive on speed and precision.
2. Event-Driven Swing Trading
Swing traders can use micro events to predict short-term price swings, usually lasting days to weeks.
Example: A minor product launch by a pharmaceutical company sparks optimism in its peers. Swing traders may buy the stock in anticipation of broader sector gains.
Key considerations: Context matters. Not all micro events generate follow-through; understanding the sector and broader market sentiment is crucial.
3. Micro Arbitrage
Micro events can create temporary pricing inefficiencies between related instruments, such as stocks and options, ETFs, or derivatives.
Example: A minor earnings beat leads to an immediate but small undervaluation in options pricing. Traders can exploit the difference before markets adjust.
Key considerations: Requires quick execution and precise calculation of risk/reward ratios.
4. Sentiment-Based Micro Trading
Using micro events to gauge shifts in sentiment can be powerful. Traders track subtle cues, such as minor regulatory comments or analyst chatter, to anticipate short-term moves.
Example: A small downgrade in an energy stock triggers fear in the sector. Traders short the stock, benefiting from the immediate reaction before the broader market recalibrates.
Key considerations: Accurate sentiment measurement tools and a disciplined approach to avoid overreacting to noise.
Risk Management in Micro Event Trading
While micro events offer opportunities, they also carry risks:
False Signals: Not every minor signal leads to a significant movement. Traders must filter noise.
High Volatility: Small events can cause sharp, unpredictable spikes, especially in low-liquidity instruments.
Execution Risk: Timing is critical. Delayed execution can turn potential profits into losses.
Best Practices:
Use tight stop-losses and position sizing appropriate for the volatility.
Combine micro signals with broader trend confirmation.
Maintain discipline; not all signals are worth trading.
Keep track of historical micro event outcomes to identify patterns and improve predictive accuracy.
Case Studies: Micro Events Driving Macro Impact
Case Study 1: Technical Micro Breakout
A mid-cap technology stock repeatedly tests a micro resistance level of ₹1,500. A surge in intraday volume on a minor news update triggers a breakout. Traders who recognized the micro event early capture a 5–7% gain within a week.
Insight: Monitoring intraday technical signals alongside minor news can identify profitable trades before mainstream media reacts.
Case Study 2: Minor Corporate Announcement
A leading pharmaceutical company reports a slight improvement in production efficiency. Although the news is minor, traders anticipate better margins and sector optimism. The stock gains 10% over the next month.
Insight: Even minor guidance updates can drive sector-wide movement if they signal broader implications.
Case Study 3: Market Microstructure Imbalance
An unusual surge in call options for a retail stock indicates bullish sentiment. Within hours, the stock rises 3%, suggesting institutional traders were positioning for a minor positive catalyst.
Insight: Tracking options flow and order book imbalances can reveal hidden opportunities invisible to traditional analysis.
Tools for Micro Event Trading
Successful micro event trading relies on technology and analysis tools:
Real-Time News Aggregators: Capture minor updates instantly.
Order Book & Market Depth Tools: Identify subtle shifts in supply-demand dynamics.
Sentiment Analysis Platforms: Track investor mood from social media, news, and forums.
Intraday Technical Indicators: Use 1-minute to 15-minute charts to spot micro patterns.
Algorithmic Alerts: Custom algorithms can detect unusual volume spikes or price anomalies.
Psychological Edge
Trading micro events requires mental agility. Unlike macro trading, where moves unfold over weeks or months, micro-event trading demands fast decision-making. Traders must cultivate:
Observation Skills: Ability to spot tiny shifts before others.
Patience: Avoid overtrading on insignificant events.
Discipline: Stick to pre-defined entry/exit rules.
Adaptability: Recognize when a signal fails and exit gracefully.
Integrating Micro Event Analysis with Macro Strategy
While micro events are powerful, they are most effective when combined with macro-level awareness. For instance:
Micro events provide early warning signals for larger trends.
Macro events validate micro signals, reducing false positives.
Micro event insights allow precise entries and exits within a macro trading framework.
By combining both levels of analysis, traders can optimize risk-reward, improve timing, and enhance overall performance.
Conclusion: The Power of the Small
The mantra “Micro Events, Macro Impact” embodies a transformative approach to trading. In a market dominated by noise, the ability to discern subtle signals offers first-mover advantage, tighter risk management, and superior returns. Micro events may be small, but their impact, when understood and acted upon correctly, is magnified across the market landscape.
Successful micro-event trading is not about guessing—it’s about structured observation, disciplined execution, and strategic integration. Traders who master the art of spotting and acting on these small signals gain a competitive edge, capturing profits that many larger, slower participants overlook.
In the end, financial markets reward those who see what others don’t, act where others hesitate, and transform small sparks into macro gains. Micro events are not just minor incidents—they are the hidden engines driving major market movements.
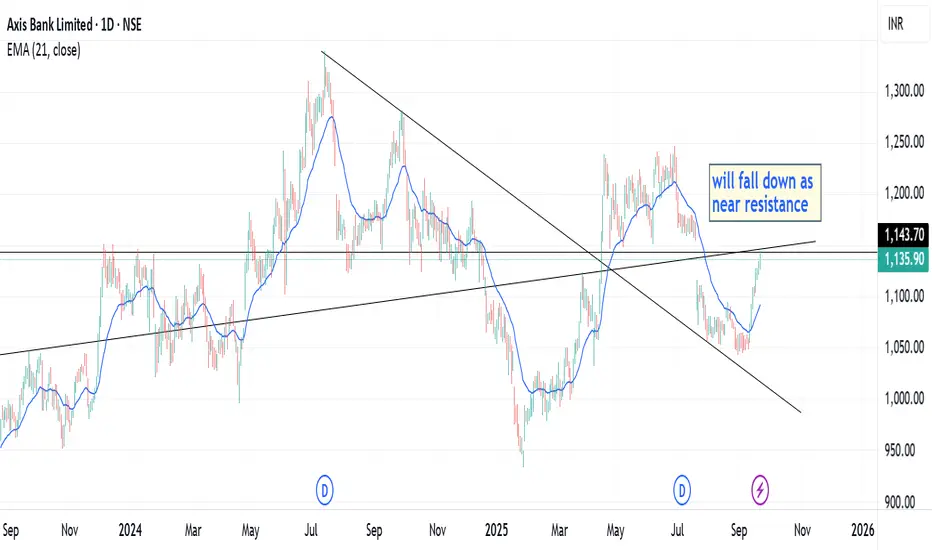
Near resistance level. will fall downThe diagram is self rexlpainatory. I have drawn resistance lines. and also the price is far from its EMA21 line. and so it will ussually come back near EMA. so for sure the stock will move down.
Event-Driven Trading: Strategies Around Quarterly Earnings1. Understanding Event-Driven Trading
Event-driven trading refers to strategies that seek to exploit short-term price movements caused by corporate or macroeconomic events. These events can include mergers and acquisitions (M&A), regulatory announcements, dividend announcements, product launches, and, most notably, quarterly earnings reports. Event-driven traders operate on the principle that markets do not always price in the full implications of upcoming news, creating opportunities for alpha generation.
Earnings announcements are particularly potent because they provide concrete, quantifiable data on a company’s financial health, guiding investor expectations for revenue, profit margins, cash flow, and future outlook. Given the structured release schedule of quarterly earnings, traders can plan their strategies in advance, combining statistical, fundamental, and technical analyses.
2. Anatomy of Quarterly Earnings Reports
Quarterly earnings reports typically contain several key components:
Revenue and Earnings Per Share (EPS): Core indicators of company performance. Earnings surprises—positive or negative—often trigger substantial stock price moves.
Guidance: Management projections for future performance can influence market sentiment.
Margins: Gross, operating, and net margins indicate operational efficiency.
Cash Flow and Balance Sheet Metrics: Provide insight into liquidity, debt levels, and overall financial health.
Management Commentary: Offers qualitative insights into business strategy, risks, and opportunities.
Understanding these elements is critical for traders seeking to anticipate market reactions. Historically, stocks tend to exhibit heightened volatility during earnings releases, creating both opportunities and risks for traders.
3. Market Reaction to Earnings
The stock market often reacts swiftly to earnings announcements, with price movements reflecting the degree to which actual results differ from expectations. The reaction is influenced by several factors:
Earnings Surprise: The difference between actual earnings and analyst consensus. Positive surprises often lead to price spikes, while negative surprises can trigger sharp declines.
Guidance Changes: Upward or downward revisions to guidance significantly impact investor sentiment.
Sector Trends: A company’s performance relative to industry peers can amplify market reactions.
Market Conditions: Broader economic indicators and market sentiment affect the magnitude of earnings-driven price movements.
Traders must understand that markets may overreact or underreact initially, presenting opportunities for both short-term and medium-term trades.
4. Event-Driven Trading Strategies Around Earnings
4.1 Pre-Earnings Strategies
Objective: Position the portfolio ahead of anticipated earnings to profit from expected price movements.
Straddle/Strangle Options Strategy
Buy both call and put options with the same expiration (straddle) or different strike prices (strangle).
Profitable when stock exhibits significant volatility regardless of direction.
Works well when implied volatility is lower than expected post-earnings movement.
Directional Bets
Traders with conviction about earnings outcomes may take long or short positions in anticipation of the report.
Requires robust fundamental analysis and sector insights.
Pairs Trading
Involves taking offsetting positions in correlated stocks within the same sector.
Reduces market risk while exploiting relative performance during earnings season.
4.2 Post-Earnings Strategies
Objective: React to market inefficiencies created by unexpected earnings results.
Earnings Drift Strategy
Stocks that beat earnings expectations often continue to trend upward in the days following the announcement, known as the “post-earnings announcement drift.”
Conversely, negative surprises may lead to sustained declines.
Traders can exploit these trends using momentum-based techniques.
Volatility Arbitrage
Earnings reports increase implied volatility in options pricing.
Traders can exploit discrepancies between expected and actual volatility post-announcement.
Fade the Initial Reaction
Sometimes markets overreact to earnings news.
Traders take contrarian positions against extreme initial moves, anticipating a correction.
5. Analytical Tools and Techniques
Successful event-driven trading relies heavily on data, models, and analytical frameworks.
5.1 Fundamental Analysis
Study revenue, EPS, margins, guidance, and sector performance.
Compare against historical data and analyst consensus.
Evaluate macroeconomic factors affecting the company.
5.2 Technical Analysis
Identify key support and resistance levels.
Use indicators like Bollinger Bands, RSI, and moving averages to gauge price momentum pre- and post-earnings.
5.3 Sentiment Analysis
Monitor social media, news releases, and analyst reports for market sentiment.
Positive sentiment can amplify price moves, while negative sentiment can exacerbate declines.
5.4 Quantitative Models
Statistical models can predict probability of earnings surprises and subsequent price movements.
Machine learning algorithms are increasingly used to forecast earnings-driven volatility and trade outcomes.
6. Risk Management in Earnings Trading
Event-driven trading carries elevated risk due to volatility and uncertainty. Effective risk management strategies include:
Position Sizing
Limit exposure per trade to manage potential losses from unexpected moves.
Stop-Loss Orders
Predefined exit points prevent catastrophic losses.
Diversification
Spread trades across sectors or asset classes to reduce idiosyncratic risk.
Hedging
Use options or futures contracts to offset directional risk.
Liquidity Assessment
Ensure sufficient market liquidity to enter and exit positions without excessive slippage.
Conclusion
Event-driven trading around quarterly earnings offers substantial opportunities for informed traders. By combining fundamental analysis, technical tools, options strategies, and disciplined risk management, traders can capitalize on the predictable yet volatile nature of earnings season. While challenges exist, a structured and strategic approach allows market participants to profit from both anticipated and unexpected outcomes.
The key to success lies in preparation, flexibility, and understanding market psychology. Traders who master earnings-driven strategies can achieve consistent performance, turning periodic corporate disclosures into actionable investment opportunities.
The Rise of Retail Traders and the Influence of Social MediaIntroduction
The landscape of financial markets has undergone a profound transformation in recent years, driven by the convergence of technological advancements and the democratization of information. Central to this evolution is the rise of retail traders—individual investors who engage in trading activities traditionally dominated by institutional players. This shift has been significantly influenced by the pervasive reach of social media platforms, which have become pivotal in shaping investment behaviors, disseminating financial information, and fostering online trading communities.
The Emergence of Retail Traders
Historically, access to financial markets was primarily the domain of institutional investors, hedge funds, and high-net-worth individuals. However, the advent of online trading platforms, coupled with the proliferation of mobile technology, has lowered the barriers to entry for individual investors. Platforms like Robinhood, Zerodha, and Upstox have democratized access to trading by offering commission-free trades, user-friendly interfaces, and educational resources. This accessibility has led to a surge in retail trading activity, with platforms reporting significant increases in user sign-ups and trading volumes.
For instance, Robinhood reported that nearly 40% of 25-year-olds used investment accounts in 2024, a sharp rise from 6% in 2015
Investopedia
. Similarly, in India, the number of retail investors has seen exponential growth, with millions participating in equity markets for the first time.
Social Media: The New Financial Frontier
Social media platforms have emerged as influential channels for financial discourse, information dissemination, and community building. Platforms such as Reddit, Twitter (now X), TikTok, and YouTube have become hubs where financial news, investment strategies, and market analyses are shared in real-time. The accessibility and immediacy of these platforms have empowered retail traders to make informed decisions, often in collaboration with like-minded individuals.
A notable example is Reddit's r/WallStreetBets community, where members engage in discussions about high-risk trading strategies, share investment insights, and collectively influence market movements. The GameStop short squeeze in early 2021 exemplified the power of social media in mobilizing retail traders to challenge institutional investors, leading to unprecedented volatility in the stock's price
TIME
.
The Role of Financial Influencers (Finfluencers)
The rise of social media has also given birth to a new class of financial content creators known as "finfluencers." These individuals leverage their online presence to share investment tips, market analyses, and trading strategies with their followers. While some finfluencers provide valuable insights, others may promote high-risk investments or products without adequate disclosures, raising concerns about the quality and reliability of financial advice available online
Financial Times
.
The influence of finfluencers is amplified by their ability to reach large audiences quickly and the trust that followers place in their recommendations. This dynamic has led to instances where retail traders, influenced by social media content, make investment decisions that may not align with traditional financial principles, potentially exposing them to increased risks.
Behavioral Implications and Market Dynamics
The integration of social media into trading practices has introduced new behavioral dynamics among retail traders. The constant flow of information, coupled with the desire for quick financial gains, can lead to impulsive decision-making and herd behavior. Retail traders may be swayed by trending stocks or viral content, often disregarding fundamental analyses.
Studies have shown that social media discussions can significantly influence investor sentiment and trading volumes. For example, the volume of comments and discussions on platforms like Reddit has been correlated with subsequent stock price movements, indicating that collective online sentiment can impact market dynamics
arXiv
.
Moreover, the phenomenon of "upward social comparison"—where individuals compare their financial achievements with those of others—can lead to increased risk-taking and trading activity. Investors exposed to peers' successes may feel compelled to emulate similar strategies, sometimes without fully understanding the associated risks
Nature
.
Regulatory Challenges and Misinformation
The rapid growth of retail trading and the pervasive influence of social media have posed significant challenges for regulators. The decentralized nature of information dissemination on social platforms makes it difficult to monitor and control the spread of misinformation, fraudulent schemes, and manipulative practices.
Regulatory bodies in various countries have begun to address these challenges by implementing measures to enhance transparency and protect investors. For instance, the UK's Financial Conduct Authority has introduced regulations under the Financial Promotions Regime to combat misleading financial content and has prosecuted violators
Financial Times
.
In India, the Securities and Exchange Board of India (SEBI) has issued advisories cautioning investors about the risks associated with financial influencers and the potential for deepfake videos to mislead investors
Reuters
. These efforts highlight the need for a balanced approach that fosters innovation while safeguarding investor interests.
The Future of Retail Trading and Social Media
Looking ahead, the intersection of retail trading and social media is poised to continue evolving. Advancements in artificial intelligence, machine learning, and data analytics are expected to further personalize trading experiences, offering tailored recommendations and predictive insights to individual investors.
Simultaneously, the role of social media in shaping market trends will likely intensify, with platforms developing more sophisticated tools to facilitate trading and investment discussions. The integration of social features into trading platforms, such as Robinhood's "Robinhood Social," exemplifies this trend by allowing users to follow and emulate successful traders in real-time
Investopedia
.
However, as the influence of social media grows, so too does the responsibility of platforms, influencers, and regulators to ensure that retail traders have access to accurate, reliable, and ethical financial information. The future of retail trading will depend on striking a balance between innovation, education, and regulation to create a sustainable and equitable financial ecosystem.
Conclusion
The rise of retail traders, fueled by the pervasive influence of social media, has transformed the financial landscape, democratizing access to trading and investment opportunities. While this shift has empowered individual investors, it has also introduced new challenges related to information reliability, behavioral biases, and regulatory oversight.
As the financial ecosystem continues to evolve, it is imperative for stakeholders—including investors, influencers, platforms, and regulators—to collaborate in fostering an environment that promotes informed decision-making, ethical practices, and financial literacy. By doing so, the potential of retail traders can be harnessed to contribute positively to the broader financial markets, ensuring that the benefits of this transformation are realized in a responsible and sustainable manner.

Beginner to Pro: How to Start Investing in Shares SafelyChapter 1: Understanding Shares – The Basics
Before you dive into investing, you need to know exactly what shares are.
What are Shares?
Shares represent ownership in a company. If you buy a share of Infosys, for instance, you own a tiny fraction of the company. If the company grows and earns profits, the value of your shares can rise.
Why Do Companies Issue Shares?
Businesses need capital to grow. Instead of borrowing money (which creates debt), they can sell ownership (shares) to investors. In return, investors get the chance to share in the company’s success.
Types of Returns You Can Get:
Capital Gains – When the price of your share increases (buy at ₹100, sell at ₹150).
Dividends – A part of company profits shared with shareholders.
Think of shares as a way to make your money work with businesses, instead of keeping it idle in a savings account.
Chapter 2: Why Invest in Shares?
Wealth Creation: Over long periods, stock markets usually outperform fixed deposits, bonds, or gold.
Beating Inflation: A savings account may give you 3–4% interest, but inflation eats away 6–7%. Stocks, on average, deliver 10–12% returns over time.
Ownership and Pride: Imagine telling people you own a slice of Tata Motors or Amazon!
Liquidity: Shares can be bought or sold easily on exchanges, unlike real estate which takes months.
Chapter 3: Common Myths About Investing in Shares
Many beginners stay away from shares because of myths. Let’s bust them:
“Stock market is gambling.”
Wrong. Gambling is pure chance. Investing is about analysis, discipline, and patience.
“You need to be rich to invest.”
False. Thanks to fractional investing and mobile apps, you can start with as little as ₹100–500.
“You need expert-level knowledge.”
Not true. You don’t need an MBA in finance to invest safely—you just need to learn basics and follow rules.
Chapter 4: Getting Started – First Steps
Open a Demat and Trading Account
Just like you need a wallet for cash, you need a Demat account to hold shares electronically. Almost every major bank and broker offers one.
Understand Stock Exchanges
In India: NSE and BSE.
Globally: NYSE, NASDAQ, London Stock Exchange.
Learn to Use a Trading App
Today’s apps are beginner-friendly, showing charts, prices, and company details.
Chapter 5: Safe Strategies for Beginners
Safety doesn’t mean avoiding stocks; it means choosing wisely.
Start with Blue-Chip Stocks
These are large, stable companies like Reliance, Infosys, HDFC Bank. They are less volatile than penny stocks.
Diversify Your Portfolio
Don’t put all your money into one company. Spread across sectors—banking, IT, FMCG, energy.
Avoid F&O (Futures & Options) Initially
These are advanced tools and can multiply losses quickly. Stick to equity investing first.
Follow the 70-20-10 Rule
70% in safe, large companies
20% in mid-cap, growing firms
10% in small-cap or experimental plays
Chapter 6: The Pro Mindset – Thinking Like an Investor
To move from beginner to pro, mindset is everything.
Think Long Term: Pro investors don’t panic on daily ups and downs. They focus on 3–5 year growth.
Understand Business, Not Just Price: Don’t chase cheap shares; look at companies with strong profits, management, and products.
Control Emotions: Fear and greed are the biggest enemies. Discipline is your best friend.
Chapter 7: Learning Fundamental Analysis
Fundamental analysis means studying a company’s health.
Revenue & Profit Growth: Are sales and profits rising every year?
Debt Levels: Too much debt can kill a business.
PE Ratio: Tells you if a stock is overvalued or undervalued compared to earnings.
Future Potential: Is the company innovating? Expanding?
Example: Infosys has steady revenue growth, low debt, and global presence → a safer bet.
Chapter 8: Learning Technical Analysis (The Smart Way)
While fundamentals tell you what to buy, technicals help you decide when to buy.
Support & Resistance Levels: Key price zones where stocks bounce or struggle.
Moving Averages (50-day, 200-day): Helps identify trend direction.
Volume Analysis: Rising price + rising volume = strong trend.
You don’t need to master 50 indicators—just focus on a few reliable ones.
Chapter 9: Common Mistakes Beginners Make
Chasing Hot Tips – Never buy just because a friend or TV anchor said so.
Overtrading – Frequent buying and selling only leads to high brokerage and losses.
Ignoring Risk Management – Never invest money you can’t afford to lose.
Panic Selling – Stocks dip often; don’t sell in fear unless fundamentals change.
Chapter 10: Building a Safe Investment Plan
Here’s a simple plan to follow:
Set Goals – Are you investing for 5 years (car), 10 years (house), or 20 years (retirement)?
Monthly SIP in Stocks or ETFs – Just like mutual funds, you can do systematic investments in stocks or index ETFs.
Rebalance Every Year – Shift money if one sector grows too heavy.
Emergency Fund – Always keep cash aside so you never sell stocks in desperation.
Conclusion: Your Roadmap from Beginner to Pro
Starting your share market journey can feel overwhelming. But if you:
Learn the basics,
Start small and safe,
Diversify your portfolio,
Focus on long-term goals,
Avoid emotional decisions,
…then you can grow from a beginner who is cautious and curious into a pro investor who handles wealth with confidence and safety.
Remember: Investing is a marathon, not a sprint. You don’t need to beat the market every day—you just need to let time, patience, and compounding work in your favor.
AXISBANK 1D Time frameUpdated Snapshot
Current Price: ₹1,105 – ₹1,107
Day’s Range: ₹1,101 – ₹1,110
Previous Close: ₹1,105.30
🔹 Support & Resistance
Support 1: ₹1,100 – ₹1,095
Support 2: ₹1,085 – ₹1,080
Resistance 1: ₹1,110 – ₹1,115
Resistance 2: ₹1,125 – ₹1,130
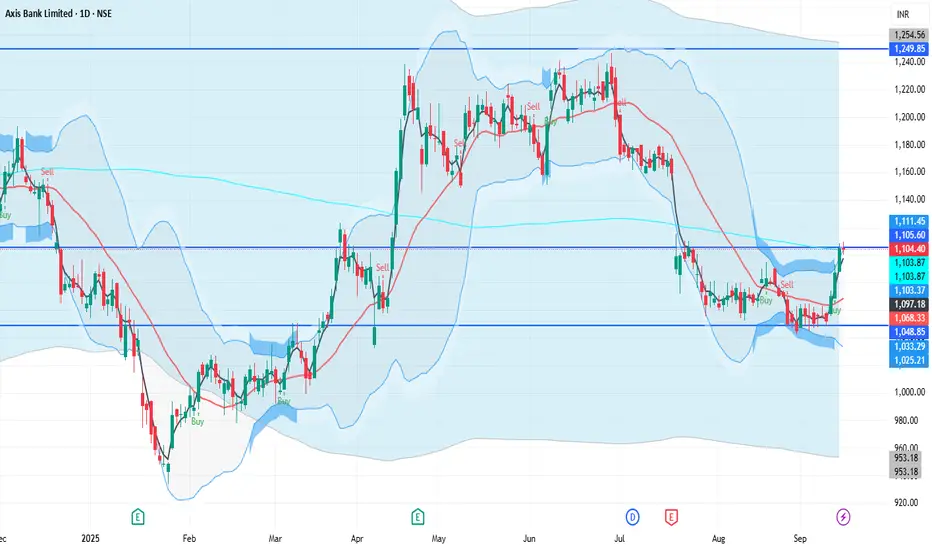
bankniftyI feel that bank nifty and axis bank has shown good recovery in the past two weeks. With axis bank closing over 200 dma and with strong gains for last three days, the momemtum should continue. Good time to buy for investors and traders as one can go positionally long here with targets of 1140 and 1220 on axis bank. no stoploss for nifty large cap stocks for investors.

Axis Bank Date 14.09.2025
Axis Bank
Timeframe : Day Chart
Technical Remarks :
(1) Conformation of Symmetrical Triangle Pattern after recent 2:2 channel confirmation
(2) Major support base at 1041 since forming just below symmetrical triangle
(3) Major resistance zone at 1232 since forming just above symmetrical triangle
(4) Major support/resistance at 1141 since forming at mid point of symmetrical triangle
(5) 200 EMA has shown strong character in the stock, next resistance/breakout is from 200 ema
(6) If breakdown occurs & RSI goes below mean reversion is short term weakness
(7) Upper exit from symmetrical triangle is good intraday/swing BTST opportunity , target 1232
(8) Lower exit from symmetrical triangle is good intraday/swing STBT opportunity , target 1041
Fundamental Remarks :
Market Leadership
(1) 3rd largest private sector bank in India
(2) 4th largest issuer of credit cards
(3) 19.8% market share in FY24
Ratios
(1) Capital Adequacy Ratio 16.63%
(2) Net Interest Margin 4.07%
(3) Gross NPA 1.43 %
(4) Net NPA 0.31%
(5) CASA Ratio 43%
Branch Network
(1) Metro 31%
(2) Semi-urban 29%
(3) Urban 23%
(4) Rural 17%
Revenue Mix
(1) Treasury 15%
(2) Corporate/Wholesale Banking 22%
(3) Retail Banking 61%
(3) Other Banking Business 2%
Loan Book
(1) Retail loans 60%
(2) Corporate 29%
(3) SME loans 11%
Retail Book
(1) Home loans 28%
(2) Rural loans 16%
(3) LAP 11%
(4) Auto loans 10%
(5) Personal loans 12%
(6) Small business banking 10%
(7) Credit cards 7%
(8) Comm Equipment 2%
(9) others 4%
Market Share
(1) 5.5% in Assets
(2) 5% in Deposits
(3) 5.9% in Advances
(4) 14% in Credit cards
(5) 5.2% in Personal loan
(6) 8.4% RTGS
(7) 30% NEFT
(8) 38.9% IMPS (by volume)
(9) 20% in BBPS
(10) 11.4% in Foreign LC
(11) 8.4% MSME credit
Regards,
Ankur
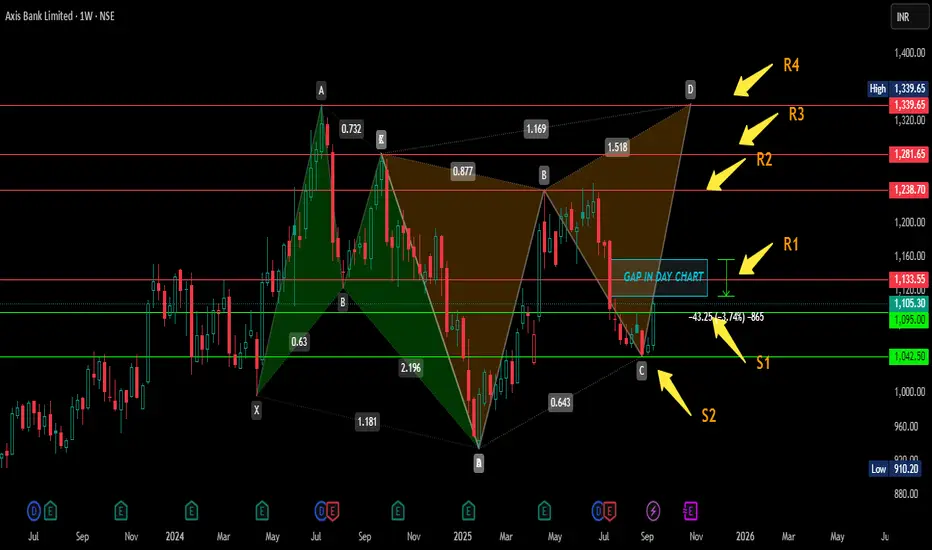
AXIS BANK WEEKLY ANALYSIS USING PATTERNIn this chart two butterfly patterns are plotted here one of them ia green which is comleted it's pattern as butterfly.
> Now other one is orrange in colour which is started to form BUTTERFY OR BAT i don't know, but my view is clear in this plot as i am expecting buttrfly.let's see what would be.
> Let me explain this chart is weekly where i mentioned support and resistance in green and red lines and marked by arrows.this support and resistances are on the basis of previous high or low so there should no one to be confused.
> Here weekly candle is closed above previous week high which is mentioned as S1.
> One more thing which i would like to say tou all that there is huge gap of almost 4% is mentioned as rectangle if you go in day chart it will be visible and i am expecting that this gap may be filled .
this is not my buy/sell call.
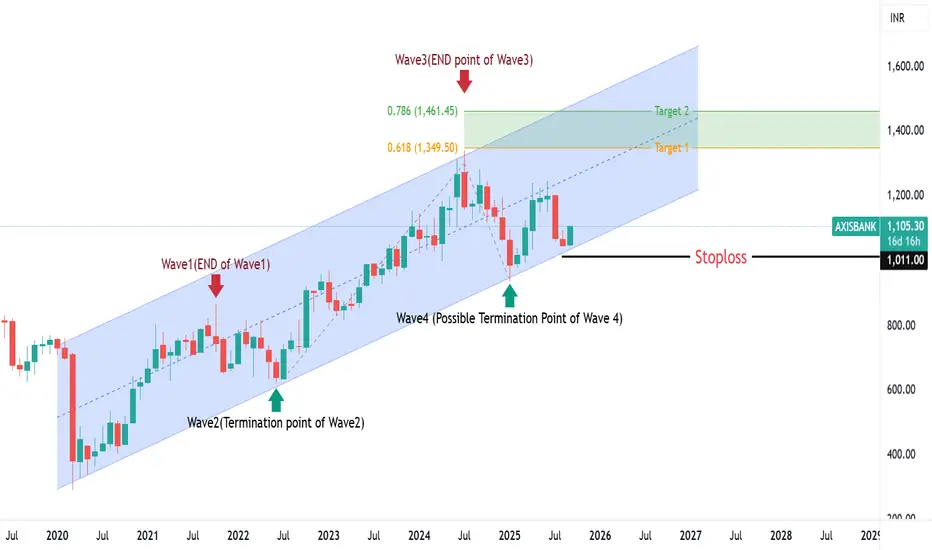
AXISBANK is likely finishing Wave 4 around the channel baseAxis bank currently trading in the bottom of Rising Channel, Which is the possible termination point of wave 4. If Wave 4 holds around ₹1,050–1,080, then possible Target on upside (wave 5) will be arround 1350 & 1450 ( As per Fibonacci Extension)with a stoploss of 1010Rs.
Wave count
Wave 1: Started in 2020, ended Oct 2021.
Wave 2: Corrective pullback into 2022.
Wave 3: Strong impulsive rally start July 2022 & ended in July 2024.
Wave 4: Current correction in 2024–2025, touching the lower boundary of channel.
If valid, Wave 5 is pending, Which will move the stock in 1350 to 1450 Range
It's not a buy or sell recommendation ...For education only
Option Trading Pros and Cons of Option Trading
Advantages
Limited risk (for buyers).
Leverage: control large positions with small capital.
Flexibility: profit in all market conditions.
Hedging tool.
Disadvantages
Complexity: requires deep understanding.
Option sellers face unlimited risk.
Time decay works against option buyers.
Requires good volatility forecasting.
Practical Examples of Option Trading
Example 1: Buying Call on Reliance
Reliance at ₹2,500. Buy 2600 CE for ₹50.
Expiry day: Reliance at ₹2,700.
Profit = (2700–2600) – 50 = ₹50 per share × lot size.
Example 2: Protective Put for Portfolio Hedge
You hold Nifty ETF at 20,000.
Buy 19,800 PE. If market crashes to 19,000, your put limits loss.
Psychology and Risk Control
Option trading is not just about math; it’s about discipline:
Avoid over-leveraging.
Always define stop-loss.
Respect time decay (theta).
Manage emotions – fear of missing out (FOMO) and greed are costly.

AXISBANK 1D Time frame📍 Current Price
₹1,105.30 (up 1.64% from previous close)
Short-Term Outlook
Bullish Scenario: A sustained move above ₹1,115 could lead to a test of the 52-week high around ₹1,281.65.
Bearish Scenario: A drop below ₹1,080 may signal a potential pullback toward the ₹1,050 level.

Smart Money Secrets in Trading1. What Is Smart Money?
The term “smart money” refers to capital controlled by investors with the most knowledge, resources, and influence in the market. Unlike retail traders who rely on news headlines, gut feelings, or basic technical indicators, smart money entities often have:
Advanced Research – Access to data analytics, machine learning models, and macroeconomic reports that retail traders can’t afford.
Liquidity Power – Ability to move billions of dollars into or out of markets.
Insider Insights – Not illegal insider trading, but a network of analysts, lobbyists, and industry connections that help them anticipate shifts earlier.
Sophisticated Tools – Proprietary algorithms, HFT (High-Frequency Trading) systems, and volume analysis.
When smart money flows into an asset, it often precedes strong trends. Conversely, when it exits, the trend weakens. Spotting these shifts is the cornerstone of trading like institutions.
2. Why Following Smart Money Matters
Most retail traders face three challenges:
They are late. By the time news is published, smart money has already acted.
They are emotional. Fear and greed drive poor decisions.
They are undercapitalized. Limited funds mean smaller risk tolerance and forced exits.
Smart money, on the other hand, has time, patience, and size on its side. They often accumulate positions when the market is quiet and distribute them when hype peaks. If retail traders learn to read footprints left by institutions, they can avoid being trapped and instead ride the waves created by these giants.
3. Smart Money Psychology
Before diving into strategies, it’s crucial to understand how smart money thinks differently:
Accumulation vs. Distribution: Institutions quietly build positions (accumulation) when prices are low and sentiment is negative. Later, they sell (distribution) when retail enthusiasm is high.
Liquidity Hunting: Big players need liquidity to enter and exit. They often push prices into zones where retail traders place stop-loss orders, triggering forced selling or buying, which provides liquidity for institutions.
Contrarian Nature: Smart money often takes positions opposite to the crowd. If everyone is bullish on a stock, institutions might be preparing to sell.
This mindset explains why retail traders often feel “the market is against them.” In reality, they are just on the wrong side of institutional strategies.
4. Smart Money Strategies in Action
a) Wyckoff Method
Richard Wyckoff’s market theory is one of the earliest frameworks for analyzing smart money moves. It breaks market cycles into accumulation, markup, distribution, and markdown.
Accumulation: Institutions quietly buy. Prices stay in a range.
Markup: Price breaks out as buying accelerates.
Distribution: Institutions sell to latecomers.
Markdown: Prices collapse as supply overwhelms demand.
Recognizing these phases helps traders align with institutional activity instead of being victims of it.
b) Volume Profile and Order Flow
Smart money activity often shows up in volume spikes at key price levels.
High Volume Nodes: Suggest accumulation/distribution zones.
Low Volume Nodes: Indicate areas where price moves quickly (little resistance).
Using tools like Volume Profile, Order Flow Charts, or Footprint Charts allows traders to identify where institutions are active.
c) Stop-Loss Hunting
Ever noticed your trade gets stopped out before the price reverses in your favor? That’s not coincidence. Institutions deliberately push prices into stop-loss zones to trigger retail exits, giving them the liquidity to enter positions. Recognizing liquidity pools (clusters of retail stops) helps traders anticipate these moves.
d) Options and Derivatives
Smart money often uses options to hedge or accumulate exposure without moving the underlying asset visibly. For example, unusual options activity (UOA) often precedes big stock moves. Tracking options volume and open interest provides clues about institutional expectations.
e) Dark Pools
Institutions often trade in “dark pools”—private exchanges where large orders are hidden from the public order book. While retail traders can’t see these trades in real time, monitoring dark pool data feeds can reveal where institutions are accumulating or unloading.
5. Indicators of Smart Money Activity
How can a retail trader detect smart money flow? Here are practical signals:
Unusual Volume – Sharp spikes in trading volume without corresponding news often signal institutional activity.
Price Action at Key Levels – Repeated defense of support/resistance zones often shows accumulation or distribution.
Commitment of Traders (COT) Reports – For commodities and forex, COT reports reveal institutional positions.
Options Activity – Large trades in far-dated contracts signal expectations of future moves.
Insider Buying/Selling – Public filings (like Form 4 in the US) show what company executives are doing with their shares.
Market Breadth Divergence – If a few large-cap stocks push indices higher while the majority lag, smart money may be distributing.
6. Smart Money Secrets Retail Traders Overlook
Secret 1: News Is Noise
By the time retail traders act on CNBC headlines, smart money has already positioned. Institutions often use news events to exit positions while retail crowds rush in.
Secret 2: Patience Pays
Smart money is not chasing quick profits—they wait weeks or months to build positions. Retail traders who overtrade often lose by being too impatient.
Secret 3: Fake Moves Before Real Moves
Markets often create false breakouts or sharp wicks to trick retail traders into the wrong direction. These are engineered by big players to grab liquidity.
Secret 4: Scaling In and Out
Institutions never place all their capital at once. They accumulate in layers to avoid moving the market. Retail traders often go “all in” and get wiped out.
Secret 5: Risk Management Is Non-Negotiable
The true secret of smart money isn’t just knowing where to trade—it’s knowing how much to risk. They survive losing streaks by controlling position size and leverage.
Conclusion
Smart money isn’t a mysterious cabal manipulating markets—it’s simply capital managed by those with deeper knowledge, bigger resources, and stronger discipline. Their secrets are not inaccessible; they’re patterns and behaviors visible to those who know where to look.
By understanding accumulation/distribution, liquidity hunting, volume footprints, options flow, and institutional psychology, retail traders can stop fighting the market and instead surf the waves created by the giants.
The real secret, however, is not in any single indicator—it’s in the mindset: patience, discipline, risk management, and the ability to think like an institution rather than a gambler. Once traders internalize this, they transition from being part of the crowd to moving in sync with the real power behind the markets.
Part 6 Learn Institutional Trading Call & Put Options Explained
At the heart of option trading are two instruments: Calls and Puts.
Call Option: Gives the buyer the right (not obligation) to buy the asset at the strike price.
Buyers expect prices to rise.
Sellers (writers) expect prices to stay flat or fall.
Put Option: Gives the buyer the right (not obligation) to sell the asset at the strike price.
Buyers expect prices to fall.
Sellers expect prices to stay flat or rise.
📌 Example:
If Reliance stock trades at ₹2500:
A ₹2600 call may cost ₹50 premium. If the stock rises to ₹2700, profit = (2700-2600-50) = ₹50 per share.
A ₹2400 put may cost ₹40. If stock falls to ₹2200, profit = (2400-2200-40) = ₹160 per share.
Key Concepts
Intrinsic Value: Real profit if exercised immediately.
Time Value: Premium paid for potential future movement.
In-the-Money (ITM): Option already profitable if exercised.
Out-of-the-Money (OTM): Option has no intrinsic value, only time value.
At-the-Money (ATM): Strike = current market price.

Part 4 Institutional TradingAdvantages of Option Trading
Leverage: Small premium controls large exposure.
Flexibility: Can profit in any market—up, down, or sideways.
Risk Management: Limited risk for buyers.
Income Generation: Option writing provides steady cash flow.
Risks of Option Trading
Despite advantages, options carry risks:
Time Decay: Options lose value as expiry approaches.
Volatility Risk: Changes in implied volatility can hurt positions.
Liquidity Risk: Some options may not have enough buyers/sellers.
Unlimited Risk for Writers: Option sellers face theoretically unlimited losses.
Options vs Futures
Many confuse options with futures. Key differences:
Futures: Obligation to buy/sell at expiry.
Options: Right, not obligation.
Futures: Unlimited risk both ways.
Options: Buyers’ risk limited to premium.

Option Trading Strategies1. Understanding Options Basics
Before diving into strategies, it’s important to understand the fundamental building blocks of options.
1.1 What Are Options?
Options are financial contracts that give the buyer the right, but not the obligation, to buy or sell an underlying asset at a predetermined price (strike price) before or on a specific date (expiry).
Call Option: Right to buy the asset.
Put Option: Right to sell the asset.
1.2 Key Terms
Premium: Price paid to buy the option.
Strike Price: Agreed-upon price for exercising the option.
Expiration Date: The last day the option is valid.
In-the-Money (ITM): Option has intrinsic value.
Out-of-the-Money (OTM): Option has no intrinsic value.
At-the-Money (ATM): Strike price is equal to the current market price.
1.3 Why Trade Options?
Leverage: Control large positions with small capital.
Hedging: Protect a portfolio from adverse moves.
Income Generation: Earn through option writing.
Speculation: Bet on market direction or volatility.
2. Broad Categories of Option Strategies
Option strategies are generally grouped based on market outlook:
Bullish Strategies – Profit when prices rise.
Bearish Strategies – Profit when prices fall.
Neutral Strategies – Profit when prices move sideways.
Volatility-Based Strategies – Profit from expected changes in volatility.
3. Bullish Option Strategies
When traders expect the underlying asset to rise, they can use the following strategies:
3.1 Long Call
Setup: Buy a call option.
Outlook: Strongly bullish.
Risk: Limited to the premium paid.
Reward: Unlimited upside.
Example: Stock at ₹100, buy a call at ₹105 for ₹3. If stock rises to ₹120, profit = ₹12.
3.2 Bull Call Spread
Setup: Buy a call at a lower strike, sell another at a higher strike.
Outlook: Moderately bullish.
Risk: Limited to net premium paid.
Reward: Capped at the difference between strikes minus premium.
Example: Buy ₹100 call for ₹5, sell ₹110 call for ₹2 → Net cost ₹3. Max profit = ₹7.
3.3 Bull Put Spread
Setup: Sell a put at a higher strike, buy a put at a lower strike.
Outlook: Bullish to neutral.
Risk: Limited to strike difference minus net premium.
Reward: Premium received.
Example: Stock at ₹100, sell ₹100 put at ₹6, buy ₹90 put at ₹3 → Net credit ₹3.
4. Bearish Option Strategies
For traders expecting price declines:
4.1 Long Put
Setup: Buy a put option.
Outlook: Strongly bearish.
Risk: Limited to premium paid.
Reward: Large downside profit.
Example: Stock ₹100, buy ₹95 put at ₹4. If stock drops to ₹80, profit = ₹11.
4.2 Bear Put Spread
Setup: Buy a higher strike put, sell a lower strike put.
Outlook: Moderately bearish.
Risk: Limited to net premium.
Reward: Strike difference minus premium.
4.3 Bear Call Spread
Setup: Sell a call at lower strike, buy a call at higher strike.
Outlook: Bearish to neutral.
Risk: Limited to difference between strikes minus premium.
Reward: Net premium received.
5. Neutral Strategies
When traders expect little price movement:
5.1 Iron Condor
Setup: Combine bull put spread and bear call spread.
Outlook: Expect low volatility.
Risk: Limited.
Reward: Premium collected.
Example: Sell ₹95 put, buy ₹90 put, sell ₹105 call, buy ₹110 call. Profit if stock stays between ₹95–₹105.
5.2 Iron Butterfly
Setup: Sell ATM call and put, buy OTM call and put.
Outlook: Very low volatility.
Risk/Reward: Limited.
Example: Stock at ₹100, sell ₹100 call and put, buy ₹95 put and ₹105 call.
5.3 Short Straddle
Setup: Sell ATM call and put.
Outlook: Expect no major move.
Risk: Unlimited.
Reward: Premium received.
5.4 Short Strangle
Setup: Sell OTM call and put.
Outlook: Neutral to slightly volatile.
Risk: Unlimited.
Reward: Premium received.
Practical Tips for Traders
Always start with simple strategies like covered calls and protective puts.
Understand the Greeks before attempting advanced strategies.
Trade liquid options (high volume, narrow spreads).
Backtest strategies before live trading.
Avoid overleveraging.
Conclusion
Option trading strategies open up a universe of opportunities far beyond simple stock investing. Whether a trader expects bullish rallies, bearish drops, or calm sideways markets, there is a strategy tailored to that scenario. From basic calls and puts to complex spreads and iron condors, the key is understanding risk, reward, and probability.
Success in options trading is not about predicting the market perfectly, but about managing trades with discipline, applying the right strategy for the market condition, and mastering risk management. For beginners, starting with conservative strategies builds confidence. For advanced traders, options provide powerful ways to optimize portfolios and capitalize on volatility.
AXISBANK 1D Time frame📊 Current Snapshot
Current Price: ₹1,073.50
Day’s Range: ₹1,069.00 – ₹1,073.20
52-Week Range: ₹934.00 – ₹1,281.75
Previous Close: ₹1,070.10
Opening Price: ₹1,069.00
Market Cap: Approx. ₹3.32 lakh crore
Volume: ~1.65 lakh shares
📈 Trend & Indicators
Trend: Neutral to mildly bullish; trading near 50-day and 200-day moving averages.
RSI (14): 60 – Neutral; no immediate overbought or oversold conditions.
MACD: Positive → indicates bullish momentum.
Moving Averages: Short-term moving averages suggest neutral to slightly bullish outlook.
🔮 Outlook
Bullish Scenario: Break above ₹1,075 with strong volume could target ₹1,090.
Bearish Scenario: Drop below ₹1,065 may lead to further decline toward ₹1,050.
Neutral Scenario: Consolidation between ₹1,065 – ₹1,075; breakout needed for directional move.
📌 Key Factors to Watch
Market Sentiment: Overall market trend and investor behavior.
Economic Indicators: Interest rates, inflation, and RBI policy updates.
Global Cues: Global market trends, US indices, crude oil, and currency movements.
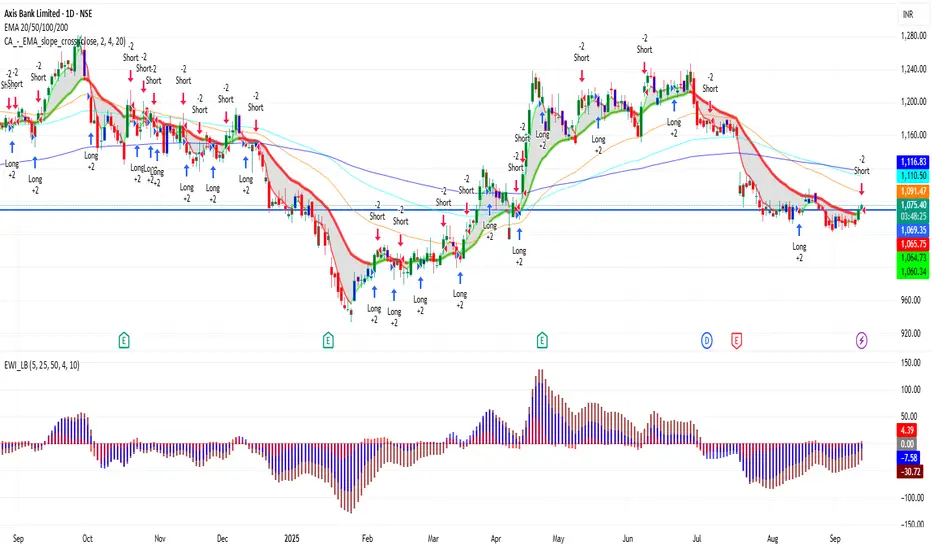
Consumer Price Index (CPI) in India1. Understanding the Consumer Price Index (CPI)
The CPI reflects the purchasing power of a country's currency by tracking price changes in a representative basket of goods and services. In India, the Ministry of Statistics and Programme Implementation (MoSPI) compiles the CPI using a base year of 2012. The index is categorized into several groups, including:
Food and Beverages: Comprising items like cereals, pulses, vegetables, fruits, and beverages.
Housing: Reflecting the cost of housing in urban areas.
Clothing and Footwear: Encompassing garments and footwear.
Fuel and Light: Including energy costs such as electricity and fuel.
Miscellaneous: Covering items like education, health, transport, and communication.
Each category has a specific weight in the overall CPI calculation, influencing its impact on the total inflation rate.
2. Recent Trends in India's CPI
July 2025: A Historic Low
In July 2025, India's CPI inflation rate fell to a remarkable 1.55%, the lowest since June 2017. This decline was primarily driven by a significant drop in food prices, with the Consumer Food Price Index (CFPI) turning negative at -1.76%. This marked the first instance of negative food inflation since January 2019
The Times of India
.
The breakdown of inflation rates by sector in July 2025 was as follows:
Rural Areas: Headline inflation at 1.18%, with food inflation at -1.74%.
Urban Areas: Headline inflation at 2.05%, with food inflation at -1.90%.
Combined (All India): Headline inflation at 1.55%, with food inflation at -1.76%
Statistics Ministry
.
These figures indicate a broad-based decline in inflation across both rural and urban sectors.
Factors Contributing to the Decline
Several factors contributed to the sharp decline in CPI inflation:
Base Effect: The high inflation rates in the previous year created a favorable base for comparison, amplifying the perceived decline in current inflation.
Falling Food Prices: A significant decrease in the prices of essential food items, including pulses, vegetables, and cereals, led to negative food inflation.
Stable Fuel Prices: The moderation in fuel prices helped contain overall inflationary pressures.
Government Policies: Measures such as the reduction in Goods and Services Tax (GST) rates on essential items provided relief to consumers and helped lower prices.
3. Sectoral Analysis of CPI Components
Food and Beverages
Food inflation plays a pivotal role in the overall CPI, given its substantial weight in the index. In July 2025, food inflation turned negative, with the CFPI at -1.76%. This was attributed to:
Abundant Harvests: Favorable monsoon conditions led to increased agricultural production, resulting in lower food prices.
Government Interventions: Policies aimed at ensuring food security and stabilizing prices contributed to the decline in food inflation.
Housing
Housing inflation remained relatively stable, with a slight decrease from 3.18% in June 2025 to 3.17% in July 2025. This stability reflects the consistent demand for housing in urban areas and the ongoing challenges in the real estate sector.
Clothing and Footwear
Inflation in this category remained subdued, aligning with the overall trend of reduced consumer spending and stable supply chains.
Fuel and Light
Fuel inflation saw a marginal increase from 2.55% in June 2025 to 2.67% in July 2025. While global oil prices remained volatile, domestic factors such as exchange rates and taxation influenced fuel prices.
Miscellaneous Categories
Education: Inflation in education services remained high at 4.00%, reflecting the increasing cost of private education and related services.
Health: Health inflation stood at 4.57%, driven by rising medical costs and healthcare services.
Transport and Communication: Inflation in this sector was 2.12%, influenced by fuel prices and transportation demand.
4. Regional Disparities in Inflation
Inflation rates varied across different states in India. For instance:
Kerala: Recorded a higher inflation rate due to increased demand and higher costs in urban centers.
Jammu & Kashmir: Experienced elevated inflation, partly due to logistical challenges and supply constraints.
Punjab and Karnataka: Saw moderate inflation rates, reflecting balanced supply and demand dynamics.
These regional disparities underscore the importance of localized economic policies to address specific inflationary pressures.
5. The Role of the Reserve Bank of India (RBI)
The RBI closely monitors CPI inflation as part of its monetary policy framework. The central bank aims to maintain inflation within a target range to ensure economic stability. In response to the declining inflation rates:
Interest Rates: The RBI kept the policy interest rate unchanged at 5.50% in its recent review, citing the benign inflation outlook
Reuters
.
Inflation Targeting: The RBI's flexible inflation targeting framework allows for adjustments in policy to respond to evolving economic conditions.
6. Implications for the Economy
The sharp decline in CPI inflation has several implications:
Consumer Purchasing Power: Lower inflation enhances consumers' purchasing power, potentially boosting demand for goods and services.
Monetary Policy: The RBI's accommodative stance may support economic growth, especially in sectors sensitive to interest rates.
Government Policies: The government may consider fiscal measures to sustain the inflationary trend and support economic recovery.
7. Challenges and Risks
Despite the favorable inflation scenario, several challenges persist:
Global Economic Uncertainties: Fluctuations in global commodity prices and geopolitical tensions can impact domestic inflation.
Supply Chain Disruptions: Ongoing supply chain issues may lead to price volatility in certain sectors.
Monsoon Variability: Dependence on monsoon for agricultural output makes food prices susceptible to climatic variations.
8. Future Outlook
Looking ahead, the CPI inflation trajectory will depend on:
Monsoon Performance: A normal monsoon is crucial for stable food prices.
Global Commodity Prices: Movements in global oil and commodity markets will influence domestic inflation.
Policy Interventions: Continued fiscal and monetary measures will play a role in managing inflation expectations.
Economists forecast that CPI inflation may remain within the RBI's target range in the near term, barring significant external shocks.
9. Conclusion
The Consumer Price Index serves as a vital barometer of economic health in India. The recent decline in CPI inflation reflects a combination of favorable domestic conditions and effective policy measures. However, sustained vigilance is necessary to address emerging challenges and ensure that inflation remains conducive to economic growth and stability.
