Sector Rotation & Thematic TradingIntroduction
In the dynamic world of stock markets, not all sectors perform equally at all times. Market leadership often shifts as economic conditions change. This shift is known as sector rotation, and when paired with thematic trading—investing based on macro-level ideas or societal trends—it becomes a powerful strategy. Together, these approaches help traders anticipate where capital might flow next, allowing them to align their portfolios accordingly.
This guide explores the foundations, strategies, tools, and risks associated with Sector Rotation and Thematic Trading, especially from the perspective of an active Indian retail or institutional trader.
1. Understanding Sector Rotation
What is Sector Rotation?
Sector rotation is a strategy that involves shifting investments among different sectors of the economy based on the current phase of the business cycle. Each sector behaves differently under various economic conditions, and recognizing these shifts can help maximize returns.
The Four Phases of the Business Cycle:
Expansion: Economy grows, GDP rises, unemployment falls.
Strong Sectors: Industrials, Technology, Consumer Discretionary
Peak: Growth slows, inflation rises.
Strong Sectors: Energy, Materials, Utilities
Contraction (Recession): GDP falls, unemployment rises.
Strong Sectors: Consumer Staples, Healthcare
Trough (Recovery): Economy bottoms out, early growth.
Strong Sectors: Financials, Industrials, Technology
Why Does Sector Rotation Work?
Institutional flow: Big funds adjust their portfolios depending on economic forecasts.
Macroeconomic sensitivity: Some sectors are more interest-rate sensitive, others more dependent on consumer confidence.
Cyclical vs Defensive Sectors: Cyclical sectors move with the economy; defensive sectors offer stability during downturns.
2. Sector Rotation in Practice
Real-Life Example: Post-COVID Recovery
2020-21: Pharma, Tech (work-from-home, vaccines)
2021-22: Commodities, Real Estate (stimulus, demand revival)
2023 onwards: Industrials, Capital Goods (infrastructure push, global reshoring)
Indian Market Examples:
Banking & Financials: Surge when RBI eases interest rates or during credit booms.
FMCG & Healthcare: Outperform during inflation or slowdowns.
Auto Sector: Grows with consumer confidence and disposable income.
Infra & PSU Stocks: Outperform during budget season or government CapEx pushes.
Tracking Sector Rotation: Tools & Indicators
Relative Strength Index (RSI) comparisons between sectors.
Sector-wise ETFs or Index tracking: Nifty Bank, Nifty IT, Nifty FMCG, etc.
FII/DII Flow Analysis sector-wise.
Economic data correlation: IIP, Inflation, GDP data.
3. Thematic Trading Explained
What is Thematic Trading?
Thematic trading focuses on investing in long-term structural trends rather than short-term economic cycles. It’s about identifying a big idea and aligning with it over time, often across multiple sectors.
Key Differences vs Sector Rotation
Feature Sector Rotation Thematic Trading
Focus Economic cycles Societal or tech trends
Duration Medium-term (months) Long-term (years)
Scope Sector-based Cross-sector or multi-sector
Tools Macro indicators, ETFs Trend analysis, qualitative research
4. Popular Themes in Indian & Global Markets
a. Green Energy & Sustainability
Stocks: Adani Green, Tata Power, IREDA
Theme: ESG investing, net-zero targets, solar & wind energy
b. Digital India & Fintech
Stocks: CAMS, Paytm, Zomato, Nykaa
Theme: UPI adoption, e-governance, cashless economy
c. EV & Battery Revolution
Stocks: Tata Motors, Exide, Amara Raja, M&M
Theme: Electric mobility, lithium-ion battery, vehicle electrification
d. Infrastructure & CapEx Cycle
Stocks: L&T, IRFC, NCC, RVNL, BEL
Theme: Government spending, Budget CapEx push, Atmanirbhar Bharat
e. Manufacturing & China+1
Stocks: Dixon, Amber, Syrma SGS, Tata Elxsi
Theme: Global supply chain diversification, PLI schemes
f. AI & Tech Transformation
Stocks: TCS, Infosys, Happiest Minds
Theme: Cloud computing, automation, generative AI
g. Rural India & Agri-Tech
Stocks: PI Industries, Dhanuka, Escorts
Theme: Digital farming, Kisan drones, government subsidies
5. How to Implement Sector Rotation & Thematic Trading
Step-by-Step Framework
Macro Analysis:
Understand current phase of the economy.
Follow RBI policy, inflation, IIP, interest rate cycles.
Identify Sector Leaders:
Use Relative Strength (RS) comparison.
Look for outperforming indices or sector ETFs.
Stock Screening:
Pick stocks within strong sectors using volume, trend, and fundamentals.
Focus on high-beta stocks during sector rallies.
Thematic Mapping:
Overlay ongoing themes with sector strengths.
For example: In CapEx cycle (sector), Infra (theme), pick RVNL, L&T, NBCC.
Entry Timing:
Look for sector breakout on charts (weekly/monthly).
Confirm using sector rotation tools like RRG charts.
Exit/Rotate:
Monitor sector fatigue and capital rotation signals.
Shift to next sector as per business cycle or theme exhaustion.
Final Thoughts
Sector Rotation and Thematic Trading are no longer just institutional tools—they are critical for any modern trader or investor looking to outperform in both short-term and long-term markets. With macro awareness, charting skills, and access to quality data, traders can dynamically shift capital, aligning with both economic cycles and thematic tailwinds.
The trick is to stay informed, agile, and selective—rotating not just sectors, but your mindset as market conditions evolve.
Trade ideas

Options Trading Strategies (Weekly/Monthly Expiry)Introduction
Options trading is a powerful tool that offers flexibility, leverage, and hedging opportunities to traders. While buying and selling options is accessible, mastering strategies tailored for weekly and monthly expiries can significantly improve your chances of success. These expiry-based strategies are designed to take advantage of time decay (Theta), volatility (Vega), direction (Delta), and price range (Gamma).
This guide will deeply explore how traders approach weekly vs monthly expiry, key option strategies, risk-reward setups, and market conditions under which they’re best applied. It’s designed in simple, human-friendly language, ideal for both beginners and experienced traders.
Part 1: Understanding Expiry Types
Weekly Expiry Options
Expiry Day: Every Thursday (for NIFTY, BANKNIFTY) or the last Thursday of the week if Friday is a holiday.
Time Horizon: 1–7 days
Used by: Intraday and short-term positional traders
Purpose: Quick premium decay (theta decay is faster), suitable for short-duration strategies.
Monthly Expiry Options
Expiry Day: Last Thursday of every month
Time Horizon: 20–30 days
Used by: Positional traders, hedgers, and institutions
Purpose: Manage risk, longer setups, or swing trades; smoother premium decay compared to weeklies.
Part 2: Key Greeks in Expiry-Based Strategies
Understanding how Greeks behave around expiry is crucial:
Theta: Time decay accelerates in the final days (especially for weekly options).
Delta: Determines direction sensitivity; weekly options are more delta-sensitive near expiry.
Vega: Volatility effect; monthly options are more exposed to volatility changes.
Gamma: High near expiry, especially in ATM (At-the-Money) options — can lead to quick losses/gains.
Part 3: Weekly Expiry Strategies
1. Intraday Short Straddle (High Theta Play)
Setup: Sell ATM Call and Put of current week’s expiry.
Objective: Capture premium decay as the price stays around a range.
Best Time: Expiry day (Thursday), typically after 9:45 AM when direction becomes clearer.
Example (NIFTY at 22,000):
Sell 22000 CE and 22000 PE for ₹60 each.
Conditions:
Low India VIX
Expected range-bound movement
No major news or global event
Risks:
Sudden movement (delta risk)
Need for proper stop-loss or delta hedging
2. Short Iron Condor (Neutral)
Setup: Sell OTM Call and Put; Buy further OTM Call and Put for protection.
Risk-defined strategy, ideal for weekly expiry when you expect low movement.
Example:
Sell 22100 CE and 21900 PE
Buy 22200 CE and 21800 PE
Benefit:
Controlled loss
Decent return if the index stays in range
When to Use:
Mid-week when implied volatility is high
Event expected to cool off
3. Long Straddle (Directional Volatility)
Setup: Buy ATM Call and Put of the same strike.
Best for: Sudden movement expected — news, results, RBI event.
Example (Bank Nifty at 48,000):
Buy 48000 CE and 48000 PE
Break-even:
Needs large move to be profitable (due to premium paid on both sides)
Risk:
Premium loss if market remains flat
4. Directional Option Buying (Momentum)
Setup: Buy CE or PE depending on market trend.
Ideal for: Trending days (Tuesday to Thursday)
Time decay: High risk in weekly expiry. Must be quick in entries and exits.
Example:
Bank Nifty bullish -> Buy 48000 CE when price breaks above a resistance.
Tips:
Use support/resistance, volume, and OI data
Avoid buying deep OTM options
5. Option Scalping on Expiry Day
Method: Trade ATM options in 5-minute or 15-minute chart using price action.
Goal: Capture small moves multiple times — 10 to 20 points in NIFTY or BANKNIFTY
Works Best:
Thursday (expiry)
Volatile days with good volumes
Tools:
VWAP, OI buildup, Breakout strategy, Moving Averages
Part 4: Monthly Expiry Strategies
1. Covered Call (Long-Term Positioning)
Setup: Buy stocks (or futures), sell OTM call options
Goal: Earn premium while holding stocks
Example:
Buy Reliance stock at ₹2800
Sell 2900 CE monthly option for ₹50
Best For:
Investors with long-term holdings
Stable stocks with limited upside
2. Calendar Spread (Volatility Strategy)
Setup: Sell near expiry (weekly), buy far expiry (monthly)
Example:
Sell 22000 CE (weekly)
Buy 22000 CE (monthly)
Goal:
Earn premium from weekly decay, protect via long monthly
Best Time:
When volatility is expected to rise
Ahead of big events like elections, RBI meet
3. Bull Call Spread (Directional)
Setup: Buy ATM Call, Sell OTM Call
Risk-defined bullish strategy
Example:
Buy 22000 CE, Sell 22200 CE (monthly)
Payoff:
Limited profit, limited risk
Better risk-reward than naked option buying
Use When:
Monthly expiry in bullish trend
Budget rallies, earnings momentum
4. Bear Put Spread (Downside Protection)
Setup: Buy ATM Put, Sell OTM Put
Use for: Bearish view with limited loss
Example:
Buy 22000 PE, Sell 21800 PE (monthly)
Ideal For:
Volatile times with expected downside
FII outflows, global corrections
5. Ratio Spread (Moderately Bullish or Bearish)
Setup: Buy 1 ATM Option, Sell 2 OTM Options
Warning: Can cause unlimited loss if trade goes against you
Example (Bullish Ratio Call Spread):
Buy 22000 CE, Sell 2x 22200 CE
Conditions:
Monthly expiry
Expect mild upward move but not aggressive rally
Conclusion
Trading weekly and monthly expiry options offers unique opportunities and risks. Weekly options give fast profits but demand sharp timing and discipline. Monthly options offer more flexibility for directional, volatility, and income-based strategies.
Whether you’re a scalper, trend trader, or risk-averse investor, there’s a strategy suited for your style — but success depends on combining the right strategy with sound analysis, proper risk control, and emotional discipline.
News-Based Momentum TradingIntroduction
In the fast-paced world of financial markets, news-based momentum trading stands out as one of the most powerful short-term strategies. It harnesses the psychological impact of breaking news on investor sentiment and exploits it to ride price momentum. Whether it's a corporate earnings surprise, regulatory change, economic announcement, geopolitical conflict, or a CEO scandal — news can move markets in seconds.
This strategy aims to identify such news as early as possible and enter trades aligned with the initial price momentum triggered by the event. The idea is simple: "Buy the good news, sell the bad news", but execution is where mastery lies.
What is News-Based Momentum Trading?
News-Based Momentum Trading is a technical and sentiment-driven approach that relies on real-time news events to create a trading opportunity. When a major piece of news breaks, it often leads to a rapid price reaction. Momentum traders aim to enter the trade in the direction of that reaction, expecting further continuation of price due to:
Herd behavior
Panic or euphoria
Short covering or long liquidation
Delay in information absorption by the wider market
Unlike long-term investing where news is absorbed over time, this strategy thrives on short bursts of volatility and liquidity. The holding period can range from a few minutes to a few days.
Core Principles Behind News-Based Momentum Trading
Price Reacts Faster Than Fundamentals
News affects sentiment before it alters earnings, business models, or valuations.
Price often overshoots fundamentals in the short term due to emotional reactions.
Volume Validates News
Spikes in volume during or after a news event confirm broad market participation.
High volume ensures liquidity for entering/exiting trades efficiently.
Follow the Flow, Not the News
It's not just the content of the news but the market’s reaction to it that matters.
Some negative news gets ignored; some positive news leads to massive rallies. Focus on how price behaves, not how you feel about the news.
Speed and Discipline are Critical
The best trades are often gone in minutes.
Emotional hesitation results in missed or failed trades.
Types of News That Create Momentum
Not all news has the same impact. Here's a breakdown of high-impact categories for momentum trading:
1. Corporate Earnings Announcements
Beats or misses of EPS/revenue estimates
Forward guidance or revision of outlook
Surprise dividend payouts or buyback plans
2. Mergers and Acquisitions (M&A)
Acquisition of a company (target tends to surge, acquirer may dip)
Strategic alliances and joint ventures
De-mergers and spin-offs
3. Regulatory Approvals or Bans
FDA approvals (biotech)
SEBI/RBI policy updates (Indian markets)
Anti-trust decisions or penalties
4. Economic Data Releases
Inflation (CPI, WPI)
GDP numbers
Employment data (e.g., U.S. Non-Farm Payrolls)
RBI/Fed interest rate decisions
5. Geopolitical Events
Wars, sanctions, terrorist attacks
Elections and political transitions
Trade disputes (e.g., U.S.-China trade war)
6. Sector-Specific News
Government incentives (PLI schemes)
Commodity price fluctuations (oil, gold, etc.)
Climate-related events (impacting agriculture, energy)
Tools & Indicators for News-Based Momentum Trading
Though news is the trigger, technical tools help refine entries:
1. Volume Spike Detector
Look for sudden surges in volume
VWAP and OBV (On-Balance Volume) indicators confirm strong participation
2. Moving Averages
9 EMA and 20 EMA help confirm short-term momentum
Price above 20 EMA post-news often signals continuation
3. VWAP (Volume Weighted Average Price)
Great tool for intraday traders
If price holds above VWAP after news, bias is bullish
4. Price Action & Candlestick Patterns
Bullish Marubozu or Engulfing candle post-news
Avoid Doji or indecisive candles immediately after news
Example: News-Based Momentum Trade (Real Case)
Stock: Tata Motors
News: JLR posts record quarterly sales, beats estimates
Initial Reaction: Stock gaps up 4% at open
Volume: Highest in 3 months
Action:
Entry: Break above 2-day high at ₹880
SL: ₹868 (below VWAP and breakout candle low)
Target: ₹910 (Fibonacci extension level)
Result: Stock hit ₹915 within 2 sessions.
Why it worked:
Strong earnings surprise
Sector-wide interest in autos
Clean technical breakout
Risks and Challenges in News-Based Momentum Trading
1. Fakeouts / Whipsaws
Not all news leads to sustained momentum.
Price may reverse after a knee-jerk reaction.
2. Late Entry
Retail traders often enter after the move is already 80% done.
Chasing rallies often leads to losses.
3. Overtrading and Emotion
Frequent news events can tempt traders to overtrade.
Not every piece of news is tradable.
4. Slippage and Gaps
Entry and exit prices may not be ideal due to fast moves.
Pre-market or after-hours news leads to gaps.
5. Fake News / Rumors
Always confirm the source.
Do not trade on unverified social media posts.

Institutional Intraday option Trading🏛️ Institutional Intraday Option Trading
Trade like the big players — with speed, strategy, and smart money precision.
This is high-level intraday options trading the way institutions do it — not with guesswork, but with structure, volume, and calculated risk.
🔥 What You’ll Learn:
Smart Money Concepts – Recognize institutional footprints & price manipulation
Intraday Market Structure – Breakouts, fakeouts, traps & liquidity zones
High-Volume Option Levels – Trade where institutions act
Scalp-to-Swing Entries – Fast setups with defined risk
Tight Risk Management – Stop loss placement like a pro
Time & Premium Decay Tactics – Trade with Theta on your side
💼 Perfect For:
✅ Intraday Option Traders
✅ Scalpers & Index Traders (Nifty/BankNifty )
✅ Anyone ready to follow the real momentum
📌 Fast markets need smart strategies.
Learn to dominate intraday moves with institutional logic.

Institutional Intraday option Trading🧠 What is Institutional Intraday Options Trading?
Institutional intraday options trading refers to short-term options strategies executed by large institutions with the intent to profit from price movements, volatility, and order flow within a single trading session.
Unlike positional or swing trading, intraday strategies demand high accuracy, precision, and speed, which institutions handle using advanced systems and huge capital.
🏢 Who Are the Institutions?
Institutions that dominate intraday options trading include:
Hedge Funds
Proprietary Trading Desks (Prop Desks)
Foreign Institutional Investors (FIIs)
Domestic Institutional Investors (DIIs)
Investment Banks
Market Makers
These players have access to deep capital, faster execution platforms, and exclusive market data.
🔄 Institutional Objectives in Intraday Options
Capture Short-Term Volatility
Using strategies like Straddles, Strangles, Iron Condors.
Targeting events like news, economic data releases, or earnings.
Liquidity Management
Institutions provide liquidity through market-making and benefit from spreads.
Risk Hedging
Intraday options are also used to hedge large cash or futures positions.
Arbitrage Opportunities
Spot-Future arbitrage
Volatility arbitrage
Calendar spread arbitrage
📈 Common Institutional Intraday Option Strategies
1. Delta Neutral Scalping
Strategy: Sell ATM straddle and keep delta hedged.
Objective: Earn from theta decay and re-hedging.
2. Gamma Scalping
Based on buying options and adjusting delta frequently as prices move.
Profitable during high intraday volatility.
3. Option Writing with IV Crush
Institutions short options during events like RBI policy, Budget, or results.
Profits from rapid drop in Implied Volatility after the event.
4. Directional Betting with Flow Analysis
Tracking aggressive option buying/selling in OTM/ATM strikes.
Directional trades using high-volume & OI shifts.
5. Statistical Arbitrage
Using quant models to exploit temporary mispricings.
🧩 Institutional Footprints on Option Charts
Retail traders can spot institutional footprints by:
Large ATM Straddle positions
IV divergence in option chain
Open Interest buildup without price movement (Smart money quietly entering)
Options being written at key support/resistance zones
Example:
If Bank Nifty is consolidating near a resistance and suddenly 2 lakh OI is built up in 50 point OTM Calls with low IV – this may be Call writing by institutions expecting price rejection.
⚠️ Risks and Control Measures Used by Institutions
Real-time Risk Monitoring Tools
Delta/Gamma/Vega Exposure Management
Limit on maximum intraday drawdown
AI-driven decision engines to avoid emotional trades
✅ How Can Retail Traders Learn from Institutions?
Follow Open Interest + Volume Patterns
Observe institutional behavior on expiry days
Study option flow at key market levels
Backtest Straddles/Strangles on high IV days
Use Option Greeks for proper understanding
Always trade with risk-defined strategies (no naked selling without hedge)
📌 Final Thoughts
Institutional Intraday Options Trading is not about gambling or just clicking buy/sell — it’s an advanced, mathematically balanced, and data-backed approach to generate consistent intraday alpha from the market. Institutions often move ahead of retail due to technology, access, discipline, and experience.
Retail traders can’t copy the scale but can adapt the logic:
Focus on analyzing institutional footprints
Learn to read the option chain like a map
Use data, not emotions

AXISBANK – 1D Timeframe📊 AXISBANK – DAILY CHART (1D TIMEFRAME)
📅 Date: July 18, 2025
Closing Price: ₹1,099
Change: –₹60.50 (–5.2%)
Intraday Range: ₹1,074 (Low) – ₹1,159 (High)
52‑Week Range: ₹867 – ₹1,186
YTD Return: Approx. +8%
Volume: Heavier than average, indicating strong selling pressure.
⚠️ MARKET CONTEXT & TREND
Bearish Trend: Axis Bank has broken below key support zones.
Oversold RSI: While it suggests possible short-term bounce, confirmation is needed.
Strong ADX: Indicates trend strength is increasing — in this case, on the downside.
High Volume Sell-off: Indicates institutional or heavy selling pressure.
No reversal indicators yet – MACD is still negative and falling.
🔍 SUMMARY VIEW
Trend: Strongly Bearish
Momentum: Weak, heavily oversold
Volatility: High
Reversal Signs: Not yet confirmed
Short-Term Outlook: Bearish to sideway unless price reclaims ₹1,120–1,150 zone
🔮 WHAT TO WATCH NEXT
Reversal Confirmation: Look for RSI climbing back above 30 and MACD crossover.
Volume Drop on Red Days: If selling volume dries up, it may signal weakening bears.
Breakout above ₹1,150: Could confirm fresh buying and trend reversal.
Further Drop Below ₹1,070: Could lead to panic selling and deeper correction
Axis Bank Looking good on weekly chartNSE:AXISBANK
Expecting to form nice pattern of HnS in weekly chart.
Good to keep on the radar
Always respect SL & position sizing
========================
Trade Secrets By Pratik
========================
Disclaimer
NOT SEBI REGISTERED
This is our personal view and this analysis
is only for educational purposes
Please consult your advisor before
investing or trading
You are solely responsible for any decisions
you take on basis of our research.

R R 1.5⦁ Only Trendlines Used — No Other Confluence
⦁ Stoploss Is Based on the Trendline
⦁ Retest of Trendline Builds Confidence
⦁ Trendline Angle Shows Momentum
⦁ Trendlines Define Risk Clearly
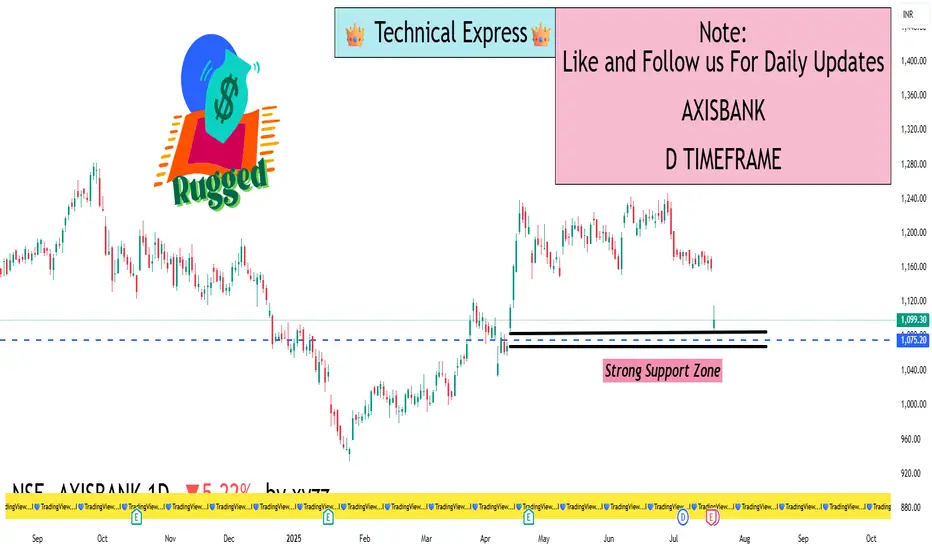
Axisbank near the Bottom of rangeAxis Bank has been in a consolidation range since last 70+ days. Price's been making high of Rs 1240 and low of Rs 1150 since then.
Now, the price has come near 1150 (Range Low). Again price is expected to bounce from the range low to 1240 leaving an opportunity to grab near about 7% profit in a shorter period of time.
With Risk Taking till price reaches below Rs. 1150.
Price breaching below range low i.e. Rs. 1150 with good volume can lead the price to go to 1030 and 1000 price point.
Note: This analysis is for Educational Purpose Only. Please invest after consulting a professional financial advisor.

Risk Reward 1 :5 ⦁ Only Trendlines Used — No Other Confluence
⦁ Stoploss Is Based on the Trendline
⦁ Retest of Trendline Builds Confidence
⦁ Trendline Angle Shows Momentum
⦁ Trendlines Define Risk Clearly

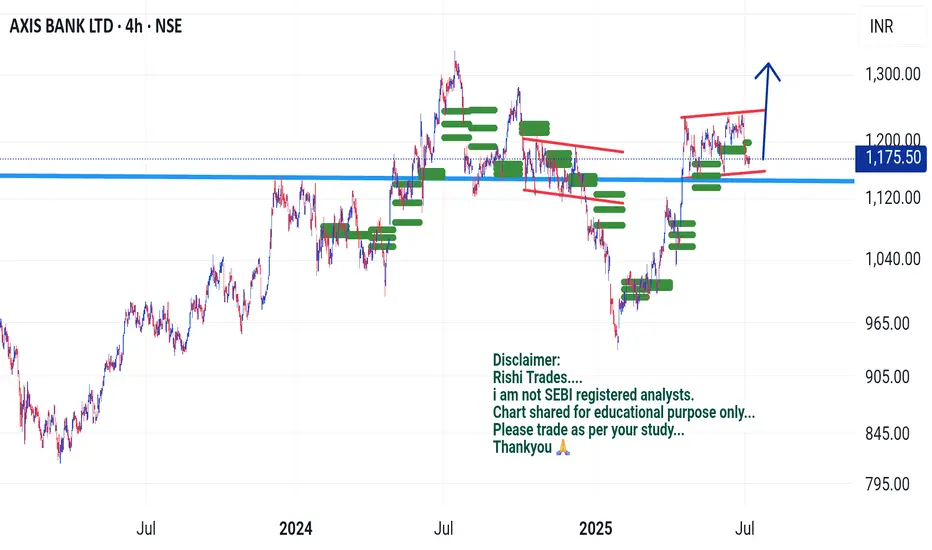
AxisBank... AxisBank... 4 hour chart... earlier falling monthly CPR and now at same zone rising CPR... expecting breakout ... #justforinfo...
Long Axis Bank - target 1500Axis bank is forming inverted head and shoulder pattern. If it continues to form this pattern
then following are the target
Target 1 - 1218
Target 2 - 1339
Target 3 - 1500
Medium term view

AXIS BANKAxis bank chart is showing consolidation going on. Closing above 1240 will be confirmation of breakout and one can expect target of 1340. Keep stop loss below 1190

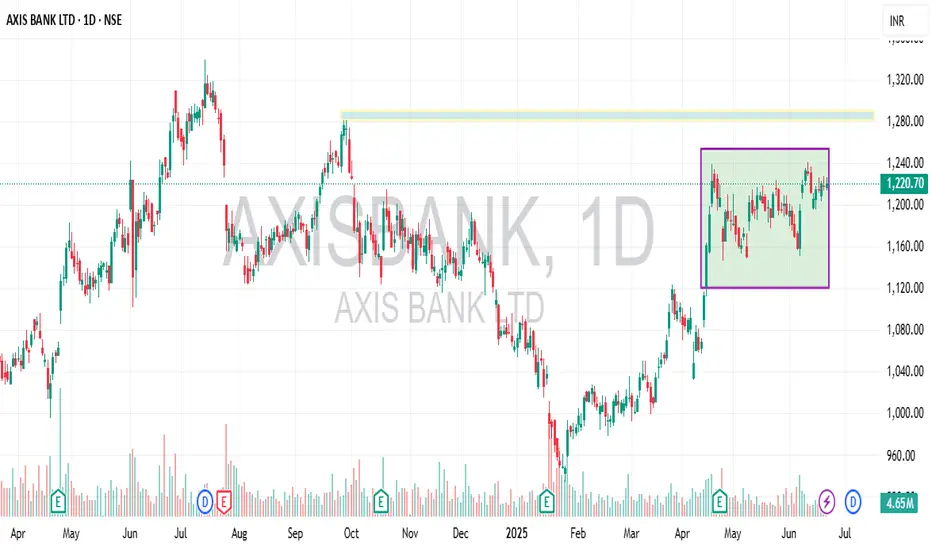
AXIS BANK🏦 AXIS BANK – Tight Consolidation Below Major Resistance | Breakout Watch 🚨
📅 Date: June 21, 2025
🕰️ Timeframe: Daily Chart
💸 CMP: ₹1,220.70 (+0.26%)
📊 Volume: 4.65M
📦 Price Action Overview:
🔲 Axis Bank has been consolidating in a tight rectangle pattern between ₹1,160 and ₹1,240 for nearly 7 weeks.
📌 Current price is approaching the upper end of the range, indicating a possible breakout setup.
🟡 There’s a strong historical resistance zone near ₹1,280–1,300 from October 2024 – if broken, this can open the gates for a new rally.
📈 Technical Levels:
Support Zone: ₹1,160 – ₹1,180
Resistance Zone: ₹1,240 (box top)
Major Resistance: ₹1,280 – ₹1,300
Breakout Target 1: ₹1,275
Breakout Target 2: ₹1,310+
🎯 Trade Plan:
✅ Entry: Buy above ₹1,242–1,245 (on daily close with volume confirmation)
🛑 Stop-loss: ₹1,180
🚀 Target 1: ₹1,275
🚀 Target 2: ₹1,310+
📊 Volume Insight:
Healthy volume near the upper range = accumulation in progress
Breakout candle with > average volume = confirmation trigger
✅ Conclusion:
Axis Bank is setting up a bullish continuation pattern after a sharp rally from ₹920. A breakout above ₹1,240 can attract fresh buying, aiming toward its previous resistance zone. Keep this stock on your breakout radar! 📡
🔖 #Hashtags for Visibility:
#AxisBank #BreakoutStocks #SwingTrading #NSEIndia #TechnicalAnalysis #RectanglePattern #BankingStocks #ChartPattern #PriceAction #TradingViewIndia #AatrishaCapital
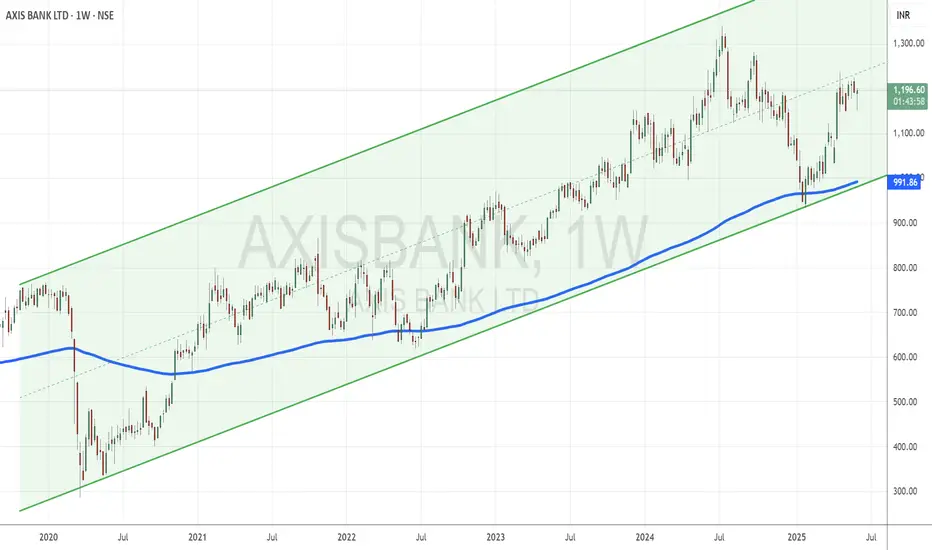
Axis Bank Climbs Steadily Within a Moderate UptrendTopic Statement:
Axis Bank is on a moderate bull run, advancing within a stable uptrending channel but with less momentum compared to its peers.
Key Points:
* The stock is moving upwards in a bullish uptrending channel, making channel trading straightforward
* It is trading close to its lifetime high, reflecting gradual strength
* Accumulating the stock near or below the 180-day EMA offers a favorable risk-reward setup
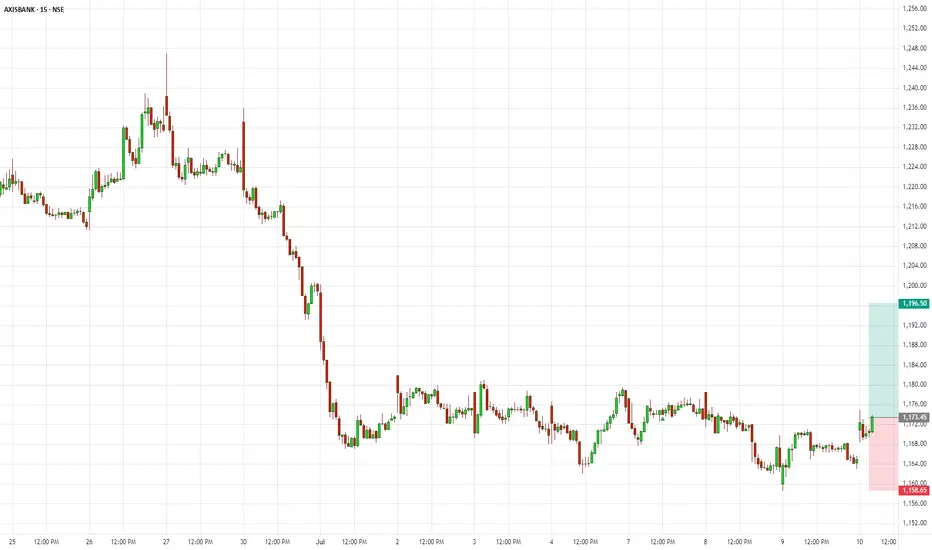
AXISBANKAXISBANK has been trading within a Channel Up since the Jan 27 bottom and last week it unfolded its latest technical Bearish Leg.
As the 2H RSI bottomed on the 30.00 oversold barrier and the 2H MACD formed a Bearish Cross.
waiting for break 1177,
Stop Loss Placement :
- Aggressive Stop: ₹1215 (below breakout level)
- Conservative Stop: ₹1201 (midpoint between support and breakout)
Exit Strategy :
- Target 1: ₹1148 (immediate Support)
- Target 2: ₹1125 ( Down Channel support level)

Axis Bank Research for longer time period
Bullish forcost with psychological level of 1000.
Expecting bullish movement till 1180-1250 .
We can entry near 1000 (990-980)
With the stop loss near 940-950 .

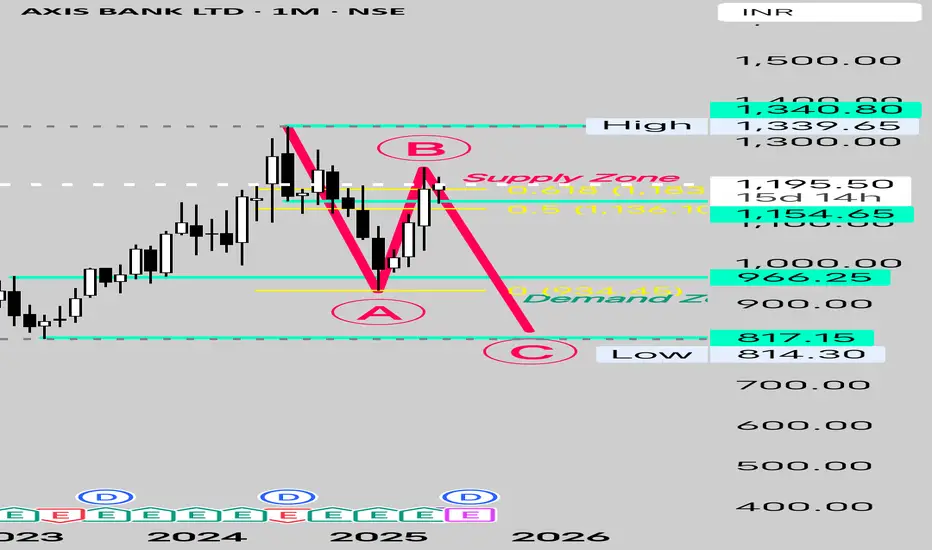
Axis Bank Ready for Next Down Leg Axis Bank is Trading in a Strong Supply Zone.
With disappointing Results and Technical Analysis Suggesting another Pending Wave C
In Months to Come we May retest The Demand Zone between 966 and 817 completing Wave C of The Elliot Wave Theory.
AXIS BANK LTDAXIS BANK LTD-1W.NSE
Vol
Good chart structure
After a big breakout in previous week, stock has shown a profit booking from higher levels
If it closes above 1185-1200 levels, then more up move is possible
Entry Above 1200
Target 1270/1340
Stop loss 1120

Axis Bank - Results seem off the axleAxis bank declared quarterly results today and they don't appear encouraging. The video tell the approach long term investors can take in this counter. Watch now.

The top is already madeAxis Bank CMP-1207
I think what everyone is interested is, in the extent of damage. So here comes the longer term charts.
Elliott - this rally to the 1200 odd levels is the 2nd wave of C. The 3rd wave is the most devastating. To me the 3rd with start from here.
Fibs -the 3rd wave is generally 1.618 of 1st wave. So combining fib extension on the left and fib retracement on the right, in my view this wave will come down minimum to 760/780.
RSI - Now look at the oscillator on two time frame. Both on the weekly and monthly charts the rally has halted in the bear zone.
Trendlines - the retest of the channel from below is an opportunity to exit.
Conclusion - Mkt generally uses events to further its cause. Since today is the quarterly result, no matter what the outcome of the result this stock will make an imp top today. So investors u will not get a better exit.

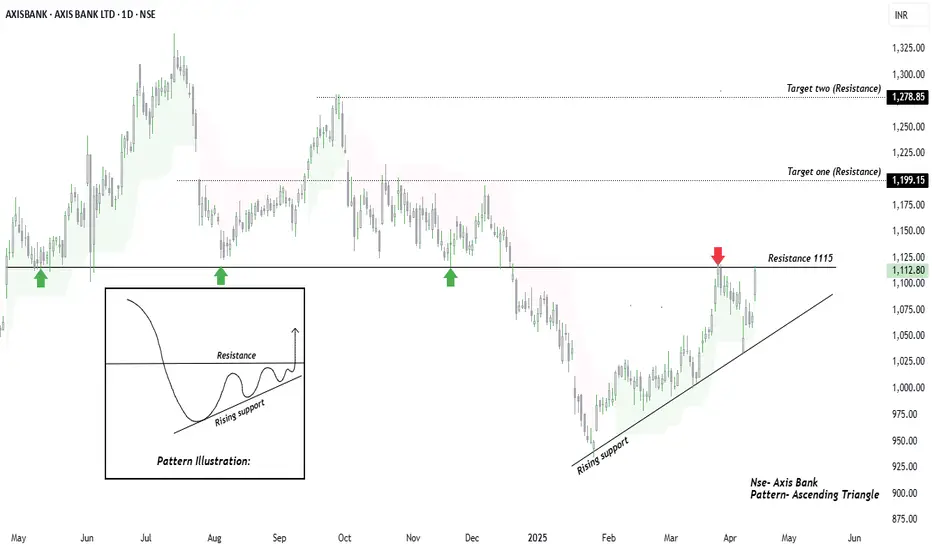
Triangle Tension: Axis at the EdgeHi friends! Sharing daily chart of Axis bank as we can see price is forming a classic Ascending triangle pattern on provided time farme a bullish setup that often signals accumulation before breakout and the price is pressing against a well established horizontal resistance which has historically acted as a strong support as marked by green arrows.
A decisive breakout above 1115 resistance backed by strong volume, could lead to a significant upward move toward marked targets. However if the price fails to break out we may see a retest of the rising trendline support.
This setup offers a clean structure for traders watching for a potential breakout or pullback entry. The pattern sketch in the chart serves as a visual reference for educational purposes.
Targets mentioned on provided chart and a good support can be consider a close below rising support line after breakout.
This idea is meant for only learning purpose.
Hope you like the publication, Thanks in advance.
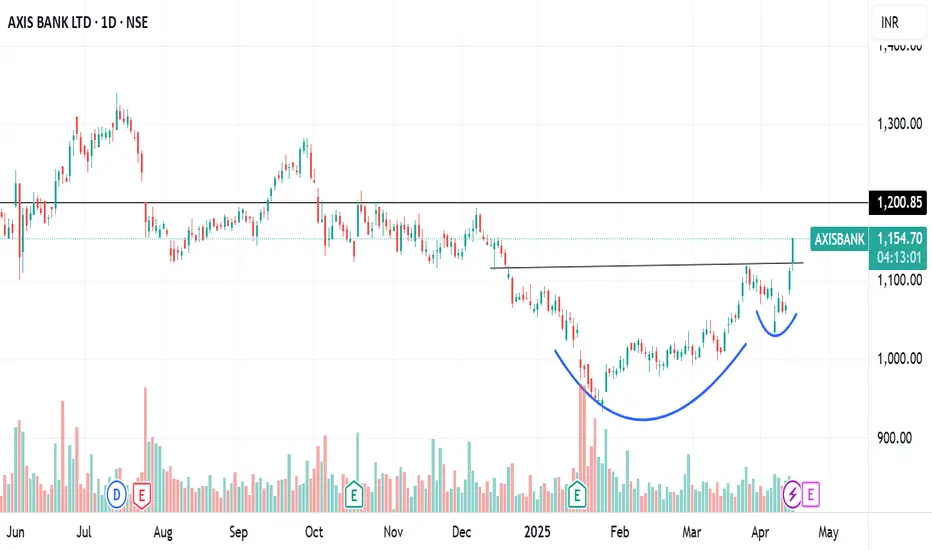
AXISBANK C&H BREAKOUTAxisbank breaking c&hpattern with good volume
macd croosover done,rsi bullish
trading above all imp key ema
breaking 1200 will give more upmove
NO BUY/SELL RECOMENDATION