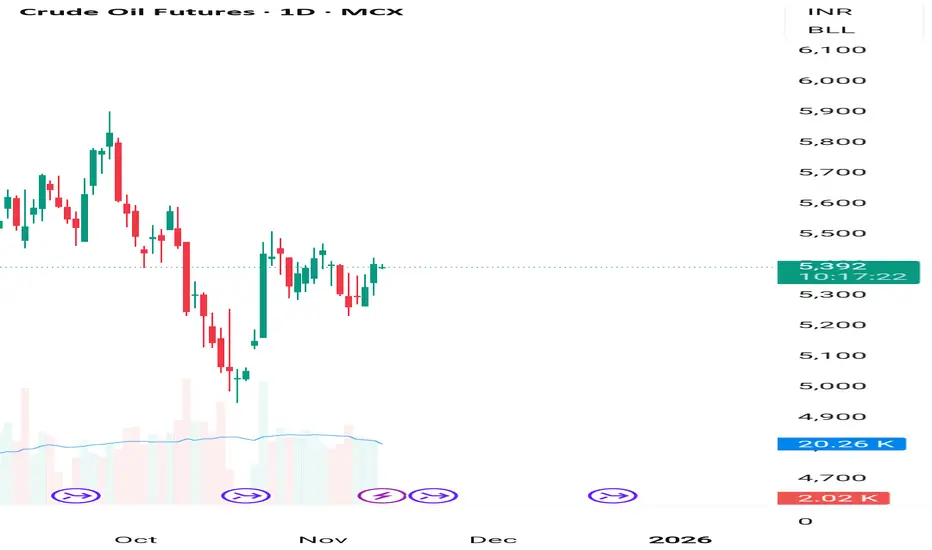
Crude buy 250-280 points range buy on low sell on high 🔑 Key Highlights
- Price Action: Crude trading at ₹5,343, holding above ₹5,300 support.
- Trend: Active Long Build‑Up confirmed.
- Supports: ₹5,300 / ₹5,250 / ₹5,200.
- Resistances: ₹5,380 / ₹5,420 / ₹5,480.
- Bias: Bullish continuation if above ₹5,300; corrective pullback risk below ₹5,250.
Related commodities

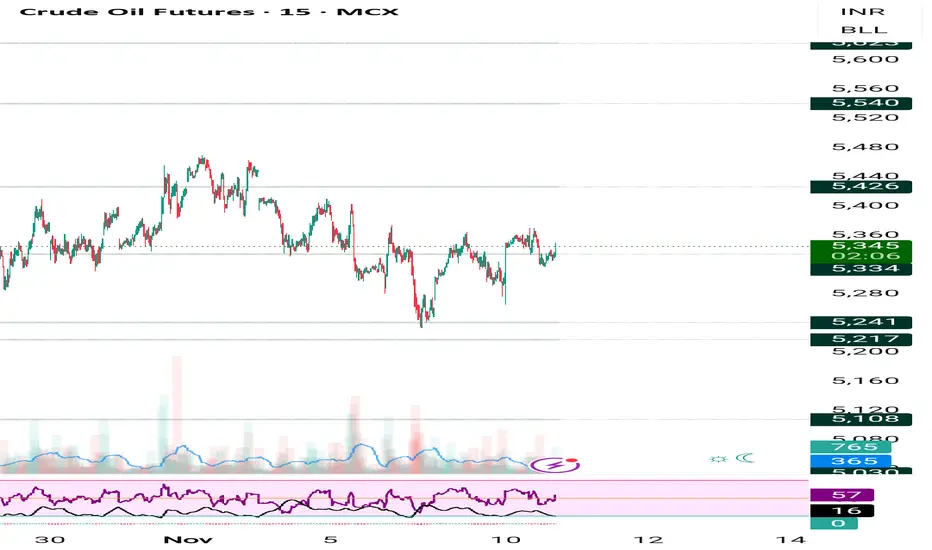
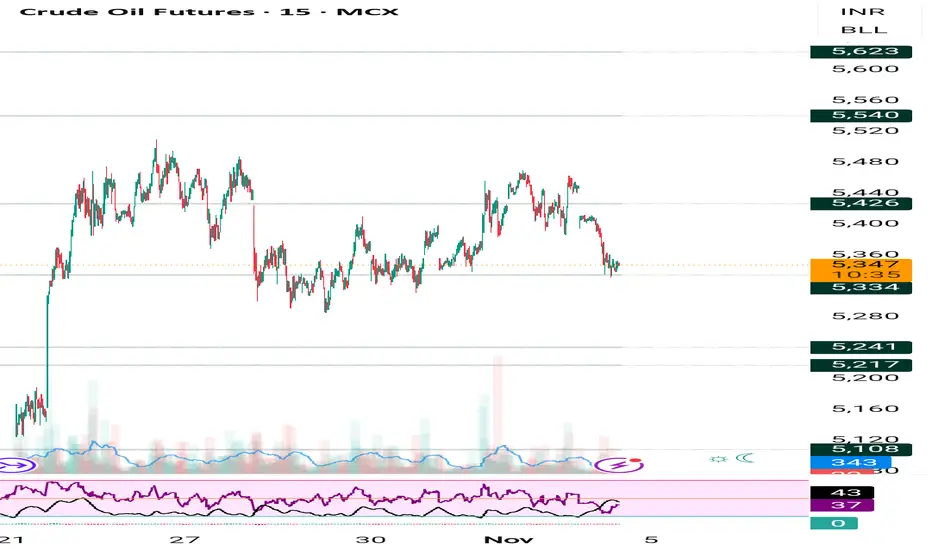
Crude oil AI tool showing unmove will continue until 5300 break 🔑 Key Highlights
- Price Action: Crude is holding firm above ₹5,350, showing renewed bullish momentum.
- Trend: Long Build‑Up (Price↑ + OI↑), indicating fresh long positions.
- Supports: ₹5,350 / ₹5,300 / ₹5,250.
- Resistances: ₹5,420 / ₹5,480 / ₹5,550.
- Bias: Bullish continuation if ₹5,350
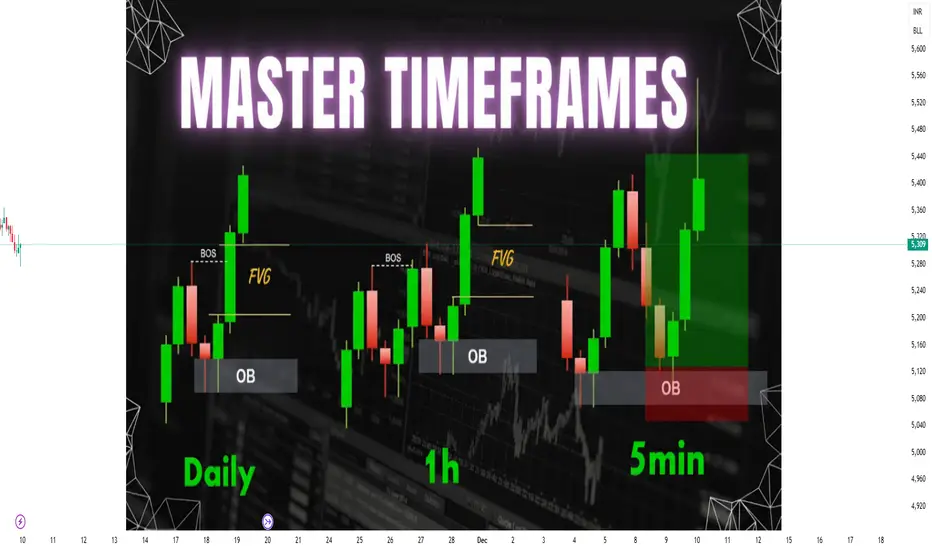
Multi-Timeframe Analysis (Intraday, Swing, Positional)1. Understanding Multi-Timeframe Analysis
Multi-Timeframe Analysis refers to the process of observing the same security across different timeframes to identify trend alignment, potential reversal zones, and optimal trading opportunities. Every timeframe provides unique insights:
Higher Timeframe:
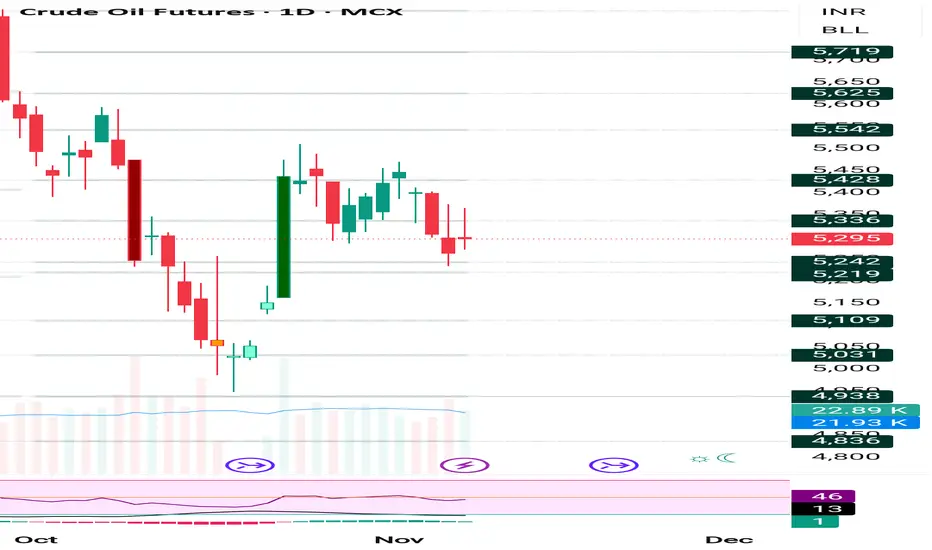
Now we are holding buy trade @5280 , target 5410,5490,5560🔑 Key Highlights (Locked Permanently)
- Supports/Resistances: 5250 is the critical support; breach flips bias.
- Indicators: ADX >25, RSI 63, PCR 0.91 — all thresholds confirmed.
- Liquidity: Turnover ₹12,400 Cr, VWAP 5345 — strong institutional activity.
- Volatility: IV 16.2%, RV 14.5% — bot
Crude start buying on dip 5250-5200 buying area levels on chart Crude start buying on dip 5250 to 5200 buying area , levels given on chart
How My Harmonic pattern projection Indicator work is explained below :
Recent High or Low :
D-0% is our recent low or high
Profit booking zone ( Early / Risky entry) : D 13.2% -D 16.1 % is
range if break them profi
WTI crude getting ready for 67$It has been a while preparing for this and the lower Bollinger band has moved up to 58.58 in the meantime as immediate support. The indication remains that wave c higher will unfold. I cannot determine right away if this is wave c or iii and that we can conclude later but one leg higher first is wha

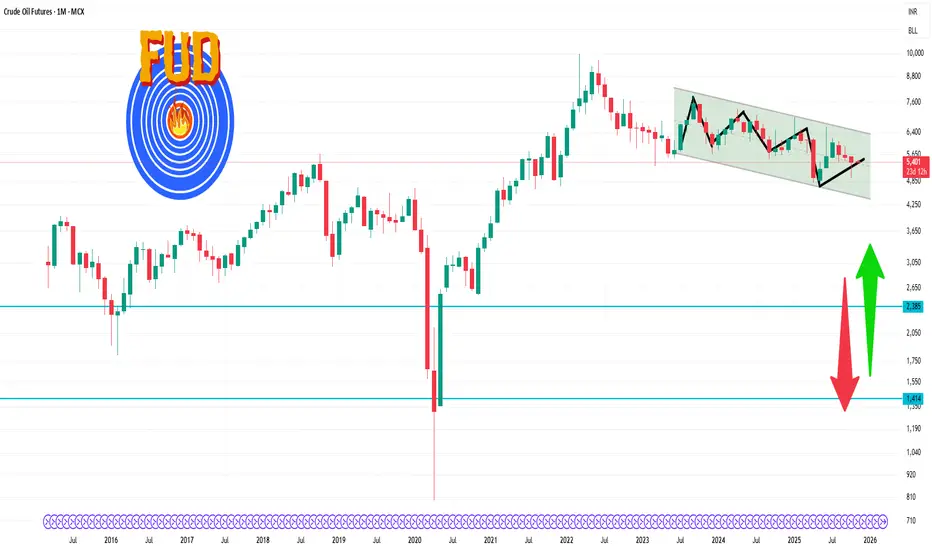
Crude Oil Futures 1 Month Time Frame 🔍 Current Price
Last quoted: ~ ₹ 5,422 per barrel.
Recent 1-month high: ~ ₹ 5,903
Recent 1-month low: ~ ₹ 4,944
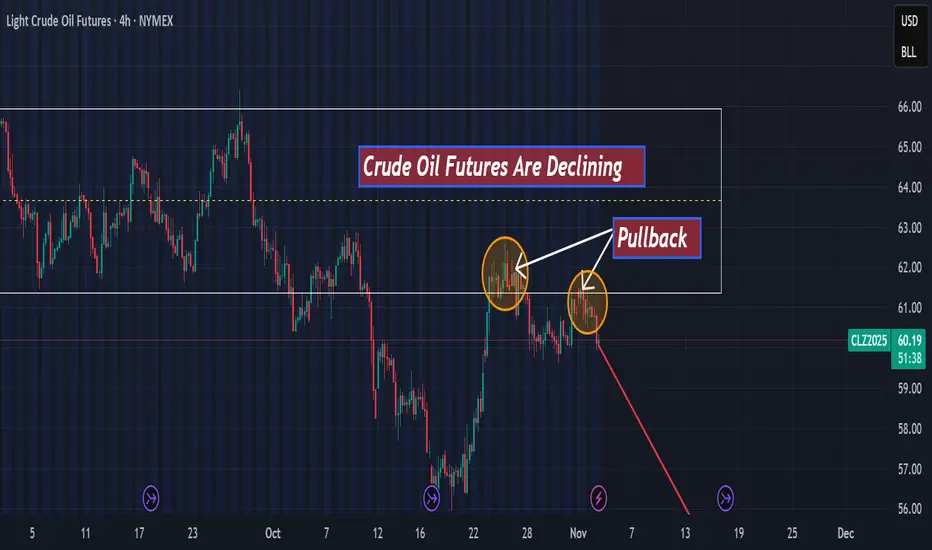
Light Cude Oil Futures are declining hello,
According to my technical analysis, there is a high probability of a decline toward $55 in the next few days for two main reasons:
-A first Pullback on the support level.
-A second pullback retesting that support.
Crude 5230-5200 fall again possible sell on rise Crude sell on rise 5230-5200 will come
How My Harmonic pattern projection Indicator work is explained below :
Recent High or Low :
D-0% is our recent low or high
Profit booking zone ( Early / Risky entry) : D 13.2% -D 16.1 % is
range if break them profit booking start on uptrend or downtr
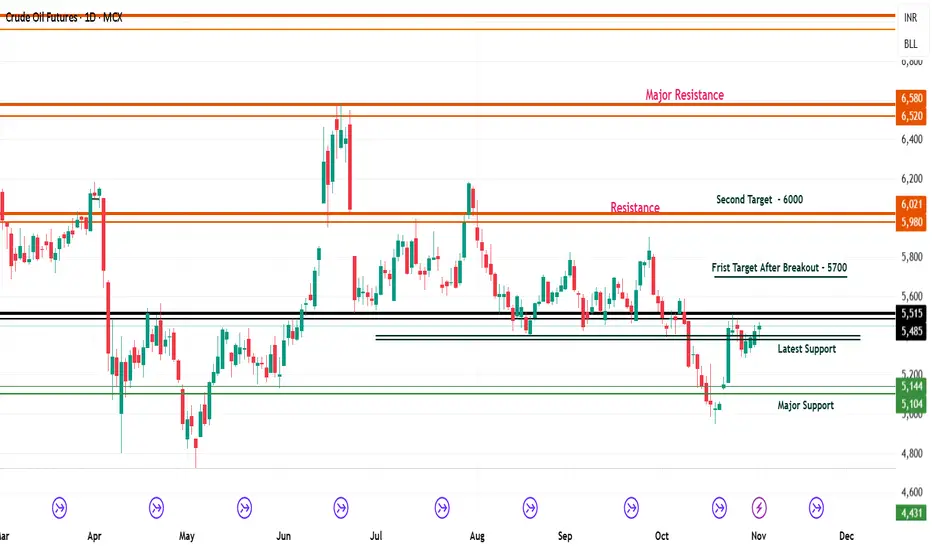
Crude Oil Futures Technical Analysis with TargetsCrude Oil Futures (MCX) Technical Analysis – Key Levels and Price Outlook
(November 2025 Update)
- Crude oil prices have shown some recovery this week after a continuous downtrend seen in October.
- The market is now trying to build a base above ₹5,10
See all ideas
Displays a symbol's price movements over previous years to identify recurring trends.