S&P on verge on fall. Change on short term trendS&P after a 3% fall recovered and is consolidating.
We can expect a fall to 6300, as upside level of 6800 is rejected.
Short at 6640. Keep SL of 6800
Expect 6300.
Trade ideas
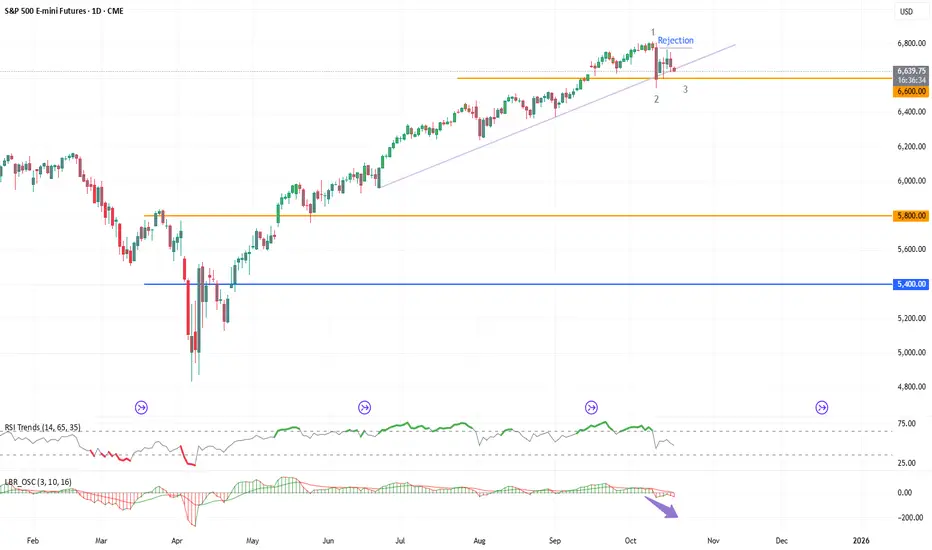
S&P 500 rally is ripe now. Can fall to 6600 first and then 6400S&P rally is ripe for a fall now.
low volume in upside.
+
extended run from liberation day
= is perfect combo for a lower level in S&P 500.
We have seen Rsi and linda Raschke's momentum indication in divergence to the rally in index.
Cummulative all technical indicator like trend line break + divergence in RSI, we may see S&P at 6600 in near term and next fall to 6400.
Stop loss for the short idea and be around 6900.

ES1- Reversal After Extended SelloffPrice has experienced a clean, directional drop with consistent Sell signals and EMA slope confirmation.
Current Buy signal has appeared near potential support, offering a short-term reversal watch.
EMAs still show downward pressure, so caution is warranted until breakout confirmation occurs.
🔍 Educational Setup Observation:
Observed Entry Zone: Near 6,408.00
Stop Level: Below 6,399.25 (below structural low)
Potential Target Area: 6,442.75 — prior imbalance and reaction zone
🧠 SignalPro Highlights:
This is the first Buy signal after a strong sell sequence — often used as a potential momentum shift marker.
Short-term reversal setups like this often require clear candle confirmation above moving averages to validate direction.
⚠️ This chart and setup is for educational purposes only. It is not financial advice. Always conduct your own due diligence and apply proper risk management.

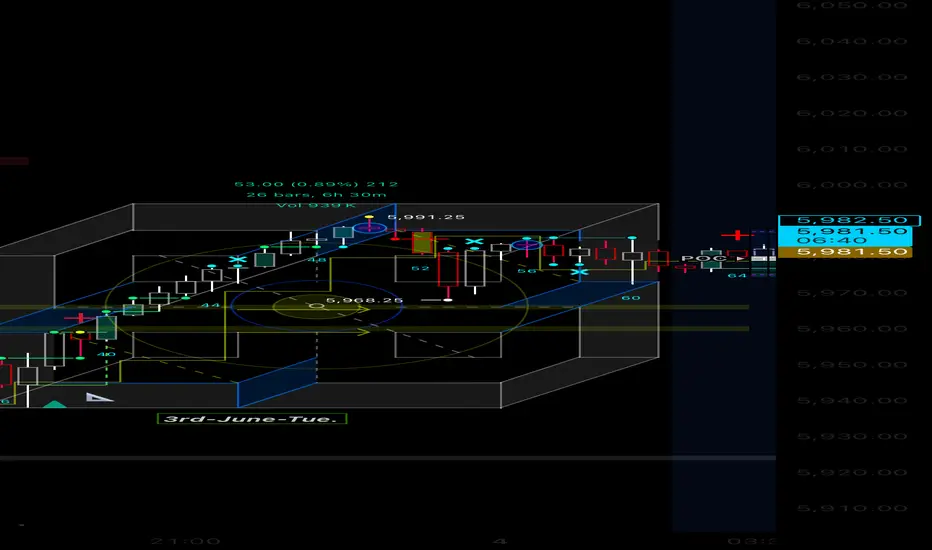
New tool for market structure and forecastingThis tool has Notting to do with trading
However it’s got everything to do with
Advancing your knowledge about price time grid system .
Presented by
Grid-_-Work’s.
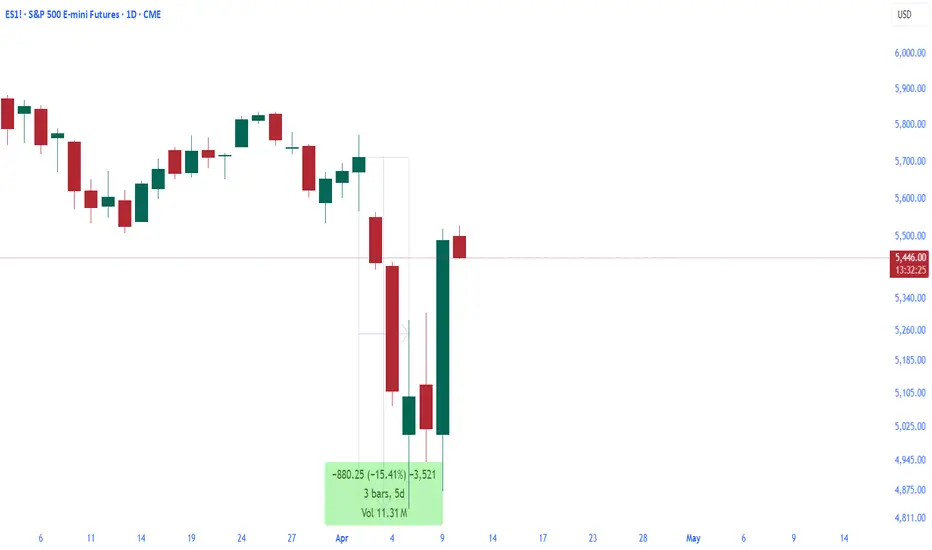
Tariffs and a Wild S&P 500 Ride: A Trader’s View on the ChaosA Horrible 8 Days for Traders:
The last 8 days have been a nightmare for traders and investors. Portfolios crashed hard, battered by uncertainty in the market—all thanks to tariff news from a U.S. leader with a business background and his ultra-wealthy advisor. The S&P 500 took a wild ride, and I’ve tracked every twist from the trading floor.
The Tariff Shock Hits
It started on April 2, 2025, when reciprocal tariffs were announced—taxes to counter other countries’ levies on U.S. goods. The S&P 500 closed that day as our benchmark. Here’s how it unfolded:
April 3: The index opened lower and closed nearly 5% down—a harsh kickoff.
April 4: It dropped another 6%, as tariff fears sank in deeper.
A Rumor Sparks Hope, Then Fades
On April 7, a rumor of a 90-day tariff pause emerged. The reaction was swift:
April 7: The S&P 500 surged around 6% intraday, giving us a glimmer of hope.
After few minutes: The White House dismissed it—no pause was coming. The gains vanished.
From its April 2 close to the April 7 low, the S&P 500 had plunged -15%. It was a dark stretch, with losses piling up fast.
The Pause Brings Relief
On April 9, the tide turned. After hints that the advisor told the leader between April 7 - 8, “These tariffs need rethinking,” they confirmed a 90-day pause on most tariffs, though one country faced steeper rates. The market responded:
April 9: The S&P 500 soared nearly 10%—a lifeline for battered portfolios.
Same Day Bonus: The company tied to the advisor leaped 22%, a standout gain.
Uncertainty or Intentional Moves?
Here’s the big question: Is this uncertainty, then sudden certainty, intentional? The tariff news threw markets into chaos, only for the pause to spark a swift rebound. In these moments:
Technical and fundamental analysis failed—charts and earnings reports were useless.
Trades hinged on headlines alone, a pattern I’ve seen before with major news.
Many technical analysts avoid trading when big events loom, and this shows why.
Could it be manipulation? The S&P 500 crashed 15% by April 7’s low, lifted 6% on a rumor, then soared 10% on the pause—while the advisor’s company hit 22%. Did someone foresee these swings?
Clues in the Chaos
There’s more to ponder:
Analysts warned tariffs could cut S&P 500 earnings by 5%, yet the policy rolled out—until this pause.
That 22% company surge on April 9 aligns perfectly with the market’s 10% rise.
When business-savvy leaders steer policy, their moves ripple through the market. Were these shifts too perfect for those in the know?
What’s Next After 90 Days?
What happens when the pause ends? Will the market fall again? It’s already reacted with that 10% jump on April 9, and markets don’t always repeat the same dance. Without a new shock, nothing big might happen after 90 days—but that’s a question for the next headline.
A Lesson for Traders
This tariff drama proves how policy can sway the S&P 500 like a pendulum. From an 15% plunge to a 10% rally, traders felt the pain but some may have gained far more. Stay alert: when leaders with business know-how call the shots, the market listens, and we’re left wondering who’s really in control.
ES Monthly chart - how to time the marketBackground:
-I look for trends in everything, PA and indicators
-Monthly charts are very helpful for timing long term investments
-momentum matters; RSI is the only true leading indicator that I have found
What's on this chart:
-macd
-PA
-rsi
-bottoming volume bars
What can be learned from this chart:
-key market declines have occurred when the M rsi returns downward from an overbought range
-key market upswings are usually more V shaped on the M candles (shorter timeframes show more rounded base)
-approx dates placed where the M rsi showed a top/bottom
-macd useful for confirmation of market movement

ES1 Support and Resistance For the E-mini S&P 500 Futures (ES1!) on a 1-hour timeframe, here are the key support and resistance levels:
Support Levels: 4,100, 4,050, 4,000
Resistance Levels: 4,150, 4,200, 4,250

Are we ready for retracement of S&P E-mini about 25%?
Based on Fibonacci retracement 1st level at 4950
CCI indicator shows divergence at the peak of recent bullish up trend

ES - Inventory Analysis & Trade Plan - 13 August 2024Hello and i hope everyone is doing well. In today's video i want to cover how the inventory developed yesterday and what are the auction paths that i am watching to trade ES today.
Current levels to observe the reaction of price: 5356 & 5383
Current Inventory is developing above PDC and have an excess - so the inventory is long but developing in PDR, so looking for more chop
Rejection seen at 5367.25 and supply shutting off at that price point
The structure of ON auction is balanced profile and looking for more rotational development today
Break of PDH or PDC are important references and i will be observing for continuation, lack of continuation will lead to reversal towards the VPOC
Also from the volume footprint - seeing supply above 5400 and supply shutting off below 5367
Disclaimer:- Please always do your own analysis or consult with your financial advisor before taking any kind of trades.
Dear traders, do not forget to hit like and follow me, and please do share your thoughts in below comment box, as your response will help me strengthen my market understanding.
Thank you.

Volume supports are the best. F your MACDES Supports playing out nicely.
The supports I plotted based on high volume candles,
have proven to reveal future demand zones.
MACD and RSI won't help you
anymore. Once you stick to VPA, news, politics, war, it's all just noise
We didn't die from nukes during the afghan war, we didn't die after
Ukraine, not after isreal, and currently as I type this - USA still is alive and un-nuked, so the news, your emotions are completely irrelevant.
NFA - be a mindful trader, not a headless chicken. Stick to data and numbers. Trading is an art, not a science

EMINI FUTURES UPDATE 04/02/2024.. What goes Up and comes Down...EMINI FUTURES UPDATE 04/02/2024. Observe the hourly candle of 02 Feb 2024 01:30 IST is What goes UP. Next to observe is the hourly candle of 02 Feb 2024 18:30 IST is What coes Down. See the move from one cluster zone to another cluster zone. Also observe to 50% move therafter to an All Time High at 03 Feb 2024 01:30. IST Timing of 01:30 slot is uncanny here...Level to watch here is 4963.50 for further clues....
Happy Trading !!!

S&P500 EMINI FUTURES HOURLY GANN CHART AT 07:12 IST...E-Mini Futures have made high at a sweet and sensitive vibration point at 4963.75 at 2:30 on 02 Feb 2024. The previous cluster zone hurdle seen between 24 Jan 2024 at 22:30 IST to 26 jan 2024 at 22:30 IST. We got a breakout at 30 Jan 2024 1:30 IST. Thereafter till 31 Jan 2024 1:30 IST we were resisted near 4963.50 but could not cross it. High Today is 4963.75 just 25 cents above it and we are forming inside bars with small bodies within the breakout candle range of $4.75 range. A short here will provide a good trade with risk reward ratio of 1:5 as per your risk profile. Levelto shrt will be 4957.25 at 07:23 IST.
N.B. Not an trading Advice. With usual disclaimers as pplicable within the reach of this beautiful Trading Analysis Platform.

Refer to 2018Please watch the material posted on Youtube from the Foundation for The Study of Cycles. The key phrases you are looking for are Cycles of Repetitive action and best fit.


Break down of ES1!It is looking like a breakdown is about to happen. Lets see, this is the correction we need in the market.

#ES 🟢 M15. Buy. (#SP500)
A false breakdown has formed at the lower boundary of the H1 range.
Accumulation-Impulse-Reverse Impulse-Accumulation. (Reversal design)
Medium term deal.
activation: 4427 (on the test of the second accumulation)
stop: 4407
tp-1: 4446
tp-2: 4485

S&P futures BearishS&P futures given break out from rising channel below 3900 it may test 3800 to 3600 this month.


S&P Levels for MondayS&P levels for monday
Go long above 4060 Target till 4080.
Go Short below 4040 Target till 4020.
This is my view and eduational purpose only ,trade with price action and at support and resistance levels.

Trade From a Volume Imbalance Trade From a Volume Imbalance --------------------------------------------------------------------------------------

S&P E-MINI AnalysisInstrument coming below 200sma after making a top and smoothly sliding down in a downtrending channel taking support at fibonacci of .786 and .618 respectively in the previous lower high formation, looking to take resistance of .5, this time before getting back into the channel first to the mid of the channel AND second to the lower end of the channel, Its a positional trade always do your analysis before entering into the trade with proper risk and money management
