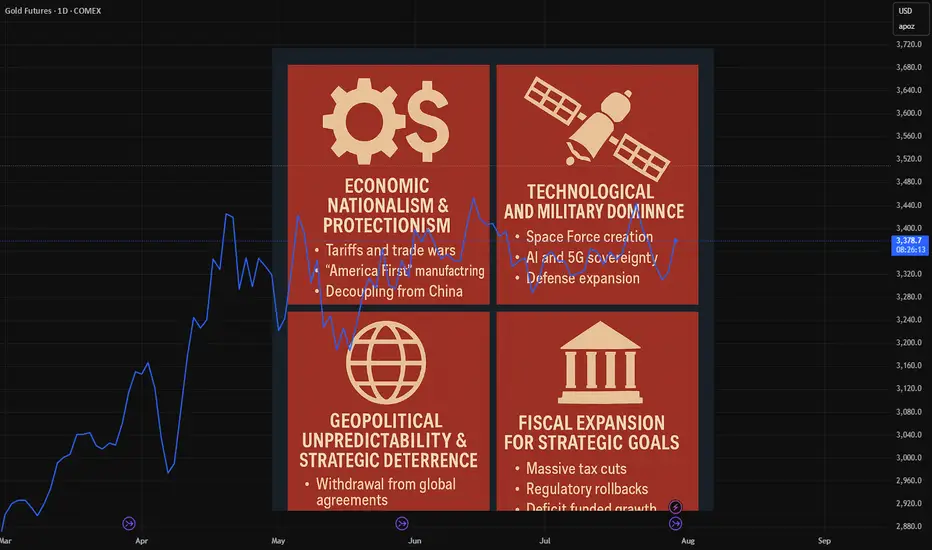
Trump's broad policies to secure America's hegemony.Hello trader and an investor,
Here, I am telling you about Trump's extensive policies that will secure America's dominance, but only in brief format. See below.
1. Unresolved Issues:
* Economic overheating impact on US Hegemony.
* Expansionary Fiscal policy sustained accumulation of Debt Burden.
* Instability of Dollar & US Treasuries status , rising Threat from China.
2. policy Responses:
* Fiscal policy: Tax cuts to stimulate economic growth and Expanded national defense spending.
* Monetary policy: Rate cuts, End of balance sheet reduction.
* Trade & External policy: Tariff revenue, Fiscal subsidies.
* Regulatory Measures: stabilize banking sector and maintain US Treasury market loosen Supplementary Leverage Ratio (SLR).
* Technological competition: Promote AI and infrastructure development, Revitalize nuclear energy.
3. Legislation & Government Actions:
* One Big Beautiful Bill Act.
* Nomination of new Fed chair.
* Reciprocal tariffs & industrial tariffs.
* GENIUS CLARITY.
* AI initiative & nuclear revival plan.
4. Beneficiary sectors:
* AI , Semiconductors, Defense.
* Broad- based ( Tech, Agriculture, Manufacturing).
* Blockchain & key technologies.
* AI, Nuclear Energy
GD1! trade ideas
Gold mcx sell on rise continue 99800 if downside levels on chartGold mcx we are holding sell trade active below 99800, downside levels mentioned on chart check comex levels if break 3355 then upmove possible , downside levels given on gold mcx chart

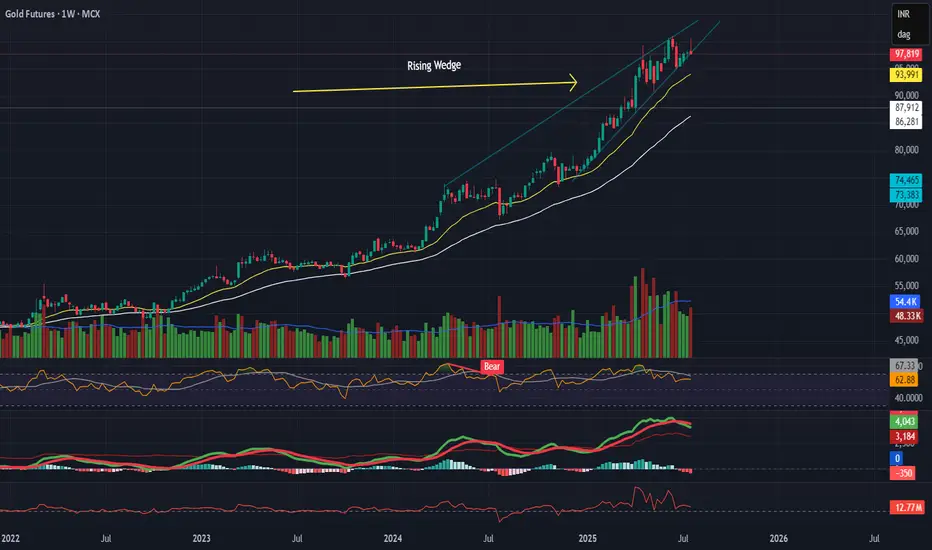
Gold Breaking Down – Rising Channel + Wedge Breakdown
Gold Breaking Down – Rising Channel + Wedge Breakdown
Description:
Gold has broken down from a rising channel on the daily timeframe and a rising wedge on the weekly, signaling a possible intermediate correction.
Key Observations:
- Momentum divergence on RSI, MACD, EFI
- Bearish volume supporting the move
- Price now below 20 EMA, approaching 50 EMA
- Weekly wedge failure after a secondary test of highs
Macro Drivers:
- Lower inflation
- Stable USD
- Dovish Fed stance
- Middle East tension cooled
- Gold appears overpriced on relative terms
Trade Setup:
🔻 Breakdown: ₹97,500
🎯 Targets: ₹92,000 → ₹87,000
🛑 Stoploss: ₹1,00,560 (near ATR and resistance)
🧠 Bearish bias short-term unless macro changes again.
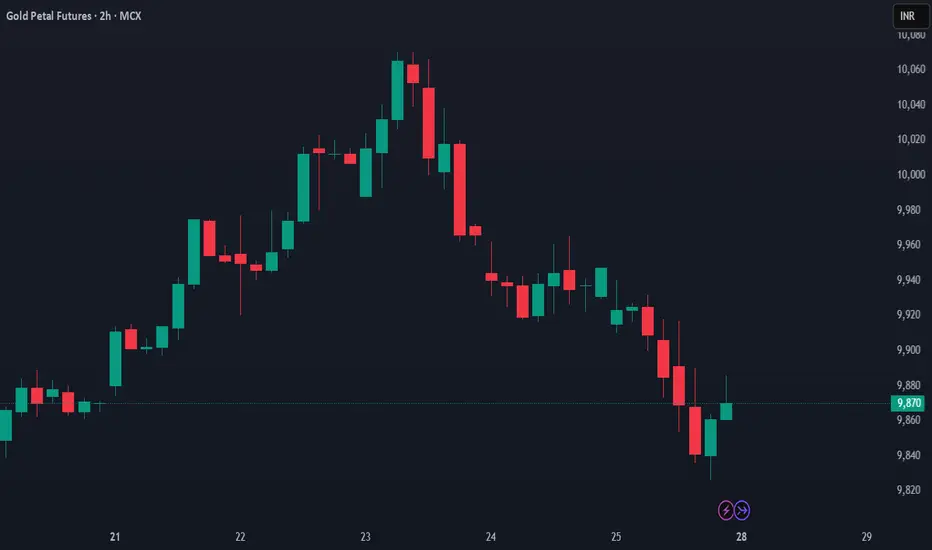
GOLD PETAL near consolidation taking a support at 9840Bulls may attempt a recovery if support near ₹9840 holds and the price builds above ₹9920.
However, continued weakness below ₹9840 could drag it toward ₹9720–9680 levels.
Volume will be key to confirming any breakout or breakdown.
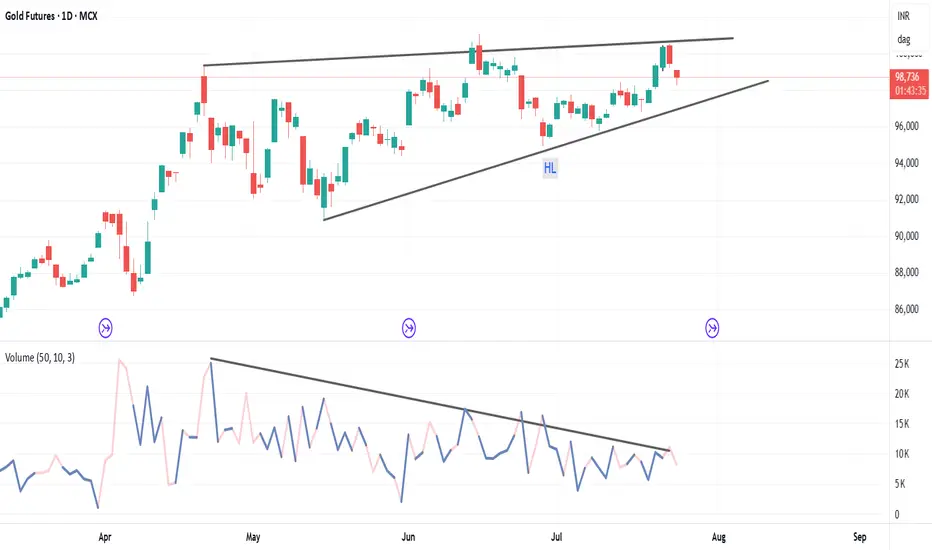
Gold ready for breakout ?Gold 98665 is giving an ascending triangle. Volume decrease with pattern formation suggests sellers are exhausting. 97320 is support and 83% possibilities for a breakout to 1,07,000 .
GOLDHello & welcome to this analysis
In 4hrs time frame GOLD (MCX) has activated a bearish Harmonic Bat pattern.
It could retrace down to 99500 - 98500, will consider 100750 as stop loss for this set up.
Do keep in mind, GOLD overall is very strong and this could likely be a shallow retracement.
Regards

MCX GOLD GUINEA Bullish but cautious near resistancePrice has broken out and is now retesting the key ₹80,500 zone. A successful hold here could confirm support and trigger fresh upside. However, if the market shows weakness and closes below ₹80,500, a retracement could follow. Watch the next 1–2 candles for confirmation.
Bullish but cautious near resistance.

MCX GOLDGUINEA AUG FUT strong Bullish rallyThe current price at ₹80,420 reflects a strong rally with higher highs and higher lows, breaking above the previous resistance zone near ₹80,000.
There is momentum continuation visible with wide-range bullish candles and minimal retracements, suggesting aggressive demand.
The price is now testing a previous supply zone around ₹80,400–₹80,500, and a clean breakout above this could push it toward fresh highs. However, minor pullbacks or consolidation are possible if this level acts as resistance in the short term.
Bullish trend resumption confirmed with a volume-backed breakout; ₹80,000 now acts as support, and momentum remains intact unless rejected from the ₹80,500–₹80,800 zone.
Finally Hope you Enjoying the Bullish Ride,
STAY TIGHT , This is just a Beginning, In coming months , GOLD SETS A NEW MAJOR RECORD

Gold buy above only 98200 if sustain upside limited sell on riseHow My Harmonic pattern projection Indicator work is explained below :
Recent High or Low :
D-0% is our recent low or high
Profit booking zone: D13% -D15% is
range if break them profit booking start on uptrend or downtrend but only profit booking, trend not changed
SL reversal zone : SL 23% and SL 25% is reversal zone if break then trend reverse and we can take reverse trade
Target : T1, T2, T3, T4 and .
Are our Target zone

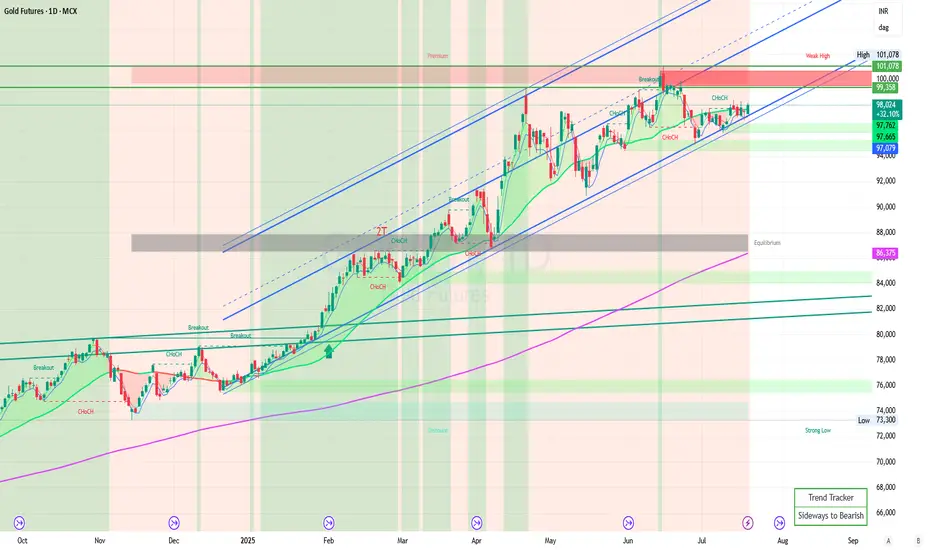
Gold Daily Trend with Ascending Channel
MCX:GOLD1!
A gold daily time frame chart with an ascending channel is a technical analysis setup that shows the price movement of gold over a daily period, forming a pattern known as an ascending channel.
Key Features of an Ascending Channel:
- Trendline Connection: The channel is created by drawing two parallel trendlines:
- Lower Support Line: Connects the series of higher lows.
- Upper Resistance Line: Connects the series of higher highs.
- Price Action: The price of gold is moving upward within these two lines, bouncing between support and resistance.
- Trend Indication: Indicates a bullish trend, suggesting that the price is gradually increasing over time.
**Interpreting the Chart:
- Bullish Signal: As long as the price remains within the channel, the upward trend is considered intact.
- Trade Opportunities:
- Buy near support: When the price approaches the lower trendline.
- Sell near resistance: When the price nears the upper trendline.
- Breakouts:
- A move above the upper resistance line may signal strong bullish momentum.
- A break below the support line could indicate a trend reversal or correction.
Practical Use:
- Traders look for buying opportunities at the channel's support and be cautious if the price breaks out of the channel.
- Confirming other indicators or volume analysis can strengthen trading decisions.
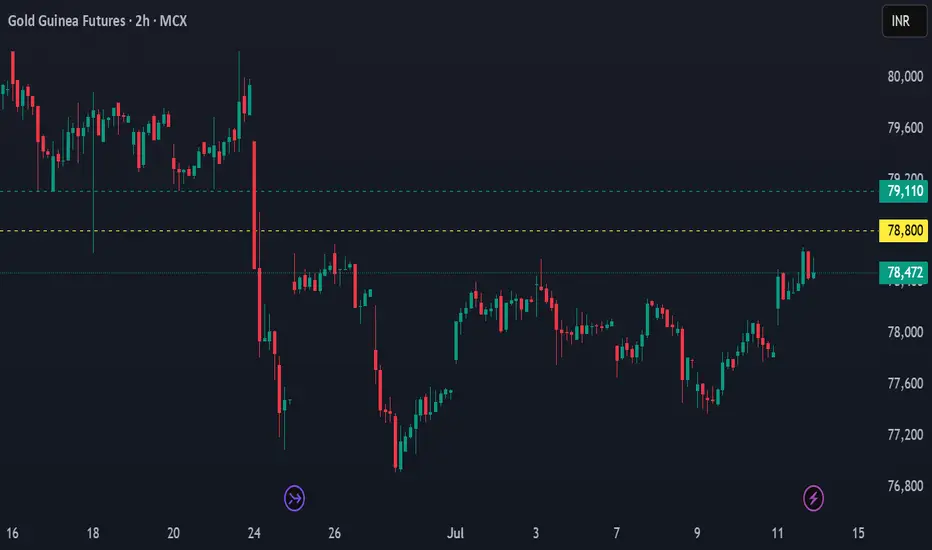
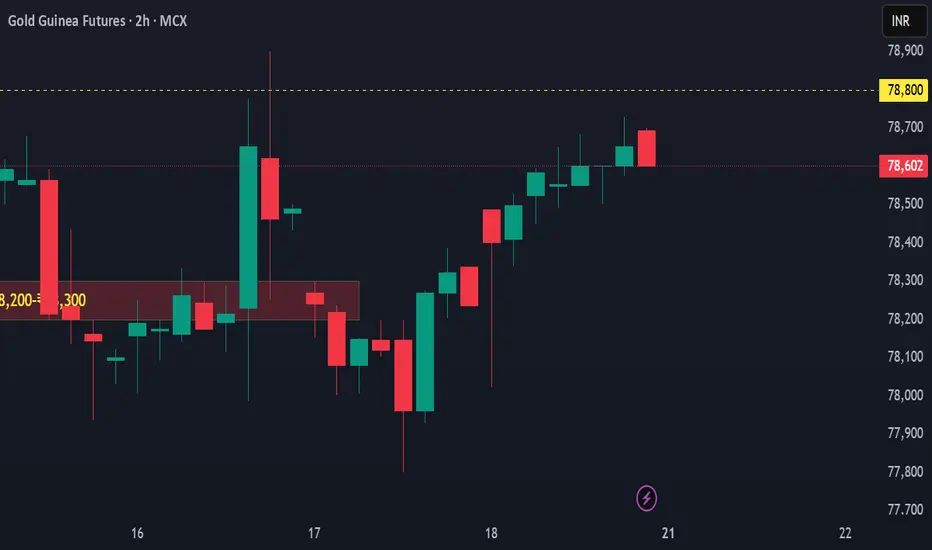
GOLD Guinea Awaiting a Breakout at 78800A confirmed breakout above 78800 with strong bullish candles and volume support may open the path toward 79500–80000, the next historical resistance zone. Conversely, repeated rejection near 78750 could result in another pullback to the 78000 zone, or even a retest of 77500 support, maintaining the range. Overall, the market structure is neutral-bullish, but momentum confirmation is key—without a clean breakout, this remains a sideways market in a coiling phase. Traders should stay alert for a breakout or breakdown and manage risk tightly in this range-bound volatility.
Support My Analysis
By Following and Boosting my Ideas
I only Follow GOLD
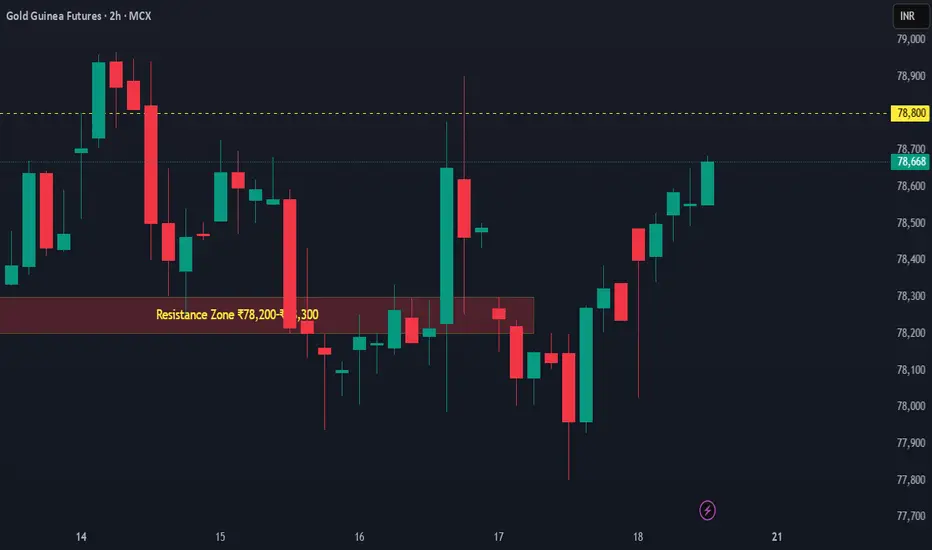
GOLD GUINEA 78750 zone acting as the trigger level - BreakoutThis current move exhibits stronger bullish conviction compared to earlier rallies, as shown by consecutive long-bodied green candles and reduced upper wicks, indicating follow-through rather than rejection.
The immediate resistance lies around 78750, a level that has repeatedly capped upward momentum throughout July.
A successful breakout and sustained close above this level would likely confirm the end of the consolidation phase and initiate a fresh leg up toward 79500–80000, a previous supply zone.
On the contrary, a rejection here could mean another pullback toward the 78200–78000 zone, keeping the range structure alive.
Given the rising sequence of higher lows, improving structure, and building momentum, the chart now leans toward a bullish breakout bias, with the 78750 zone acting as the trigger level for a potential rally continuation.
Good sold at 97750 today booked at 96860 , sell riseHow My Harmonic pattern projection Indicator work is explained below :
Recent High or Low :
D-0% is our recent low or high
Profit booking zone: D13% -D15% is
range if break them profit booking start on uptrend or downtrend but only profit booking, trend not changed
SL reversal zone : SL 23% and SL 25% is reversal zone if break then trend reverse and we can take reverse trade
Target : T1, T2, T3, T4 and .
Are our Target zone

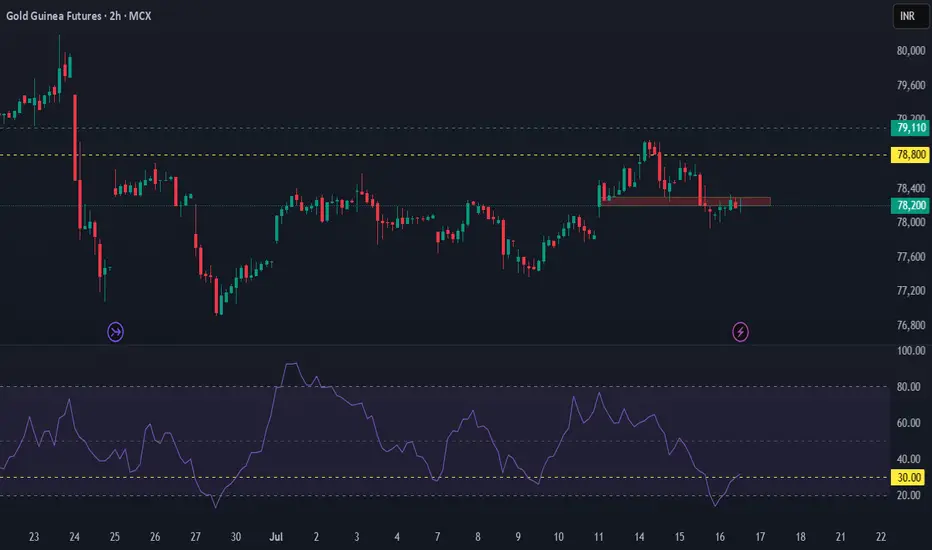
GOLD remains neutral to mildly bearish unless a breakout occursCurrently, the price is hovering around 78213, which is the midpoint of the range, reflecting market indecision and the absence of a strong directional bias.
The lack of follow-through on bullish moves and frequent wicks on both ends suggest possible liquidity traps or false breakouts. Short-term bias remains neutral to mildly bearish unless a breakout occurs.
A bullish breakout above 79000 with strong volume could retest the 80200–80500 resistance zone, while a breakdown below 77000 may lead to further downside toward 76500 or 75800.
Traders may consider range-trading strategies while keeping alerts for potential breakout or breakdown setups with tight stop-losses due to the choppy structure and fading momentum.
GOLD Breakdown at the Barrier: Bears Regain Grip Below ₹78,800GOLD has once again faced a strong rejection at the ₹78,800 resistance, triggering a sharp decline to ₹77,899 and breaking the recent higher low structure. Despite multiple attempts, the price failed to close above this key supply zone, signalling active seller presence. The short-term trend has turned neutral-to-bearish, with immediate support at ₹77,500 and deeper downside potential toward ₹76,700 if this level fails. Resistance remains firm at ₹78,800, ₹79,500, and ₹80,000. Unless bulls reclaim ₹78,800, sellers are likely to dominate, reinforcing a cautious to bearish outlook.
OK.....
No problem ,
Lets Wait
How Bears ACT
But ULTIMATELY BULLS WIN !!!

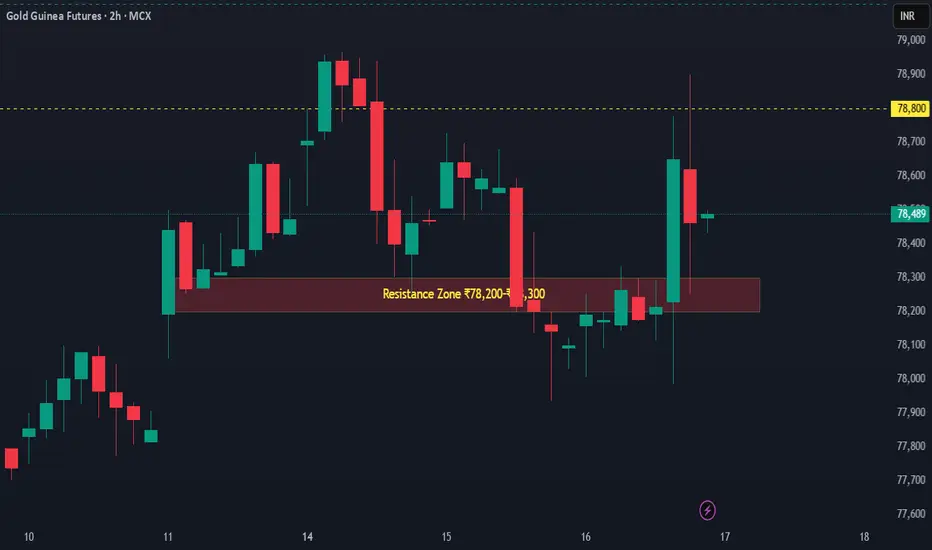
GOLD tug-of-war between buyers and sellers near key levelsCurrently, the price hovers near ₹78,489, slightly below the ₹78,800 resistance. If bulls can decisively break above ₹78,800 and hold, the next resistance targets are clearly demarcated at:
₹79,500 — minor resistance and previous support-turned-resistance.
₹80,000 — psychological round level and a previous top.
Failure to break ₹78,800 again may trigger a minor pullback to the ₹77,800 support zone, which has held well multiple times in the past few sessions.
The recent formation of higher lows and higher highs signals a short-term bullish structure.
Traders may look for a breakout and retest of ₹78,800 for fresh longs with targets near ₹79,500 and ₹80,000. On the downside, ₹77,800 remains key support to watch.
GOLD market is in a neutral-to-slightly bullish consolidationthe price sits at ₹78,189, holding above the key support zone of ₹77,800–₹78,000. Candlesticks are narrowing, indicating reduced volatility and a possible breakout buildup.
If bulls reclaim ₹78,800 with strong volume, we may see a retest of ₹79,500 and possibly ₹80,000.
However, a fall below ₹77,800 will weaken the structure, risking a drop to ₹76,800.
In summary, the market is in a neutral-to-slightly bullish consolidation, and traders should watch for breakout or breakdown signals from the current tight range.
Good holding sell trade from 97950 , downside 96800,96400 targetHow My Harmonic pattern projection Indicator work is explained below :
Recent High or Low :
D-0% is our recent low or high
Profit booking zone: D13% -D15% is
range if break them profit booking start on uptrend or downtrend but only profit booking, trend not changed
SL reversal zone : SL 23% and SL 25% is reversal zone if break then trend reverse and we can take reverse trade
Target : T1, T2, T3, T4 and .
Are our Target zone

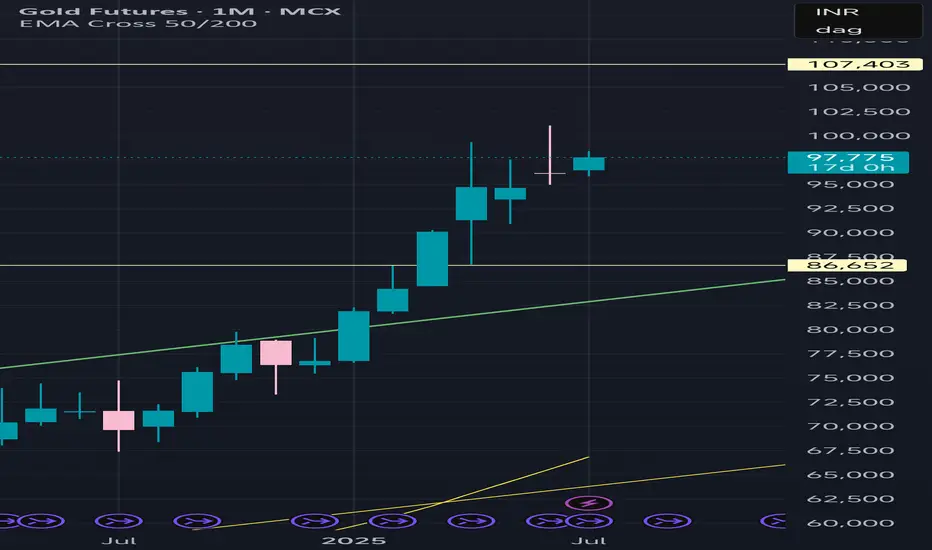
Negetive Pin bar Gold monthly chart candle at the top inverted pin bar shows negetive but waiting 17 days for the next candle to complete in red
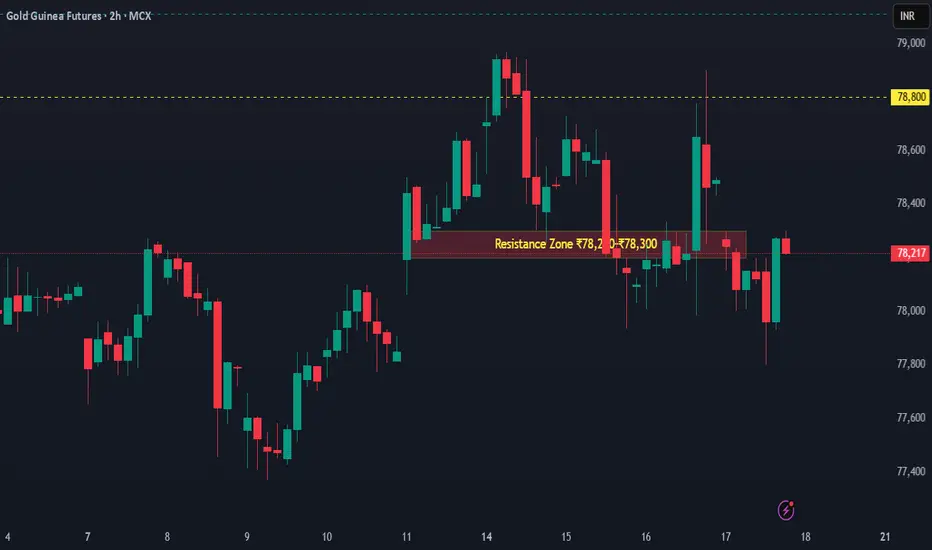
GOLD MCX The momentum is still favouring the bullsThe chart shows a decisive bullish recovery from the ₹77,300–₹77,400 support zone, where price formed a clear base and then rallied sharply. A strong upward move carried the price above ₹78,500, testing a resistance zone around ₹78,750–₹78,900. However, the latest candle indicates short-term selling pressure or profit booking, as it pulled back slightly after the sharp rise. Despite this, the overall price structure remains bullish, characterised by higher lows and higher highs since July 9. As long as the price sustains above ₹78,200–₹78,300, there is potential for a renewed push toward ₹79,000–₹79,300. On the downside, any breach below ₹78,000 could weaken the structure and bring a retest of ₹77,500. The momentum is still favouring the bulls, but close monitoring near the resistance zone is essential for traders.

Good mcx updated levels sell below 97400 , buy above 98100How My Harmonic pattern projection Indicator work is explained below :
Recent High or Low :
D-0% is our recent low or high
Profit booking zone: D13% -D15% is
range if break them profit booking start on uptrend or downtrend but only profit booking, trend not changed
SL reversal zone : SL 23% and SL 25% is reversal zone if break then trend reverse and we can take reverse trade
Target : T1, T2, T3, T4 and .
Are our Target zone
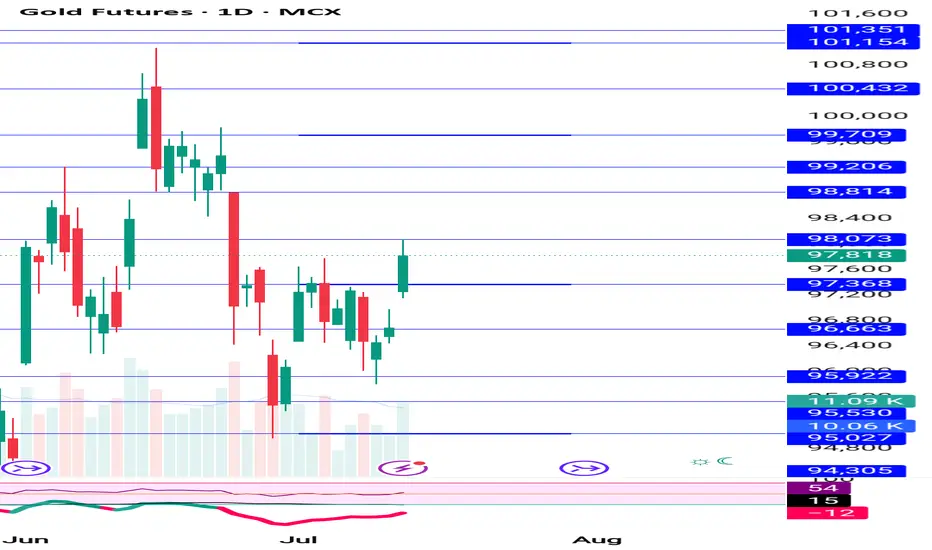
GOLD 14JULY TO 18 JULYGold is bullish till it gives two closing lows below 97000. On the upside gold can go up to 98 731 and then to 99668 and then to 101638.

Fundamental Analysis – Gold Outlook - 14th to 20th JulyFundamental Drivers for the Week Ahead
U.S. CPI (Consumer Price Index) – July 16, 2025
A softer print will increase Fed rate-cut bets, boosting gold.
Fed Chair Powell’s Comments – July 18, 2025
Any dovish tilt can ignite safe-haven buying.
India's Rupee Trend & Monsoon Update
Weak rupee = higher MCX gold; strong rupee = some pressure.
Monsoon progress may also influence rural gold demand sentiment.