NDQ US 100 INDEX 1W TVC 20201.37 08 MARCH 2025NDQ completes a classic "M" pattern in Gann Analysis. Double Top and Double Bottom what more a trader needs. We double tops on 16 Dec 2024 and 18 Feb 2025 on weekly charts. We are forming a double bottom on weekly charts on 07 Oct 2024 and 03 Mar 2025. We need to hold the lows of 03 Mar 2025 week at 19761.81. Below this level 19633 needs to be watched critically. We may resolve this trend in a months time around 07 Apr 2025 weekly candle. Downside levels to watch will be 18381 and 17371 if we sustain downwards trend. Aggressive traders can look to buy in the double bottoms woth suitable risk reward ratio as per their risk profile. Conservative traders can wait for current weekly highs to cross. Long term Gann Analysis shows we failed by minimum vibrations to a picture perfect pattern of "As Above...So below ". Gann Analysis "Lost Motion " phenomenon observed here. Watch 15 Apr 2025 as Time Coordinate for NDQ.
Happy Trading !!!
N.B. Not a financial advice to buy or sell.
With usual disclaimers as applicable within the reach of this beautiful trading analysis platform. Thanks to the developers of the program for this opportunity to use it freely to express our ideas to the community of traders.
NAS100 trade ideas

NASDAQ # Don't Miss the Oppurtunity NASDAQ is in Corrective mode, but not beyond this level. We shall see an up move / final rally (before a massive correction) towards a #blowofftop in my opinion.

Small Trade set Up This is one of the Pattern we refer as Flat pattern
which is Counter Trend to Current Trend
One can Look for Quick buy and sell or Trade Oversold Options in at the Money CE
Good luck
this is educational post

Nasdaq buy at 21230 add more at 21070 sl 20920 Target 21730-780How to take trades using Harmonic pattern projection Trade setup is explained below :-
Entry : 1st D point : 0% is recent top or bottom.
Trailing SL: 11.4% is work as trailing SL of buy or sell trade if hit then we have to book profit
.If price goes below 21.4% then early traders can make fresh reversals trade after breaking 11.4% safe traders can reversal trade after breaking 21.4%
Targets :
Target T1 : 28.3% ( early trade if entry at 11.4% )
Target T1 : 35.1% to 38.2%
Target T3 : 50.1% to 53.2%
T3: 61.8% to 65.1% is our 3rd Target since this is reversal zone so must book profit if break then take fresh trade again
Target T4 : 76.4% to 79.7%
Next Targets are 100% , 127.2% ,141.4% and final Target 161.8%.
How to take reversal trade :
If price going upside/ downside then then buy or sell levels appear on Chart ( Automatically show when price reach any reversal zone of harmonic projection pattern based .
After showing reversal levels wait for confirmation until 21.4% or 28.3 % level not break if break then exit from current buy / sell trade and take fresh reverse trade buy/ sell .
Trailing SL:
After reach 1st Target trail SL to just above or below cost ( for example we are holding sell trade from 100 1st Target 110 hit then move trailing sl to 104-105 and move SL as price move upside or Downside)
Re- Entry :
For Re-entry in any pull back Point D ( 11.4% ) is used for re-entry then SL recent high or low Point D ( 0% ) .
Target is same as early 21.4% , 28.3 , 35.1 and so on
Blue Line is 1st support/ Resistance
Green line is 2nd support/ resistance
Red line is 3rd Support/ resistance

US100 View for feb last weekUS100 is reversing from the demand zone and waiting for the confirmation to enter buy side.
Here is the view for educational purposes
Buy zone is marked between 20926.5 - 21040.8. It will be the high probability area. So, wait for the confirmation before entry.
Trade with 1:3 RR and it might touch all time high again. Trade accordingly.
It might be weak below the marked zone.
Trade after the confirmation.

US100 Today's Market Overview US 100
Market reached the OTE Zone on January 13th, and has shown good Bullishness.
Later it moved into the discount by February 1st Week and a clear SMT.
Now expecting the market to move into the Inception Zone inside the Breaker and then a Buy towards 20 Day Liquidity, PMH.
The Dates where already published , like I said Feb 4th say the market move to Discount and started reversing.

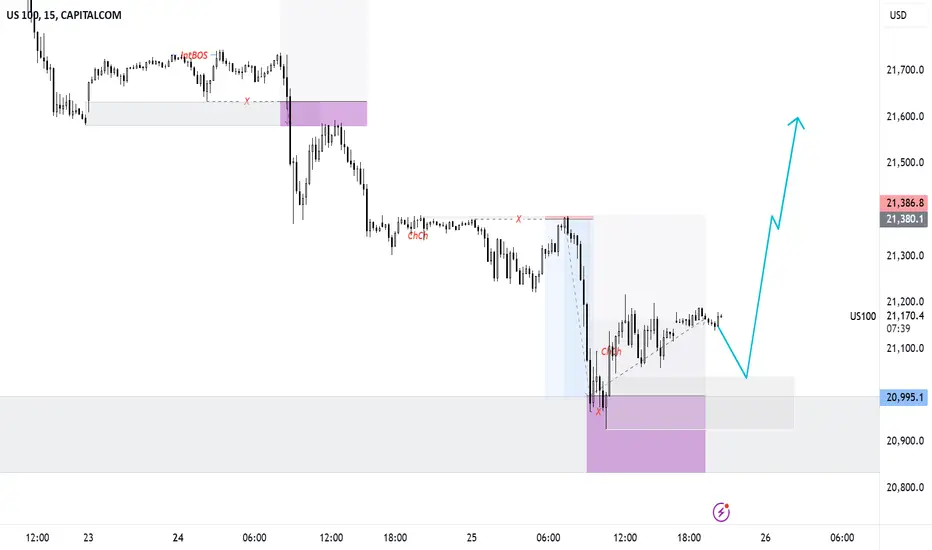
sell US100Trend: Uptrend. The final buyers push the price up when it touches the trendline but haven't taken profit yet.
On the H1 timeframe, a bearish signal appears → Sell one order first.
Wait for the candle to close for confirmation, then place one more sell order.

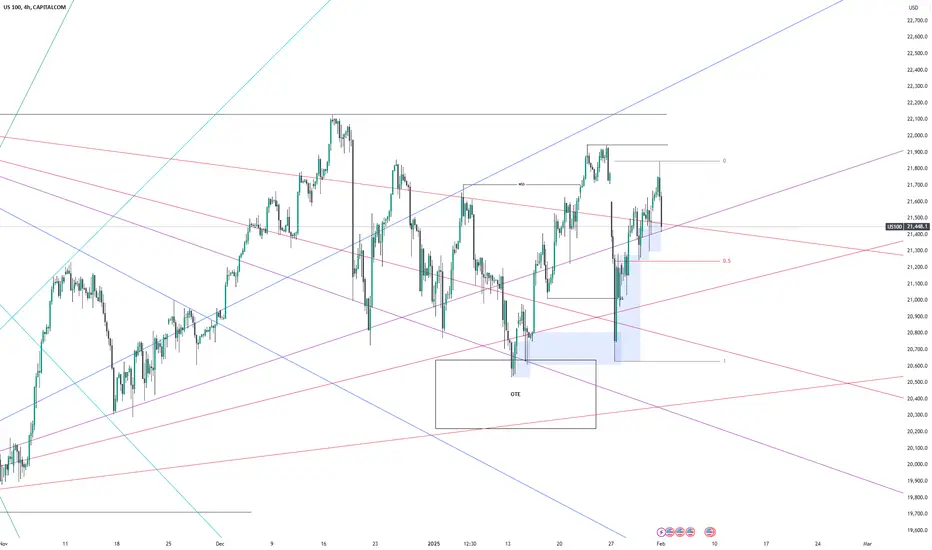
US100 Market Overview US 100 MARKET OVERVIEW
Price entered the Discount Array, specifically into the OTE level - 0.62 on January 13th.
After that we can see significant Bullishness
Talking abouth the IPDA Dealing Ranges, in the first 20 Days from January 1, market has swept liquidity of the previous 20 days thus moving into OTE.
Now you can expect market to target the Buyside liquidity.
Note : We have to get proper confirmations in the lower time frame, and then we look for Buy Setups.
Lets look closely what happens on Feb 4th , Feb 5th or Feb 6th...
NASDAQ 100 all Set to Crash to 18300!Nasdaq 100 CFD Daily Chart Live 27th Jan 2025
#NDQ #NDQ100 TVC:NDQ
SHORT SIGNAL TRIGGERED🐻🚨 on the back of a BIG TECHNOLOGICAL DEVELOPMENT from China's DeepSeek AI putting all of American AI to Shame, being vastly Superior and Cost Efficient, this leads to Popping of the AI Bubble in US Market
Price headed for Downside of sub 20k📉
And then even Lower Levels open up🩸🔨
200 Day EMA (Black MA) in Chart is the 1st Easy Downside Target🎯
Downside Targets are marked as Yellow Horizontal Lines in Chart
2 Major Downside Targets as follows:
T1= 19950 🎯
T2= 18300 🎯
and finally looking for Price to take down 5th August Low as well so approx. 17500 🎯

Nasdaq Target 25 K Soon Good News For American Markets The Nasdaq Composite Index is a market capitalization-weighted index that encompasses nearly all common equities listed on the Nasdaq Stock Market, making it one of the most comprehensive indicators of the U.S. stock market's performance. ( (indexes.nasdaqomx.com))
**Composition and Weighting**
As of 2023, the index includes over 2,500 companies, both domestic and international. It covers a diverse range of securities, including common stocks, American Depositary Receipts (ADRs), real estate investment trusts (REITs), and tracking stocks. Notably, the index excludes derivatives, preferred shares, funds, exchange-traded funds (ETFs), and debentures. ( (indexes.nasdaqomx.com))
The Nasdaq Composite is heavily weighted toward the technology sector, with tech companies constituting a significant portion of its market capitalization. This tech-centric focus distinguishes it from other major U.S. indices like the S&P 500 and the Dow Jones Industrial Average. ( (www.investopedia.com))
**Calculation Methodology**
The index employs a market capitalization-weighted methodology, meaning each company's influence on the index's performance is proportional to its market value. The overall index value is derived by summing the market capitalizations of all included securities and dividing by a specific divisor, which is adjusted to account for stock splits, dividends, and other corporate actions. ( (www.investopedia.com))
**Historical Milestones**
- **1971**: The Nasdaq Composite was launched with a base value of 100.
- **March 2000**: The index peaked during the dot-com bubble, reaching an intraday high of 5,132.52.
- **March 2009**: It hit a low of 1,265.52 following the financial crisis.
- **June 2020**: The index surpassed the 10,000 mark for the first time.
- **December 2024**: The Nasdaq Composite closed above 20,000, driven by significant gains in major technology stocks such as Apple, Nvidia, Alphabet, and Tesla. ( (www.reuters.com))
**Sector Weightings**
The index's heavy weighting in technology stocks makes it particularly sensitive to developments in the tech industry. Other sectors represented include consumer discretionary and healthcare, but to a lesser extent. ( (www.investopedia.com))
**Investment Considerations**
Investors often view the Nasdaq Composite as a barometer for the technology sector and growth-oriented companies. Its performance can differ significantly from other major indices due to its unique composition. While the index has demonstrated substantial growth, especially during periods of technological innovation, it can also exhibit higher volatility, reflecting the dynamic nature of the tech industry.
In summary, the Nasdaq Composite Index offers a broad perspective on the performance of companies listed on the Nasdaq Stock Market, with a pronounced emphasis on the technology sector. Its movements provide valuable insights into market trends, particularly those related to technological advancements and growth companies.
- (www.reuters.com)
- (www.investopedia.com)

Short term correction We can expect short term correction
Identify the weak stock and over valued stock for short selling

NASDAQ 100 at a Crossroads : possible 25 5 correction aheadNASDAQ 100 at a Crossroads: Technical Reversal and Macroeconomic Storms Signal a 25% (from top) Correction Ahead
Technical Indicators:
Relative Strength Index (RSI):
The RSI on the monthly timeframe is approaching overbought territory (~70). A reversal from this level would provide further confirmation of a bearish trend developing.
Trendline Analysis:
The price broke out of an ascending channel in mid-2024 but is now testing the upper boundary as support. Failure to hold this level could lead to a sharp decline, as seen during corrections in 2022 and 2020.
Comparison with Historical Corrections:
During the 2022 correction, the NASDAQ 100 retraced approximately 35% from its peak.
The current overextended rally mirrors past peaks, where correction phases were triggered by rising interest rates or geopolitical events.
A 25% retracement from the December 2024 high would align with prior patterns, targeting the 16,500–17,000 range.
Final Thoughts:
Traders and investors should remain cautious as the NASDAQ 100 faces headwinds from a bearish technical setup and macroeconomic uncertainties. A combination of delayed rate cuts, policy risks under the new administration, and historical correction patterns suggest that the index may face significant downside in the coming months.

nas100 or Nasdaq can touch 27000 in next year 2025i think nas100 can touch 27000 in nxt year , this analysis is base on Fibonacci retracement.
Chart time frame is monthly. I believe that monthly analysis is best for Future predictions it can gives us 90-95 percentage. lets see what happen in next year.

Ustech if break 21220 then downtrend will start fall will be bigWe get huge profit on Nasdaq buy side trade booked profit near 21500 .
Now if break 21200 downtrend will start and big fall will come come most of the big tech ready for profit booking
Disclaimer -
This information is only for educational purposes, this is not for any buy or sell recommendations .
On Our Harmonic pattern indicator
based trade setup take trade as explained below :-
ENTRY -
When price breaks Trailing SL (SL 27.2 % )retracement Which is SL points then take Entry on Buy or Sell Trade
SL -
D points Which is recent High / Low mentioned in Chart is our SL
TARGET -
Target 1- (T1 : 38.2)
Target 2- (T2 : 50 %)
Target 3- (T3 : 61.8%)
Target 4- (T4 : 78.6%)
Please note:-
It's working on news based and volitile market very well so exit if SL hit

NDX : Rising Wadge (Downtrend starting)Nasdaq 100 (NDX) is in last stage of Rising Wadge Pattern, if it closes below 20900 then a downtrend will start which gives a target of 18000 nearly.
When NDX closes below 20900 with high volume Put STOPLOSS of 21550 and enjoy the downtrend (minor pullbacks will be seen) trail your stoploss to maximize your profit.
Put Stoploss on closing basis.
(In Trading Time it may go above/below stoploss But closing price is most important).
These are levels are generated on the basis on Fibonacci Series
NOTE : I am not SEBI registered advisor in capital market.
Disclaimer:- Please always do your own analysis or consult with your financial advisor before taking any kind of trades. Please understand Risk in trading before taking any trade with your financial consult. I am only sharing my knowledge it may be right or sometimes wrong so I am not liable for any loss.
Dear traders, If you like my work then do not forget to hit like and follow me, and guy's let me know what do you think about this idea in comment box, i would be love to reply all of you guy's.
Thank you.

Ustech bought from 21150 1st Target hit Disclaimer -
This information is only for educational purposes, this is not for any buy or sell recommendations .
On Our Harmonic pattern indicator
based trade setup take trade as explained below :-
ENTRY -
When price breaks Trailing SL (SL 30 % )retracement Which is SL points then take Entry on Buy or Sell Trade
SL -
D points Which is recent High / Low mentioned in Chart is our SL
TARGET -
Target 1- (T1 : 50)
Target 2- (T2 : 61 %)
Target 3- (T3 : 78%)
Target 4- (T4 : 100%)
Please note:-
It's working on news based and volitile market very well so exit if SL hit

naz shortA Renko chart is a type of chart, developed by the Japanese, that is built using price movement rather than both price and standardized time intervals like most charts are. It is thought to be named after the Japanese word for bricks, "renga," since the chart looks like a series of bricks. A new brick is created when the price moves a specified price amount, and each block is positioned at a 45-degree angle (up or down) to the right of the prior brick. An up brick is typically colored white or green, while a down brick is typically colored black or red.

NDX intraday levels for 8th nov 2024Please check the levels on chart
Blue levels are make or break levels
Consider some buffer points in above levels.
Please do your due diligence before trading or investment.
**Disclaimer -
I am not a SEBI registered analyst or advisor. I does not represent or endorse the accuracy or reliability of any information, conversation, or content. Stock trading is inherently risky and the users agree to assume complete and full responsibility for the outcomes of all trading decisions that they make, including but not limited to loss of capital. None of these communications should be construed as an offer to buy or sell securities, nor advice to do so. The users understands and acknowledges that there is a very high risk involved in trading securities. By using this information, the user agrees that use of this information is entirely at their own risk.
Thank you

Nas100 marked this chart up in 2023very accurate looking for end of quarter christmas rally!
then pull back end of January-February 2025

NAS100 SHOWING A GOOD UP MOVE WITH 1:5 RISK REWARD NAS100 SHOWING A GOOD UP MOVE WITH 1:5 RISK REWARD
DUE TO THESE REASON
A. its following a rectangle pattern that stocked the market
which preventing the market to move any one direction now it trying to break the strong resistant lable
B. after the break of this rectangle it will boost the market potential for break
C. also its resisting from a strong neckline the neckline also got weeker ald the price is ready to break in the outer region
all of these reason are indicating the same thing its ready for breakout BREAKOUT trading are follws good risk reward
please dont use more than one percentage of your capitalfollow risk reward and tradeing rules
that will help you to to become a bettertrader
thank you

Ahead of US Elections, on Friday *NASDAQ100* - GRAVEYARD DOJIAhead of US Elections, on Friday *NASDAQ100* has formed a GRAVEYARD DOJI Candlestick (Daily Time Frame) pattern which indicates selling pressure near its ATH.

NDX intraday levels for 24th oct 2024 Please check the levels on chart
My todays view for your study analysis only :- today's trend is not so clear but probably will be buy on dip.. we will find out exact trend soon !!
Consider some buffer points in above levels.
Please do your due diligence before trading or investment.
**Disclaimer -
I am not a SEBI registered analyst or advisor. I does not represent or endorse the accuracy or reliability of any information, conversation, or content. Stock trading is inherently risky and the users agree to assume complete and full responsibility for the outcomes of all trading decisions that they make, including but not limited to loss of capital. None of these communications should be construed as an offer to buy or sell securities, nor advice to do so. The users understands and acknowledges that there is a very high risk involved in trading securities. By using this information, the user agrees that use of this information is entirely at their own risk.
Thank you.
