[MCX] Natural Gas Assumptive Support BetNote -
One of the best forms of Price Action is to not try to predict at all. Instead of that, ACT on the price. So, this chart tells at "where" to act in "what direction. Unless it triggers, like, let's say the candle doesn't break the level which says "Buy if it breaks", You should not buy at all.
=======
I use shorthands for my trades.
"Positional" - means You can carry these positions and I do not see sharp volatility ahead. (I tally upcoming events and many small kinds of stuff to my own tiny capacity.)
"Intraday" -means You must close this position at any cost by the end of the day.
"Theta" , "Bounce" , "3BB" or "Entropy" - My own systems.
=======
I won't personally follow any rules. If I "think" (It is never gut feel. It is always some reason.) the trade is wrong, I may take reverse trade. I may carry forward an intraday position. What is meant here - You shouldn't follow me because I may miss updating. You should follow the system I share.
=======
Like -
Always follow a stop loss.
In the case of Intraday trades, it is mostly the "Day's High".
In the case of Positional trades, it is mostly the previous swings.
I do not use Stop Loss most of the time. But I manage my risk with options as I do most of the trades using derivatives.
=======
Trade ideas

Natural Gas (MCX): Week of 13/12/2022Levels:
Support: 200, 175, 150, 120
Resistance: 212, 250
OI Data (24rd March Expiry):
Nearest Major Resistance per OI data: 220
Nearest Major Support per IO data: 200
Trade setup:
+++++++++++++++++++++++++++++++++++++++++
Trade | Level | SL | T1 | T2
-----------------------------------------
BUY | > 220 | 200 | 235| 250
-----------------------------------------
SELL | < 190 | 210 | 170 |150
+++++++++++++++++++++++++++++++++++++++++

natural gas sell in 15 min on 10 mar 2023natural gas sell in 15 min on 10 mar 2023 both target is completed

Natural Gas MCX- Cross over at around 1430 hrs IST on 9th March
Crossover of trend line marked in circle.
When ? - On 1 hr time frame - 1400 - 1500 hrs, on 15 mins time frame 1415 -1430 hrs IST
This may change the trend. The trend will follow the 1 hr candle. Opportunity for momentum trading
Cross over of trendlines - Trendline on Daily Time frame will intersect with trendline on hourly time frame

Naural Gas - Bear Flag/Ascending Triangle BreakdownAscending triangle & Bearish Flag pattern Breakdown.
Signalling weakness to continue.
Given the Length of Pole & continuous correction past few months, the next downward move can extend to 140-110 zone.
This can be the last leg of selling hence expecting a fierce move downwards.

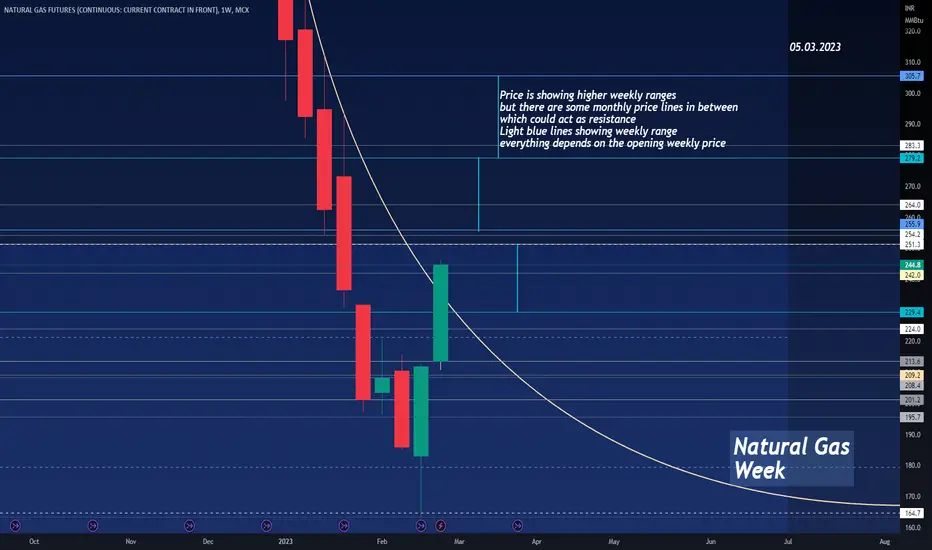
Natural gas next week,06.03.2023Publishing herewith my idea about natural gas for next week using weekly time frame
NG - Bullish NowPlease Read my commentary on Chart
Natural Gas - With Bullish COT repots, NG has now the potential to touch 4.4 in coming weeks and months. I will be looking for "Buying Opportunities" on 240/60 Mins TF
If Daily closes above 3.1 (On Friday, it just missed that) it will give additional strength to this view

natural gas weekendRe-publishing my idea dtd. 25.02.2023, after touching monthly inside candle price made a good recovery also able to touch the green line
if u hv gone through my educational idea " Scenarios when a price makes a big and fast upward moves", i cited this movement of natural gas as an example

natural gas (ng) mcx ab=cd with shark harmonic pattern Natural gas forming ab=cd harmonic pattern with shark harmonic pattern .
that pattern indicate =BUY natural gas between 221-19 add more 195.9 two days closing 168 below target 403-574-801
we kept two days closing stop loss just bcoz of weekly time frame..
above 247 closing will take sharp move for 300-403
around 403 should partial booking can consolidated or reverse from there for retrecment .
2 days close above 403 is non stop target will life time high ...
if all set then should not go and close below 189
BOLO JAI GAJANAND

Natural gas reversal zones 3-3-2023Note: Always try to find a good price action patterns or any candle stick patterns in marked zones in smaller timeframe to take entry with small stop loss. Or can take entry based on one 5 min candle close below or above the zone with SL previous candles high or low (*try to avoid big candles).
(Color code for Support & Resistance zones: Red - Sell, Green - Buy, Price once cross above resistance it is obvious it will work as support, vis versa price cross below support zone ). Please understand that market can break all the support and resistance anytime. If any doubt for take entry in price action patterns, please ask in comment box, i will try to help.
Disclaimer: Im not tip provider and this chart is not indented to take trade in my levels, It is shared here for learning purpose. Trading in this pattern is all your own risk. #NG, #Naturalgas

Natural Gas buy on DipNatural gas has retraced to a good level as per Fibo retracement can be bought at current level for a good 5-15 % move.
#fibonachi

natural gas day ,28.02.2023publishing herewith my idea about natural gas using day time frame , price reached a monthly level, if able to maintain it positive, if still continues with momentum , refer levels


Buy Natural Gas Future Target 215+Price has formed a bullish engulfing candlestick pattern after a prolonged bearish move. RSI has formed a positive divergence and is now above 30. MACD had earlier formed a bullish crossover and is moving consistently above its signal line. Futures data of MCX show a long build-up. A long trade can be taken in MCX futures in between 197-204. Our study indicates that the price can rise up to 215 and above that, it can rise up to 219-226. The stop-loss will be below 191 on a daily close basis. Holding duration 1-4 trading sessions.
If you guy's like my effort please like, follow, and comment.
thankyou

mcx ng bull engulf pattern it will rockks soon 248--70mcx ng bull engulf pattern it will rockks soon 248--70 so buy on dips with 197 cls base sl or solid sl 163 blw yess weekly chart pattern may push uper side

NG (MCX): Week of - 27/02/2023Levels:
Support: 200, 190, 175, 150, 120
Resistance: 220, 235, 250
OI Data (24rd March Expiry):
Nearest Major Resistance per OI data: 220
Nearest Major Support per IO data: 200
Trade setup:
1. In the chart, clearly marked which is the No-Trade, which is the BUY and which is the Sell zone.
+++++++++++++++++++++++++++++++++++++++++
Trade | Level | SL | T1 | T2
-----------------------------------------
BUY | > 220 | 200 | 235| 250
-----------------------------------------
SELL | < 190 | 200 | 170 |150
+++++++++++++++++++++++++++++++++++++++++

natural gas next week,27.02.2023Publishing herewith my idea about natural gas for next week using week time frame

Natural gas weekendPublishing herewith my weekend analysis of my idea
after reaching monthly Inside candle , price almost behaved like a rocket , yesterday bypasses the curved pattern and opened gap up even at the closing was able to close above another trend-line

Natural gas,24.02.2023Publishing herewith my idea about Natural gas using day time frame
one sided communication is not a healthy communication , thanks for those 2 boost

Natural gas reversal zones (Ignore earlier chart posted today)Please ignore earlier chart posted.
Note: Always try to find a good price action patterns or any candle stick patterns in marked zones in smaller timeframe to take entry with small stop loss. Or can take entry based on one 5 min candle close below or above the zone with SL previous candles high or low (*try to avoid big candles).
(Color code for Support & Resistance zones: Red - Sell, Green - Buy, Price once cross above resistance it is obvious it will work as support, vis versa price cross below support zone ). Please understand that market can break all the support and resistance anytime. If any doubt for take entry in price action patterns, please ask in comment box, i will try to help.
Disclaimer: Im not tip provider and this chart is not indented to take trade in my levels, It is shared here for learning purpose. Trading in this pattern is all your own risk. #NG, #Naturalgas


Natural Gas Day, 22.02.2023publishing herewith my idea about natural gas using day time frame, still above a curved trendline also near a monthly inside candle ,

