Us equity market 2025 and 2026 high probability of recession The possibility of a U.S. recession in 2025 and 2026 is becoming increasingly likely due to several key economic indicators. One of the most significant warning signs is the GDP-to-market-cap ratio, which currently stands at 211%—far beyond historical norms. This suggests that the stock market is extremely overvalued relative to the economy’s output. Historically, when this ratio surpasses 150%, markets tend to be in a bubble, increasing the risk of a severe correction.
Another major red flag is yield curve inversion, a highly reliable recession indicator. When short-term interest rates exceed long-term rates, it signals that investors expect slower economic growth. This phenomenon has preceded nearly every U.S. recession in modern history.
The unemployment rate remains low, but any increase could indicate a weakening labor market. Coupled with high interest rates, which make borrowing more expensive, the risk of an economic slowdown rises. As borrowing slows, consumer spending and corporate earnings could decline, leading to further economic contraction.
Institutional investors and major financial firms have been increasing their cash reserves, a sign that they anticipate significant market turbulence. When large investment houses reduce risk exposure, it often means they foresee conditions that retail investors might not yet understand. Historically, institutional moves serve as an early warning for downturns.
Additionally, the price-to-earnings (P/E) ratio remains excessively high, suggesting that stocks are overvalued relative to earnings potential. A market correction could significantly impact asset prices.
For US30 (Dow Jones Industrial Average) to reach an undervalued level based on the GDP-to-market-cap ratio, insiders estimate that the market would need to decline by at least 55% or more. This implies a potential downturn on par with the 2000 dot-com crash, making the next few years critical for investors navigating market risks.
Trade ideas

DOW JONES - TRIANGLE AT RESISTANCE - EXPECTING SELL OFFSymbol - DJI
CMP - 44593
The Dow Jones Industrial Average is currently trading within a symmetrical triangle pattern, indicating a period of consolidation. This technical structure suggests that the price is experiencing a balance between buyers and sellers, with no clear directional bias in the immediate short term. The breakout of this triangle, whether upwards or downwards, will likely determine the next significant move in the market. At present, my personal bias is towards the downside, anticipating a potential bearish breakout.
Currently, the key resistance zone for the Dow Jones lies between 44900 - 45100. This range is proving to be a formidable barrier for upward price movement. Until this zone is decisively broken to the upside, the continuation of the bullish trend appears unlikely. The market is facing significant resistance, and it seems that for any sustained bullish momentum, a strong move above this level is required.
If the triangle pattern breaks downwards, it could signal a correction that may lead the price to form a double top pattern on the larger time frame. A double top is a classic bearish reversal pattern, and its formation would likely confirm a shift from the prevailing bullish trend to a more bearish outlook. In this scenario, traders should be cautious of further downside risks, especially if the price breaks key support levels.
However, if the price manages to break above the resistance zone of 45100 and sustains that move, the bullish trend would likely continue, and any short positions would be invalidated. A breakout above this key resistance would indicate a strong continuation of the uptrend, signaling that the market is poised for further gains.

Dow Jones Date : 16.02.2025
Dow Jones
Timeframe : Day chart
Remarks :
1 Formed Double top at recent trend
2 Formed Pennant pattern with support of 20 EMA at base of the flag
3 Had a Breakout from symmetrical Triangle pattern during Impulsive wave
4 Right now at 3-3-5 Flat Corrective Wave
5 As a rule, in Flat 3-3-5 Corrective Wave, if Wave B is equals Wave A forming double top kind of structure then projection of C will be below starting of Wave A as 5-3-5-3-5 Wave formation
6 Keep a close eye on breakdown of Pennant pattern below 20 EMA , Wave C will initiate
Regards,
Ankur

Second Sell Recommendation for US30 Based on the ChartTechnical Analysis:
Strong Resistance at 44,750 - 44,959
US30 is approaching a strong resistance zone where price previously faced rejection.
This area coincides with the EMA 33 and a key supply zone.
Fibonacci Retracement 0.618 - 0.786
The price is reaching the 0.618 – 0.786 Fibonacci retracement levels, which are often reversal zones.
In the previous attempt, selling pressure increased significantly at this level.
Price Structure
US30 has shown a previous downtrend and is now retracing towards a critical resistance level.
If the price fails to break above 44,950, a further decline is highly likely.
Declining Volume
During the price increase towards resistance, trading volume has been weakening.
This indicates that buying momentum is fading, increasing the chances of a bearish reversal.
Trading Strategy:
Sell Entry Zone: Around 44,750 - 44,950
Stop Loss: 45,195 (above resistance zone)
Take Profit Targets:
Target 1: 44,200 (EMA 33 Low)
Target 2: 43,780 - 43,770 (strong support zone)
🎯 Risk-to-Reward (R:R) Ratio Estimate: 1:3 – A favorable setup if price reacts as expected.

SELL for US30 – Target 43,000 - 43,300 by the End of the Week
The Dow Jones Industrial Average (US30) has formed a bearish structure on the 4H timeframe, signaling a potential decline toward the 43,000 - 43,300 zone by the end of this week and Early Next Week. The chart highlights key technical resistance levels and a downside Fibonacci extension target, supporting a short position.
Technical Analysis
Bearish Indicators
Rejection at Key Resistance (44,650 - 44,892)
US30 failed to break above 44,650 - 44,892, confirming a bearish rejection.
The price is struggling near the EMA 33 high (44,600), indicating weakness.
Bearish Fibonacci Setup
The price has broken below the 0.618 Fibonacci retracement level of the previous rally.
The 1.618 Fibonacci extension projects a downside move toward 43,253.
Bearish Volume Confirmation
A large bearish volume spike confirms strong selling pressure.
This suggests institutional traders are offloading long positions.
EMA Resistance & Breakdown Pattern
The price is trading below the short-term EMAs (44,600 & 44,426), acting as dynamic resistance.
A potential bear flag breakdown is forming, increasing downside risk.
Trade Setup – Short Position
📉 Sell Entry: 44,450 – 44,560
🎯 Take Profit (TP):
Target 1: 43,781 (first major support)
Target 2: 43,300 (end-of-week target)
Final Target: 43,000 (extended bearish move)
🔴 Stop Loss (SL): 44,900 (above resistance)

Dow Jones 1Day Chart at 2 Top - Warning Signal - SellPast will reflect in present structure. Evidence will take time to approve this structure.
Problem here is that 1M Fisher is bent at Top and that too from a FFHTSI Bottom to make a Top. Just few days for finding this important structure that it perfectly works.
If this analysis is correct within few days, please comment.
Time frame - At present if 1W KOD is confirmed, this fall will linger on for weeks and further structure will decide whether it will continue for months.
In my previous intra day analysis on Dow Jones, I talked about 1H 2 Top, it did not work on that day but from next day, it was falling as predicted. Have a look.

THE 56 YEAR BUSINESS PATTERN IN US MARKETS ...DJIA YEARLY CHART Cycle is in Progress 1985 TO 2040
Dow Jone Industrial Averages Yearly Chart ..
Level to watch is 45954...Palindrome Number
Happy Trading !!!

dow jonesWe have a probable HnS on Both the Dow Jones and the S%P 500 . I had identified this about 7 days ago and sent the patterns to a friend of mine who brushed it off as not happening. I believe a CRASH LANDING is inevitable hereon in the US markets. Having said that.... I maintain that the US markets will fall somewhere in the region of 17% hereon..... while Nifty will follow suit and will fall roughly upto 21090( I sent a chart on this some days ago).

US 30 - What Next ?Since November 2023, the index has been moving in a rising parallel channel. This time, again, it comes to the lower edge of the channel.
If shows a reversal from the lower edge, may go into a bullish phase. MACD shows a reversal sign too. But merely this is not enough. should wait for some more confirmations. However, this is a good time to exercise a position with a low risk.
If gives a bounceback around these levels, may go around 44500 or more..
This illustration is only for learning and sharing purposes, it is neither a prediction nor a trading advice in any way.
All the best for your trading plans.

Good News ! Dow Jones Index Approach 50 K In Next Few Months The Dow Jones Industrial Average (DJIA), often referred to as "the Dow," is a prominent stock market index that tracks 30 large, publicly-owned blue-chip companies trading on the New York Stock Exchange (NYSE) and the Nasdaq. Established on May 26, 1896, by Charles Dow, co-founder of The Wall Street Journal and Dow Jones & Company, it is one of the oldest and most widely recognized stock market indices globally. ( (en.wikipedia.org))
**Composition and Weighting**
The DJIA comprises 30 companies considered leaders in the U.S. economy, spanning various industries except for transportation and utilities. Unlike market capitalization-weighted indices, the DJIA is price-weighted, meaning each component's influence on the index is proportional to its stock price. This structure implies that higher-priced stocks have a more significant impact on the index's movements. ( (www.spglobal.com))
**Calculation Methodology**
The index is calculated by summing the prices of its 30 component stocks and dividing by the Dow Divisor, a factor adjusted to account for stock splits, spinoffs, and other structural changes. As of November 8, 2024, the Dow Divisor is approximately 0.1627, meaning a $1 change in any component stock's price results in about a 6.15-point movement in the index. ( (en.wikipedia.org))
**Historical Milestones**
- **1896**: The DJIA was introduced, initially comprising 12 industrial companies.
- **1928**: The index expanded to 30 stocks, a composition that has been maintained, though the specific companies have changed over time.
- **November 2024**: Nvidia and Sherwin-Williams joined the DJIA, replacing Intel and Dow Inc., reflecting shifts in the semiconductor and materials sectors. ( (www.barrons.com))
**Recent Performance**
In December 2024, the DJIA closed above 45,000 for the first time, marking a significant milestone in its history. However, as the index's absolute value increases, each 1,000-point milestone represents a smaller percentage gain, prompting analysts to suggest focusing on percentage changes rather than absolute point increases. ( (www.marketwatch.com))
**Investment Methods**
Investors can engage with the DJIA through various financial instruments:
- **Exchange-Traded Funds (ETFs)**: Funds like the SPDR Dow Jones Industrial Average ETF Trust (DIA) aim to replicate the performance of the DJIA.
- **Mutual Funds**: Certain mutual funds are designed to mirror the index's performance by holding the same stocks in corresponding proportions.
- **Derivatives**: Options and futures contracts based on the DJIA are available for more advanced investment strategies.
**Considerations**
While the DJIA is a widely followed indicator of U.S. stock market performance, it has certain limitations:
- **Price-Weighted Methodology**: This approach means that higher-priced stocks disproportionately influence the index, which may not accurately reflect the overall market capitalization.
- **Limited Components**: With only 30 companies, the DJIA represents a small segment of the broader market, potentially overlooking sectors or companies that are significant in the wider economy.
Despite these considerations, the DJIA remains a key barometer of the U.S. stock market and economic health, offering insights into the performance of major American corporations.
- (www.wsj.com)
- (www.barrons.com)
- (www.marketwatch.com)

Dow Jones ready to resume DOWN TREND!#DJI DJ:DJI
Attached: Daily Price Chart as of 20th Jan 2025
Time for Dow to DUMP again🩸 and resume its former Down Trend📉
as the rally since 18th December is a sideways corrective flat wave pattern and so the Impulse Bea Wave to follow next🐻🔨
Price can target 200 Day EMA, also forming a HNS Pattern and then take it level by level for further breakdowns

Option and Database trading Options data captures information on options contracts, including pricing and trading volumes, useful for investment strategies. Discover our guide and top options data providers. Options are a type of contract that gives the buyer the right to buy or sell a security at a specified price at some point in the future.

Option chain in trading Option chain is a chart that will give in-depth information related to all stock contracts available for Nifty stocks. The best thing about the option chain is that it provides valuable information about the current security value and how it will affect it in the long term.

DJIA INDEX GANN ANALYSIS FOR JAN 2025 DATED 12 JAN 2025Last update 06 Dec 2024 we were near 45000 levels and time to watch was 18 Dec 2024 and price to watch was 45000. We failed near the level of 45000 and saw acceleration after the 18 Dec 2024 timeline. Level to watch was 43200. It was breached swiftly and backtested on 26 dec 2024 and the fall continued. We are nearing the price target of 41400 anf time target of 16 Jan 2025. We need to watch both coordinates critically. We have a bottom around 41637.30 on 4 Nov 2024 and top around 41585.21 on 30 Aug 2024.
Happy Trading !!!

DJIA : Head & Shoulder Pattern ( Very Bearish )A very bearish n very result oriented Head & Shoulder Pattern is in formation. When DJIA closes below /breakdown neckline 42200 with high volume. Then DJIA will be heading towards 40000.
After downtrend with minor pullbacks it will be heading to 40000. It means A long term downtrend has been started for quite a long time.
All above assumption will be negated when DJIA closes above 44400, then a very big upward move will be seen.
Put Stoploss on closing basis.
(In Trading Time it may go above/below stoploss But closing price is most important).
These are levels are generated on the basis on Fibonacci Series
NOTE : I am not SEBI registered advisor in capital market.
Disclaimer:- Please always do your own analysis or consult with your financial advisor before taking any kind of trades. Please understand Risk in trading before taking any trade with your financial consult. I am only sharing my knowledge it may be right or sometimes wrong so I am not liable for any loss.
Dear traders, If you like my work then do not forget to hit like and follow me, and guy's let me know what do you think about this idea in comment box, i would be love to reply all of you guy's.
Thank you.

Dow Jones: Ready for a Bull Run?! Dow Jones is testing critical levels as it approaches a descending trendline. With strong support below and bullish momentum building, the question remains—will it break out for a rally or face resistance again?
Key levels:
1. Resistance Zones:
- 43,400.00
- 43,346.03
- 43,063.60
2. Support Levels:
- 42,815.04
- 42,450.00
- 42,229.91
3. Current Setup:
- The price is moving within a defined structure and testing the trendline resistance.
- A successful breakout above the trendline could signal the start of a bullish run.
- On the flip side, rejection at the resistance might lead to a retest of lower support zones.
How to Trade This:
- Bullish Strategy:
- Watch for a breakout above 43,063.60 with strong volume.
- Targets: 43,346.03 and 43,400.00.
- Stop Loss: Below 42,815.04.
- Bearish Strategy:
- If the price gets rejected near 43,063.60, consider short positions.
- Targets: 42,815.04 and 42,450.00.
- Stop Loss: Above 43,063.60.
Bottom Line:
Dow Jones is at a critical juncture. A breakout could lead to a significant upward rally, while failure to clear the trendline resistance may bring the price back into its support range. Stay alert and trade the breakout or rejection based on confirmation! 📈📉
DJ:DJI BLACKBULL:US30 DJ:DJI TVC:DJI

DOW JONES - SWING TRADESymbol - DJI
DJI is currently trading at 42545
Dow Jones is making double bottom at larger time frame & I'm seeing a trading opportunity on buying side.
Buying DJI Futures at CMP 42545
I will add more position if 42345 comes & will hold with SL 42100
Targets I'm expecting are 43100 - 43340 - 43580 & 42820
Disclaimer - Do not consider this as a buy/sell recommendation. I'm sharing my analysis & my trading position. You can track it for educational purposes. Thanks!

Potential Head and Shoulders Pattern on DJI - Bearish Outlook?The Dow Jones Industrial Average (DJI) appears to be forming a classic head and shoulders pattern within an ascending channel. The left shoulder, head, and right shoulder are clearly marked, with the neckline drawn slightly below the current price level. A breakdown below the neckline could signal a bearish move. However, a breakout above the right shoulder could invalidate the bullish bias, leading to a potential continuation of the upward trend.

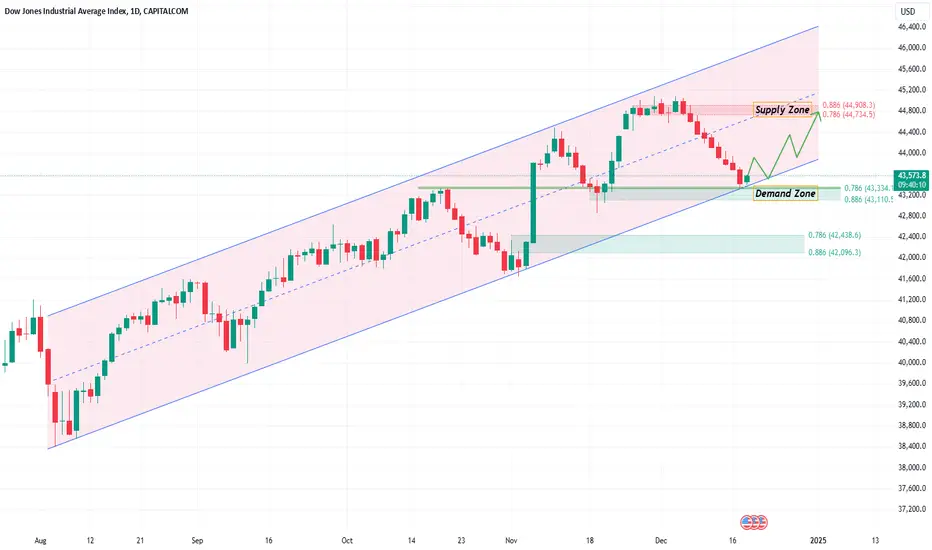
Dow Jones - daily chart - Upward Channel pattern1. Dow Jones travelling in an Upward Channel
2. Currently in Demand Zone and there are more chances to reach 44700 - 44900
3. If 19th Nov low(42850) is broken, then 42000 might be tested
Thank you.
Regards
Bull Man
Dow Jones at the end of a losing streakThe DJI is falling right into the FED meeting will it recover in the aftermath. Prices are close to the lower band that can act as the final support. Is this wave i of a bear market? Lots of questions.

NAS100 SHOWING A GOOD UP MOVE WITH 1:7 RISK REWARD NAS100 SHOWING A GOOD UP MOVE WITH 1:7 RISK REWARD
DUE TO THESE REASON
A. its following a rectangle pattern that stocked the market
which preventing the market to move any one direction now it trying to break the strong resistant lable
B. after the break of this rectangle it will boost the market potential for break
C. also its resisting from a strong neckline the neckline also got weeker ald the price is ready to break in the outer region
all of these reason are indicating the same thing its ready for breakout BREAKOUT trading are follws good risk reward
please dont use more than one percentage of your capitalfollow risk reward and tradeing rules
that will help you to to become a bettertrader
thank you

DOW JONES INDUSTRIAL AVERAGE INDEX GANN VIEW 06 DEC 2024DJIA Index has moved up from third higher low of nearly 38400 levels around Aug 05, 2024. We saw consolidation around later part of Apr 2024 and first week of May 2024 near the levels of 37400 which was important level. Intermitent low came around May 2024 end in between these two levels. We completed one price cycle at the level of 43200 in mid Oct 2024. Pullback was arrested around 41400 ( 41647.30 atcual low Nov 04, 2024 ) which was above the two tops of 41376 on July 18, 2024 and 41585.21 on Aug 30, 2024. The index needs to sustain above the level of 45000 for further growth. Current swing low of 42938.87 was on Nov 19, 2024. Timewise Dec 18, 2024 needs to be watched and Pricewise we need to watch 45000 level. Above this level we we open for next target of 46800 and 48000.
Happy Trading !!!
N.B. Not a financial advice to buy or sell.With usual disclaimers as applicable within the reach of this beautiful trading analysis platform. Thanks to the developers of the program for this opportunity to use it freely to express our ideas to the community of traders.

Dow Futures Trading Strategy for 13th December 2024Dow Futures Trading Strategy
Key Levels:
Buy Above: 44,100 (on the high of the candle that closes above 44,100 on a one-hour chart)
Sell Below: 43,850 (on the low of the candle that closes below 43,850 on a one-hour chart)
Strategy Details:
Buy Signal: Enter a buy position above the high of the candle that closes above 44,100 on a one-hour time frame.
Sell Signal: Enter a sell position below the low of the candle that closes below 43,850 on a one-hour time frame.
Additional Tips:
Monitoring: Continuously monitor the one-hour chart for clear buy or sell signals.
Stop-Loss: Always use a stop-loss to manage risk and protect your capital.
Market Conditions: Stay updated on market news and events that could impact Dow Futures.
Disclaimer:
This analysis is for informational and educational purposes only. Please consult with a certified financial advisor before making any trading decisions.
