Nasdaq- Weekly - Looks over bought• On the weekly US 100 chart, the recent candle structure shows a clear loss of momentum near all-time highs. The shooting-star type candle near 26,000 indicates rejection from higher levels, meaning supply is emerging where demand earlier dominated.
• After this rejection, weekly price action has

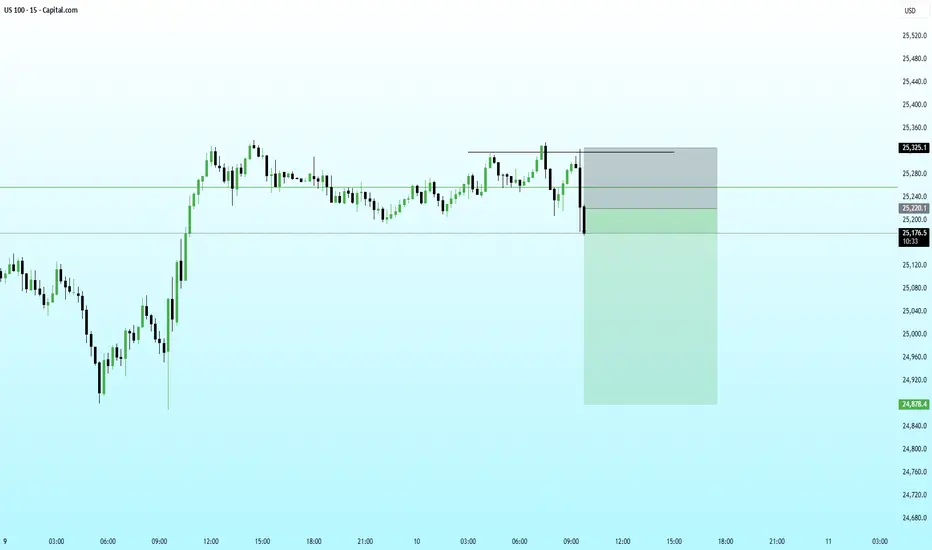
NAS100 – Range extension Play from discount area.🔍 Market Context
Nasdaq is currently reacting from a discount area with confluence from the 24700 support zone and the lower trendline support. Price has shown signs of holding this level, indicating a potential bullish pullback toward premium levels.
📘 Trade Idea (Long Bias)
Entry: 24700
Stop-Loss

NASDAQ SHOWING A GOOD UP MOVE WITH 1:8 RISK REWARD NASDAQ SHOWING A GOOD UP MOVE WITH 1:8 RISK REWARD
DUE TO THESE REASON
A. its following a rectangle pattern that stocked the market
which preventing the market to move any one direction now it trying to break the strong resistant lable
B. after the break of this rectangle it will boost the market

US100 (Nasdaq) – Structure & BiasPrice is currently trading inside a well-defined consolidation range, capped by a major resistance zone near 25,850–25,900 and supported around 25,230–25,250, which has acted as a strong demand flip multiple times.
The recent price action shows:
A liquidity sweep to the downside, followed by a sha

US100 | 15MNarrative Overview:
Following an aggressive sell-side liquidity raid, price delivered a reactive displacement from a higher-timeframe demand cluster, signaling the presence of institutional buy orders defending discount pricing. The rejection wick into the demand zone suggests a classic liquidity en

#NASDAQ FINAL DOWNWARD MOVE📊 Nasdaq Elliott Wave Update
The Nasdaq began its daily correction on 29 Oct 2025 📉, forming its A wave on 21 Nov 2025 with a low at 23,854.
- 🔎 The A wave unfolded in 3 subwaves, signaling a flat correction.
- 📈 As expected, the B wave retraced >61.8%, rising to 26,165.
Now, the index is

NAS-M15 BearishUS100 (Nasdaq) has just completed a **buyside liquidity sweep** above the prior intraday highs, followed immediately by **sharp rejection and bearish displacement**, signaling classic ICT-style distribution at premium.
The move above the highs was not acceptance but **engineered inducement**. Price
US100 (Nasdaq) – Intraday Short Setup | Smart Money Concept 🔍 Market Context
Price is currently trading near a strong premium supply zone with multiple confluences:
Previous Liquidity Sweep
Bearish BOS + CHoCH
Descending Trendline Resistance
Premium pricing zone (OTE area)
This indicates institutional selling pressure and a high-probability short opportunity

Nasdaq trade breakdown US Tech 100 (NASDAQ) – Intraday Bias & Supply Zone Reaction
Price has rallied into a key supply zone near the day high, where selling pressure is expected.
Overall higher-timeframe bias remains bearish (Daily & H4), while H1 shows a short-term bullish retracement into supply.
📌 Key Observations
Str

Trump Is More Volatile Than the MarketsIf you truly want to understand the stock market today, study Trump first.
If you understand Trump, you’ll start understanding everything else in the markets.
Why this is the BEST time to learn markets?
This phase forces you to understand how markets really work, not just charts:
Geopolitics (US–

See all ideas
Displays a symbol's value movements over previous years to identify recurring trends.