Nasdaq 100 under pressureAfter the Nasdaq 100 fell by more than 3% in the week ending Friday 21 November, the index may extend those losses in the coming days. Recently, the Nasdaq 100 has been trading in a downtrend. Momentum has weakened, as indicated by the relative strength index (RSI), which formed a bearish divergence from mid-September when it began making a series of lower highs while the Nasdaq 100 itself made higher highs. Currently, the RSI is around 43, indicating that the Nasdaq 100 is not yet oversold and may have further downside potential.
However, after trading along its lower Bollinger Band last week, the Nasdaq 100 yesterday recovered some of its recent losses and rose above that lower band. The index broke above resistance at 24,500 early on Monday and went on to pierce the 10-day exponential moving average near 24,700 as it climbed to 24,870 by Monday’s close. Whether this proves to be a temporary rebound remains to be seen, but for now the next significant resistance level is around the trendline near 25,000, followed by the 20-day moving average near 25,250.
Despite yesterday’s bounce, there has been considerable technical damage to the Nasdaq that needs to be repaired if the index is to make further gains. In the near term, the prevailing trend is likely to remain bearish. A break below 24,000 could set the stage for a decline towards 22,700.
Written by Michael J. Kramer, founder of Mott Capital Management.
Disclaimer: CMC Markets is an execution-only service provider. The material (whether or not it states any opinions) is for general information purposes only and does not take into account your personal circumstances or objectives. Nothing in this material is (or should be considered to be) financial, investment or other advice on which reliance should be placed.
No opinion given in the material constitutes a recommendation by CMC Markets or the author that any particular investment, security, transaction, or investment strategy is suitable for any specific person. The material has not been prepared in accordance with legal requirements designed to promote the independence of investment research. Although we are not specifically prevented from dealing before providing this material, we do not seek to take advantage of the material prior to its dissemination.
Trade ideas

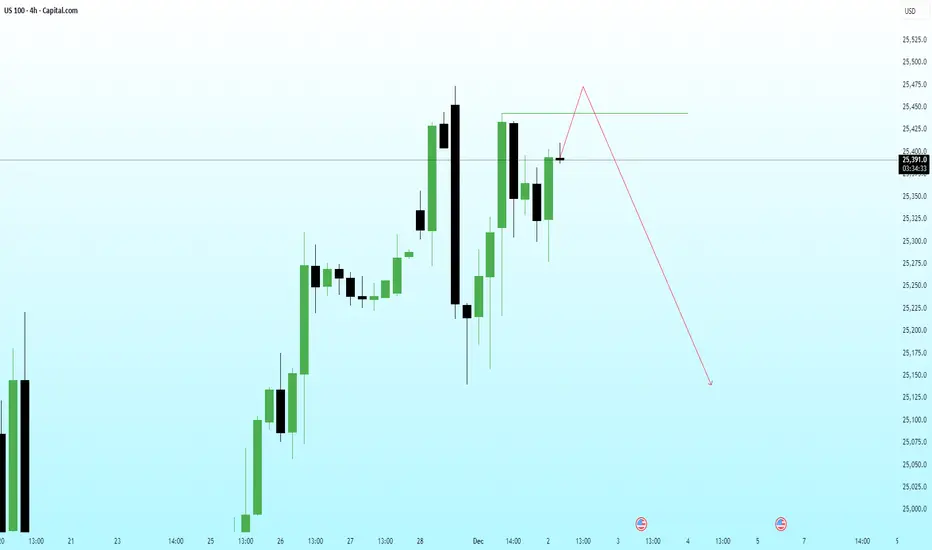
NAS100 – Anticipating a Liquidity Grab Before a Deeper CorrectioPrice is currently hovering just below the short-term resistance, displaying signs of exhaustion. I’m expecting one final push to sweep the liquidity sitting above the recent high (marked zone).
Once that engineered high is taken, a sharp reversal remains the highest-probability path—supported by higher-timeframe inefficiencies and unmitigated sell-side imbalance below.
Bearish Path:
• Sweep the recent high
• Fail to sustain above resistance
• Break structure
• Momentum-driven selloff toward the 25,150–25,180 zone
⚠️ ENTRY CONDITION (VERY IMPORTANT):
I will execute the trade only if the LTF shows the exact same sequence and confirmation that I’m expecting from the HTF. This is non-negotiable.
This scenario remains valid as long as price doesn’t gain acceptance above the marked resistance level.
Nasdaq Nasdaq is now scenario is sell buy trend change may take more then year let's wait and see let's share u r ideas

NAS100 Squeeze High on hourly Timeframe possible sharp fall downNAS100 is currently in a squeeze-high zone on the hourly timeframe, which often signals a potential sharp move down, especially with upcoming Fed news. This squeeze-high pattern typically represents an accumulation phase before smart money decides to make a significant move. In this case, it indicates that enough traders are trapped on the buy side, suggesting a possible sell-off when liquidity is collected.
Explanation (for your deeper understanding):
Squeeze High: When price pushes above recent highs but fails to continue, trapping breakout buyers.
Accumulation before a move: Institutions often build positions during such squeezes — they push prices to gather liquidity from retail traders before reversing.
Smart Money Behavior: If most liquidity remains above previous highs, a push into that area followed by rejection typically indicates that institutions are filling sell orders.
Fed News Impact: High-impact events like Fed announcements often provide the volatility needed for smart money to trigger these reversals.

NASDAQ - Possible moves [Wave Theory]I'm not an expert of wave theory but I have an inclination towards it. Wave theory is nothing short of brilliance!
NASDAQ seem to have completed its 5 waves and now following the ABC retracement wave.
NASDAQ:NDX should now move to its B wave and show some bounce. It should be followed by further downwards retracement during C wave. Trigger for C wave my be the FOMC meeting in Sept.
Let's see.
Disclaimer: I'm sharing my analysis. Wave theory is not my strong forte. Do your own research & analysis before taking any action.

NASDAQ 100 : This is going to hurt Chart is self explanatory. Refer to marked S/R Zones
- Divergent RSI
- NNH (Net new highs) dropping fast
- Anticipatory shorts are riskier but can give a great entry.
Stop Loss - 25200 DCB

buybuy ideaPirce trend go up long term and short term last week 1h break structure pirce pull back go to 1h poi then buy

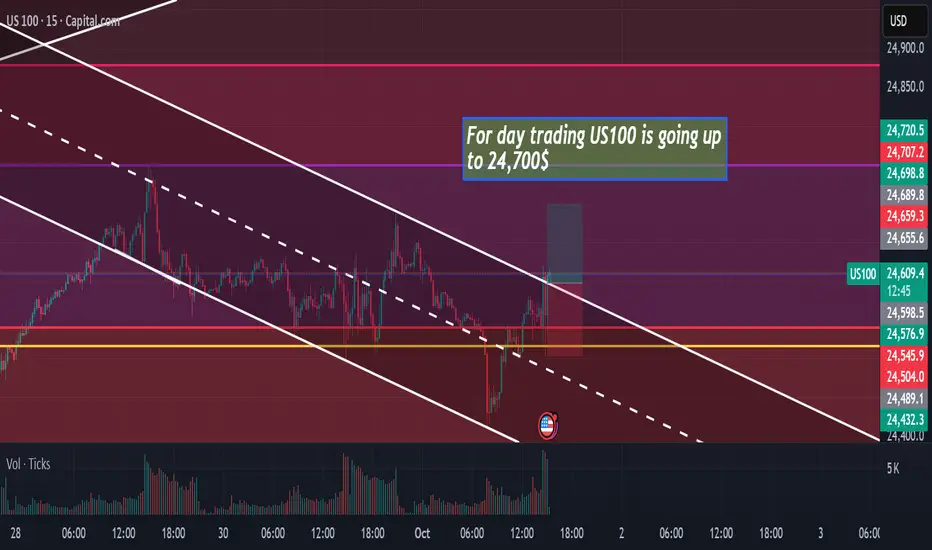
US100 is going UP TO 24,700$hello.
US100 is going up to 24,700$ in few minutes !! it's a buy opportunity on 15MIN time frame
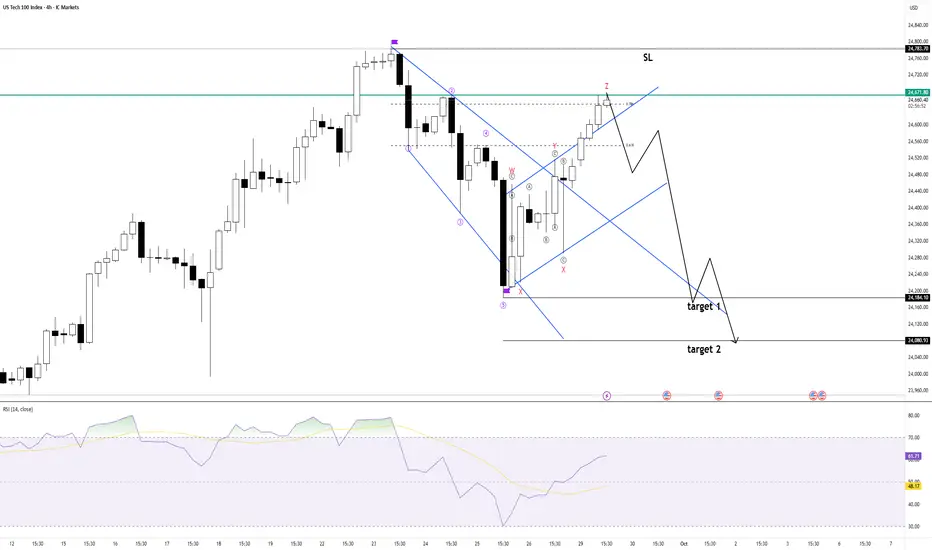
US Tech 100 in sellI see the good risk/reward ratio sell setup in US Tech 100 as elliot wave analysis. elliot wave analysis is very complex analysis method and it aways have alternate count, how ever i shorting US Tech 100 as it gives good risk/reward ratio.
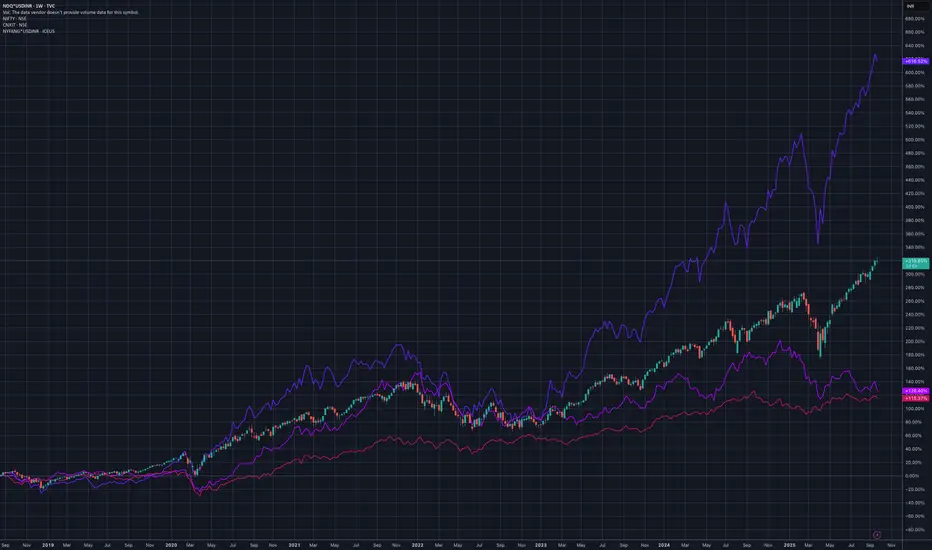
INR Adjusted NASDAQ 100 vs FANG+ vs NIFTY50 vs NIFTYITINR Adjusted NASDAQ 100 vs FANG+ vs NIFTY50 vs NIFTYIT
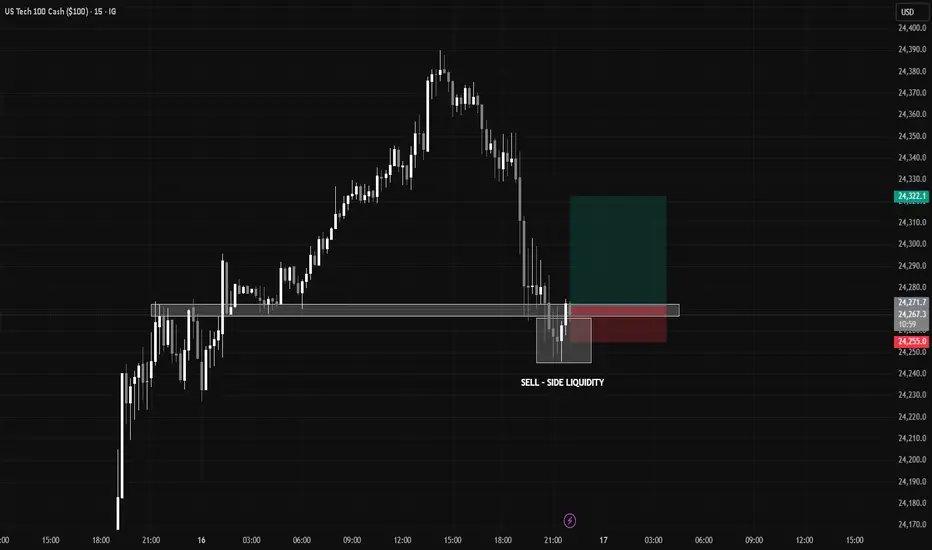
NQ-LONGSSELL-SIDE LIQUIDITY GRAB.
Lets see how liquidity sweep works. Perfect setup !!
Good 1:3 target
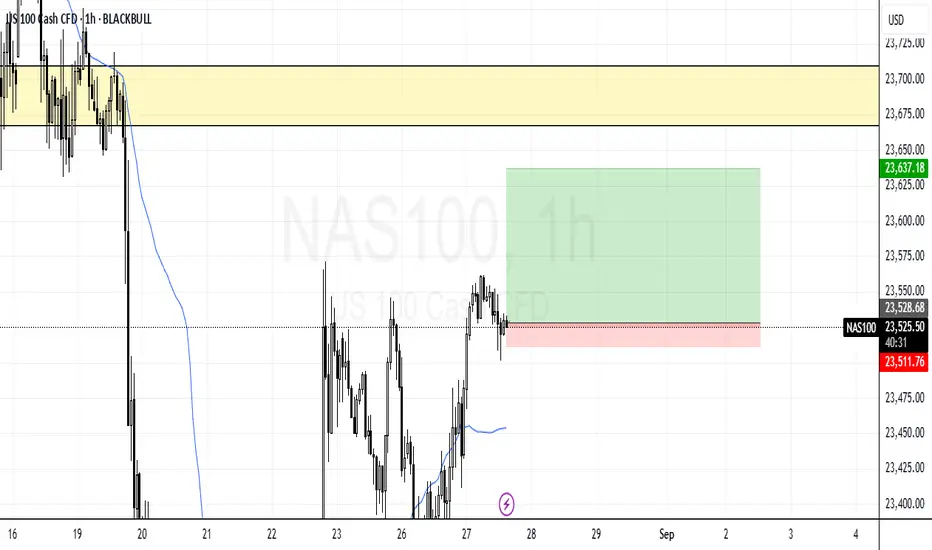
NAS100 Bearish Reversal from Supply Zone – Short SetupThe NAS100 (1H chart) is trading within a channel structure marked by a rejection line (resistance) and a support line. Price recently broke below the EMA (70 & 200), showing bearish momentum.
Supply Zone (POI): 23,524 – 23,637, where price may retest before further decline (potential short entry zone).
Trend: Current momentum is bearish after rejection from channel resistance.
Support/Target: Main downside target is 22,979 – 22,905, aligning with previous swing low and Fibonacci extension area.
EMA Strategy: Price below both 70 & 200 EMA indicates bearish trend continuation.
Structure Break: Breakdown of channel support suggests sellers are in control.
📌 Trading Plan:
Entry (Sell Zone): 23,524 – 23,637 (POI Supply Zone)
Stop Loss: Above 23,640 (channel resistance)
Target: 22,979 – 22,905
Conclusion:
Market is in bearish structure. Wait for pullback to supply zone for a high-probability short entry, targeting the lower support zone.

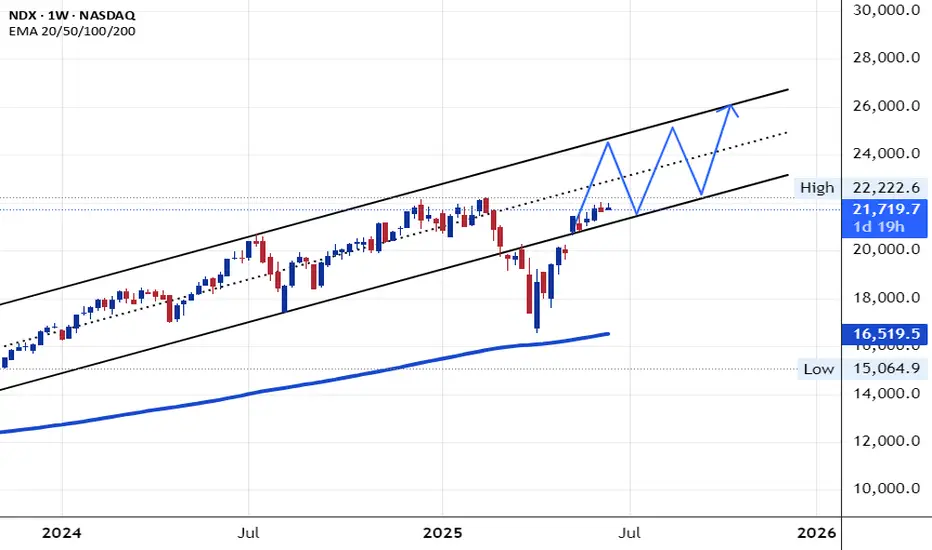
Trend Continuation setup Market is in Uptrend
weekly Upside
very risky trade .
Either wait in 4 HR but the target will be the same .
NAS100 (4H) – Bearish Channel Reversal Targeting 22,100Recently, price hit the channel top resistance (around 24,200–24,300), marked with a red arrow.
Bearish Setup
A large bearish arrow indicates a potential reversal from the channel top.
The shaded red zone shows a short trade setup, with stop-loss placed above the recent highs (~24,238).
The green shaded area is the invalidation zone (where bullish continuation is expected if price breaks higher).
Target
The downside target is clearly marked around 22,075 – 22,063, which aligns with previous support zones.
This target suggests a possible correction of around 1,600 points (~6.5%) if the bearish momentum plays out.
Candlestick Behavior
Price recently tested the upper boundary of the channel and failed to break higher, which strengthens the bearish bias.
The current 4H candle shows rejection from the channel top.
Trading Outlook
Bearish Bias: A short position is favored given the rejection at resistance.
Entry Zone: Near current levels (23,700–23,770).
Stop Loss: Above 24,250 (channel breakout invalidates bearish setup).
Take Profit: 22,100 zone (previous demand zone & marked target).
✅ Summary:
The NASDAQ 100 is showing signs of exhaustion at channel resistance. If sellers remain strong, we could see a correction toward 22,100. However, a breakout above 24,250 would invalidate this bearish setup and

Nasdaq Is Unable To Cross 23k Nasdaq Is Stuck Below 23k
Nasdaq Spent Time At Support of 22222
Range Is Small But Time Is Long Stay Calm Less Position Size

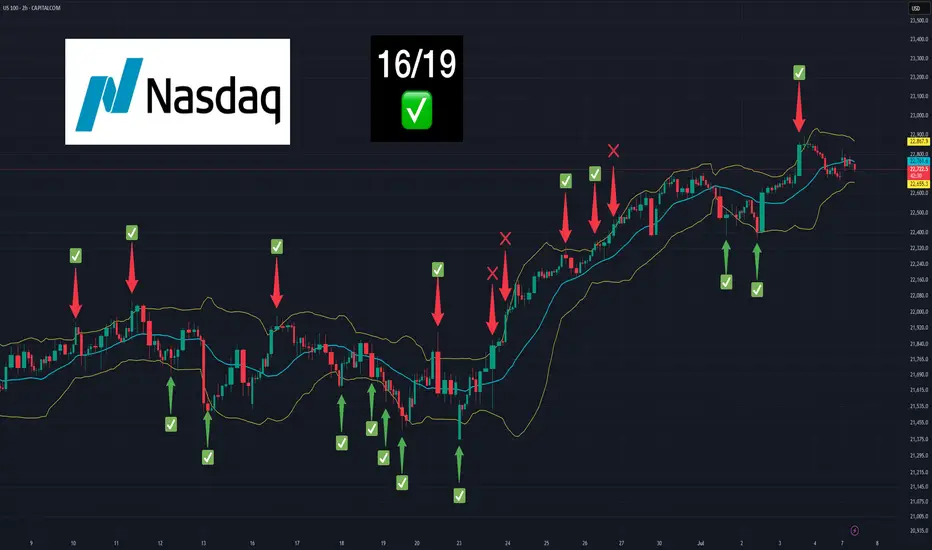
Bollinger Bands: How to Stop Being a Slave to the Markets.Bollinger Bands: How to Stop Being a Slave to the Markets.
Bollinger Bands are a technical analysis indicator widely used in trading to assess the volatility of a financial asset and anticipate price movements. Created in the 1980s by John Bollinger, they consist of three lines superimposed on the price chart:
The middle band: a simple moving average, generally calculated over 20 periods.
The upper band: the moving average to which two standard deviations are added.
The lower band: the moving average to which two standard deviations are subtracted.
These bands form a dynamic channel around the price, which widens during periods of high volatility and narrows when the market is calm. When a price touches or exceeds a band, it can signal an overbought or oversold situation, or a potential trend reversal or continuation, depending on the market context.
What are Bollinger Bands used for? Measuring volatility: The wider the bands spread, the higher the volatility.
Identifying dynamic support and resistance zones.
Detecting market excesses: A price touching the upper or lower band may indicate a temporary excess.
Anticipating reversals or consolidations: A tightening of the bands often heralds an upcoming burst of volatility.
Why is the 2-hour time frame so widely used and relevant?
The 2-hour (H2) time frame is particularly popular with many traders for several reasons:
Perfect balance between noise and relevance: The H2 offers a compromise between very short time frames (often too noisy, generating many false signals) and long time frames (slower to react). This allows you to capture significant movements without being overwhelmed by minor fluctuations.
Suitable for swing trading and intraday trading: This timeframe allows you to hold a position for several hours or days, while maintaining good responsiveness to take advantage of intermediate trends.
Clearer reading of chart patterns: Technical patterns (triangles, double tops, Wolfe waves, etc.) are often clearer and more reliable on H2 than on shorter timeframes, which facilitates decision-making.
Less stress, better time management: On H2, there is no need to constantly monitor screens. Monitoring every two hours is sufficient, which is ideal for active traders who don't want to be slaves to the market.
Statistical relevance: Numerous backtests show that technical signals (such as those from Bollinger Bands) are more robust and less prone to false signals on this intermediate timeframe.
In summary, the 2-hour timeframe is often considered "amazing" because it combines the precision of intraday trading with the reliability of swing trading, providing superior signals for most technical strategies, especially those using Bollinger Bands.
To summarize
Bollinger Bands measure volatility and help identify overbought/oversold areas or potential reversals.
The 2-hour timeframe is highly valued because it filters out market noise while remaining sufficiently responsive, making it particularly useful for technical analysis and trading decision-making.
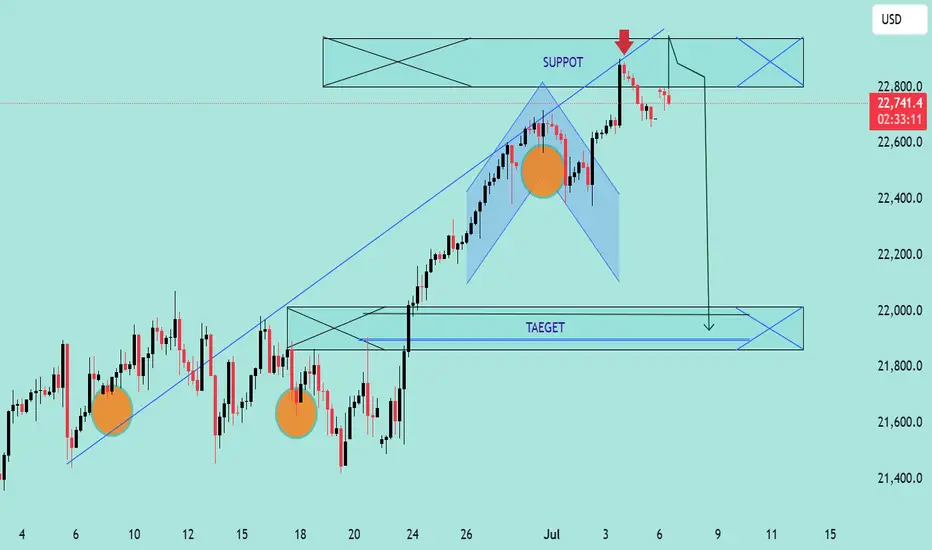
NASDAQ Potential Bearish Reversal Analysis NASDAQ Potential Bearish Reversal Analysis 🧠🔻
The chart illustrates a potential bearish setup forming after a recent uptrend in NASDAQ. Let's break it down professionally:
🔍 Technical Overview:
Ascending Trendline Break ✅
Price had been respecting a steady ascending trendline.
A break below this trendline indicates a possible momentum shift from bullish to bearish.
Bearish Pattern Formation 🔷
A bearish flag/pennant-like formation can be observed after the sharp rise.
This consolidation followed by a breakdown could be a continuation pattern, hinting at further downside.
Resistance Rejection 🔴
A red arrow marks a clear rejection from the resistance zone near 22,800 USD.
Strong wick rejections and bearish candles suggest selling pressure at that level.
Support Turned Resistance (SUPPOT 🛑)
The previously broken support zone is now acting as resistance (note: "SUPPOT" appears misspelled—should be "SUPPORT").
Bearish Target Zone 🎯
The chart marks a "TAEGET" zone (should be "TARGET") near the 21,900 – 22,000 USD range.
This aligns with prior consolidation and demand zones, making it a likely area for price to retrace.
📌 Key Zones:
Resistance (Rejection Area): 22,800 USD
Current Price: 22,739.7 USD
Bearish Target Zone: 21,900 – 22,000 USD
⚠️ Conclusion:
The market shows signs of a bearish reversal with a confirmed trendline break, resistance rejection, and bearish pattern formation. If the price fails to reclaim the 22,800 level, there’s a high probability of downward continuation toward the 22,000 target.
🧠🔻
The chart illustrates a potential bearish setup forming after a recent uptrend in NASDAQ. Let's break it down professionally:
🔍 Technical Overview:
Ascending Trendline Break ✅
Price had been respecting a steady ascending trendline.
A break below this trendline indicates a possible momentum shift from bullish to bearish.
Bearish Pattern Formation 🔷
A bearish flag/pennant-like formation can be observed after the sharp rise.
This consolidation followed by a breakdown could be a continuation pattern, hinting at further downside.
Resistance Rejection 🔴
A red arrow marks a clear rejection from the resistance zone near 22,800 USD.
Strong wick rejections and bearish candles suggest selling pressure at that level.
Support Turned Resistance (SUPPOT 🛑)
The previously broken support zone is now acting as resistance (note: "SUPPOT" appears misspelled—should be "SUPPORT").
Bearish Target Zone 🎯
The chart marks a "TAEGET" zone (should be "TARGET") near the 21,900 – 22,000 USD range.
This aligns with prior consolidation and demand zones, making it a likely area for price to retrace.
📌 Key Zones:
Resistance (Rejection Area): 22,800 USD
Current Price: 22,739.7 USD
Bearish Target Zone: 21,900 – 22,000 USD
⚠️ Conclusion:
The market shows signs of a bearish reversal with a confirmed trendline break, resistance rejection, and bearish pattern formation. If the price fails to reclaim the 22,800 level, there’s a high probability of downward continuation toward the 22,000 target.
NAS100 Bullish Breakout SetupNAS100 Bullish Breakout Setup 🚀
🧠 Chart Analysis (H4 timeframe)
🔹 Ascending Channel:
Price has been trending inside a clear ascending channel (blue zone), supported by higher highs and higher lows.
🔹 Support & Resistance:
Support: Around 21,635.32 – tested multiple times (highlighted by 🔵 arrows).
Resistance: Around 22,265.19 – recent highs and psychological barrier.
🔹 Double Bottom Formation 👣:
Near support zone, a potential double bottom (bullish reversal pattern) is visible. The neckline has been challenged.
🔹 Breakout Confirmation 🟢:
Price has broken above the descending neckline of the double bottom and is hovering near 21,644, indicating potential bullish continuation if sustained.
🔹 Target 🎯:
Projected breakout target lies at 22,265.19, aligning with the previous resistance zone.
🔹 Volume & Momentum 📊:
While not shown, a breakout above the neckline generally needs strong volume confirmation to validate the move.
📌 Conclusion:
If price sustains above the 21,635 – 21,644 area and gains momentum, the path to 22,265 looks likely ✅. However, a false breakout could drag the price back into the channel.

NASDAQ For Next 5 Yrs (2030) Today Is 19 June 2025 **NASDAQ** stands for the **National Association of Securities Dealers Automated Quotations**. It is one of the largest stock exchanges in the world and is based in the **United States**.
Here’s a simple explanation:
### 📌 **Key Points about NASDAQ:**
1. **Founded:** 1971, as the world's first electronic stock exchange.
2. **Type:** Fully electronic — trades are done through a digital platform (no physical trading floor).
3. **Location:** Headquartered in **New York City**, USA.
4. **Index:** Its most famous index is the **NASDAQ Composite**, which tracks over 3,000 companies, mainly in **technology, biotech, and growth sectors**.
5. **Companies Listed:** Includes giants like **Apple, Microsoft, Amazon, Google (Alphabet), Meta (Facebook), Nvidia**, etc.
6. **Tech Focus:** Known for being heavily weighted toward **technology and innovation-driven companies**.
7. **Other Indexes:** Includes **NASDAQ-100** (top 100 non-financial companies).
8. **Global Reach:** Allows foreign companies to list as well (e.g., from China, India, Europe).
9. **Market Cap:** Trillions of dollars in market capitalization.
10. **Owned By:** NASDAQ, Inc. — also operates other exchanges and market technology solutions globally.
Thanks & Regards
The Golden Farms of Equity

NASDAQ Projection **NASDAQ** stands for the **National Association of Securities Dealers Automated Quotations**. It is one of the largest stock exchanges in the world and is based in the **United States**.
Here’s a simple explanation:
### 📌 **Key Points about NASDAQ:**
1. **Founded:** 1971, as the world's first electronic stock exchange.
2. **Type:** Fully electronic — trades are done through a digital platform (no physical trading floor).
3. **Location:** Headquartered in **New York City**, USA.
4. **Index:** Its most famous index is the **NASDAQ Composite**, which tracks over 3,000 companies, mainly in **technology, biotech, and growth sectors**.
5. **Companies Listed:** Includes giants like **Apple, Microsoft, Amazon, Google (Alphabet), Meta (Facebook), Nvidia**, etc.
6. **Tech Focus:** Known for being heavily weighted toward **technology and innovation-driven companies**.
7. **Other Indexes:** Includes **NASDAQ-100** (top 100 non-financial companies).
8. **Global Reach:** Allows foreign companies to list as well (e.g., from China, India, Europe).
9. **Market Cap:** Trillions of dollars in market capitalization.
10. **Owned By:** NASDAQ, Inc. — also operates other exchanges and market technology solutions globally.
Thanks & Regards
The Golden Farms of Equity
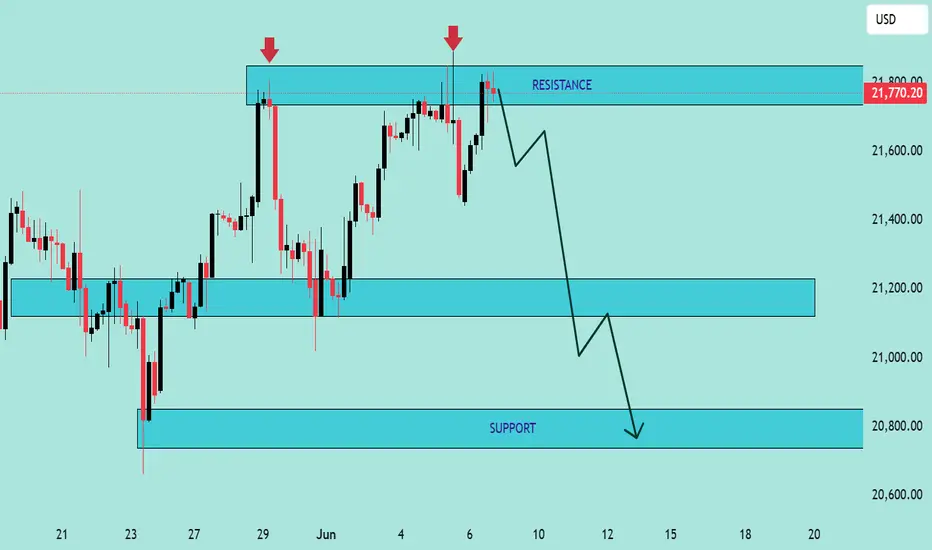
NAS100 Technical Analysis – Bearish Rejection at Resistance NAS100 Technical Analysis – Bearish Rejection at Resistance 🚨
📅 Date: June 6, 2025
📈 Instrument: NAS100 (US Tech 100 Index)
🔍 Chart Overview:
The price action shows a clear rejection from the 21,800 USD resistance zone, marked by two strong bearish wicks (indicated by red arrows 🔴). This level has proven to be a strong supply zone, as sellers repeatedly step in to push prices lower.
🔵 Key Zones:
🔺 Resistance Zone: 21,750 – 21,800 USD
✅ Multiple rejections and bearish pressure.
🔻 Support Zone 1: 21,100 – 21,200 USD
📍 Acts as a mid-range demand zone and a potential take-profit level for short positions.
📉 Support Zone 2 (Major): 20,700 – 20,850 USD
📦 High-probability bounce area due to historical demand.
🔄 Price Action Insight:
The chart outlines a bearish double rejection pattern at the resistance level.
The current candlestick setup suggests bearish momentum, with a potential drop toward the mid-support zone.
If the price breaks below the mid-support, it could cascade down toward the major support near 20,800 USD.
📌 Projected Move:
🔻 From current levels (~21,750), expect:
Pullback from resistance,
Target 1️⃣: 21,100 USD zone,
Target 2️⃣: 20,800 USD major support.
🚫 A clean break and close above 21,800 invalidates the bearish outlook and may trigger a bullish continuation.
✅ Conclusion:
The chart favors a short bias below the resistance zone. Patience is key—wait for confirmation (like a bearish engulfing or break of structure 📉) before entering positions.
📊 Always use risk management. Set stop-loss above resistance in case of reversal
NASDAQ100 Analysis – Key S/R Zones & Price Reaction Incoming NASDAQ100 Analysis – Key S/R Zones & Price Reaction Incoming! 🚨
🔍 Chart Breakdown:
This is a technical chart analysis of NASDAQ100 (NAS100) with defined Support and Resistance zones. The price is currently at 21,314.50, sitting below a critical decision area.
🧱 Key Zones:
🔵 Resistance Zone:
‣ 21,640 – 21,800
‣ Strong supply area where price sharply reversed previously.
‣ If price breaks above the mid resistance zone, a bullish move towards this level is likely.
🟩 Support + Resistance Flip Zone:
‣ 21,280 – 21,420
‣ Former support, now acting as resistance.
‣ Price is struggling to reclaim this zone.
‣ Acts as a key decision level.
🟢 Support Zone:
‣ 20,630 – 20,750
‣ Strong demand zone from which previous rallies initiated.
‣ Target if bearish rejection continues.
🔄 Price Action Insight:
Price is currently rejecting the Support-turned-Resistance zone.
There’s a clear bearish rejection at the mid-zone (S/R flip), forming a lower high structure.
📉 A breakdown from current levels could lead to a retest of the support zone at 20,700 area.
🟢 However, a successful reclaim and bullish confirmation above 21,420 could see price target the upper resistance at 21,800.
📌 Outlook:
🔽 Bearish Bias if price fails to break above 21,420 – possible drop to 20,700.
🔼 Bullish Reversal above 21,420 could drive price to 21,800.
📅 Date: June 1, 2025
🕒 Timeframe: Likely 1H or 4H chart
💬 “Respect the levels, not the noise.”
Trade safe! ✅

Nasdaq buy on dip until 20800 not break 21500-700 Target How to take trades using Harmonic pattern projection Trade setup is explained below :-
Entry : 1st SL point : 0% is recent top or bottom.
Trailing D: 15.1% is work as trailing SL of buy or sell trade if hit then we have to book profit
.If price goes below 2nd D 22.5% to 24.5% range then early traders can make fresh reversals trade after breaking 1st D 15.1% safe traders can reversal trade after breaking Point D 22.5.4% to 24.5% range
Targets :
Target T1 : 36.1% to 38.3%
Target T3 : 49.1% to 52.5%
T3: 60.9% to 64.8% is our 3rd Target since this is reversal zone so must book profit if break then take fresh trade again
Target T4 : 76.4% to 79.7%
Next Targets are 100% , 127.2% ,141.4% and final Target 161.8%.
How to take reversal trade :
If price going upside/ downside then then buy or sell levels appear on Chart ( Automatically show when price reach any reversal zone of harmonic projection ).
Trailing SL:
After reach 1st Target trail SL to just above or below cost ( for example we are holding sell trade from 100 1st Target 110 hit then move trailing sl to 104-105 and move SL as price move upside or Downside)
Re- Entry :
For Re-entry in any pull back Point D ( 15.1% ) is used for re-entry then SL recent high or low Point SL ( 0% ) .
Blue Line is 1st support/ Resistance
Green line is 2nd support/ resistance
Red line is 3rd Support/ resistance
