$TRX on the 30mins chart has formed a Inverse Head & Shoulders AMEX:TRX on the 30mins chart has formed a clear Inverse Head & Shoulders pattern ✅
🔹 Left Shoulder – 0.338
🔹 Head – 0.333
🔹 Right Shoulder – 0.337
🔹 Breakout neckline – around 0.341
✅ If price sustains above the neckline (0.341), momentum could push #TRX toward 0.345 → 0.351 → 0.360 in short-term.
⚠️ If it fails to hold, we may retest supports at 0.337 → 0.333.
Inverse H&S is typically a bullish reversal pattern, so watch for volume confirmation — if buyers step in, price could deliver a strong upside breakout.
TRXUSDT.3S trade ideas

Will TRON hit $1 Club?TRON rise has been nothing short of epic.
From $0.0068 at launch to $0.36 today, over 50x growth.
$1 isn’t a dream anymore… it’s getting closer every day.
Who’s ready for CRYPTOCAP:TRX to crash into the $1 club? 🚀
NFA & DYOR

TRX Long Swing Setup – Waiting for Pullback After Bullish RallyTRX has seen a strong rally over the past few days, and we’re now watching for a retracement into support. The $0.260–$0.262 zone offers a potential long spot entry as price cools off.
📌 Trade Setup:
• Entry Zone: $0.260 – $0.262
• Take Profit Targets:
o 🥇 $0.278
o 🥈 $0.292
• Stop Loss: Daily close below $0.249

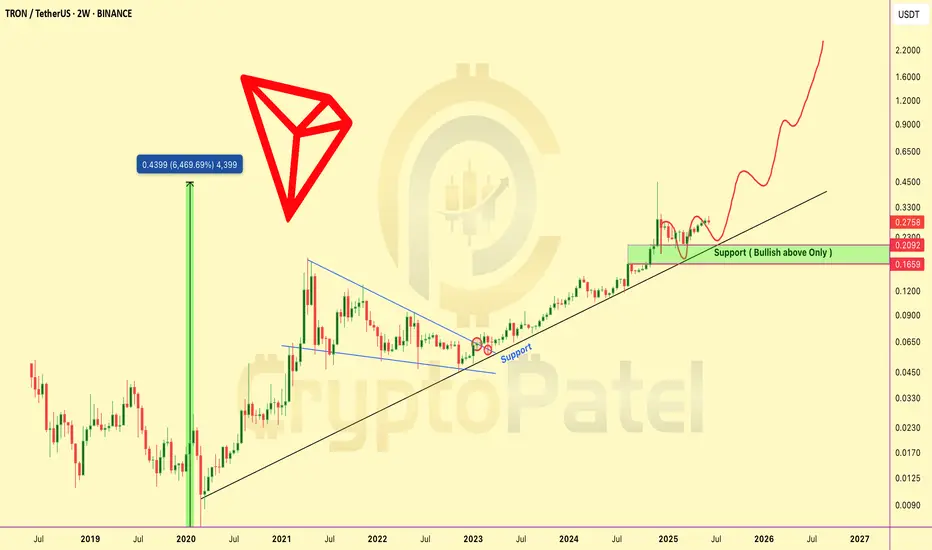
TRX NEXT EXPLOSION INCOMING? TRX NEXT EXPLOSION INCOMING?
TRX is showing a strong bullish setup after breaking out of a long-term consolidation pattern.
🔹 Price has cleanly broken out of a multi-year descending structure
🔹 Retested the key support zone around $0.21–$0.23
🔹 Still respecting the long-term ascending trendline from 2020
🔹 Historical move: 6,469% rally in the previous cycle — current structure suggests similar potential
Key Technical Levels to Watch:
🟩 Support Zone: $0.209–$0.230
🟩 As long as TRX holds above this level, bias remains bullish
🟩 This is a breakout + retest scenario.
🟩 Potential Upside Targets: $0.65 → $1.20 → $2.20+
The chart structure is indicating the possibility of a strong uptrend continuation, with bullish momentum building on higher timeframes.
TRX is technically strong and could be gearing up for a major leg higher if key support holds.
Add it to your watchlist. NFA & DYOR
#TRON to $1? Highly Possible! But Gold Entry is Key #TRON to $1? Highly Possible! But Gold Entry is Key 🚀
📉 Best Accumulation Zone for CRYPTOCAP:TRX : $0.140 - $0.10
🏆 Patience & Strategy Win the Game!
NFA. DYOR!
CRYPTOCAP:TRX #Altcoins

$TRX hit our 200% target as predicted! 🚀 CRYPTOCAP:TRX hit our 200% target as predicted!
Tron is showing strong momentum, and I still believe $1 is possible this bull run!
📉 Best buy zone: $0.180 - $0.160 (if we get it).
Who’s holding TRX to $1?
RT & Like if you’re bullish! 🔄

Trx offering good opportunity to grab.Tron chart showing clear breakdown in 4hr candle and have a 10% upside potential.

CATEGORY - TRUMP TEAM TOKENS - TRX !
1. After the pump to new all-time highs (0.45), there was a 50% pullback, which eliminated even leveraged positions with 2 leverage!
2. The range of 0.22 - 0.29 was formed, where within this range, the buyer's defensive reaction to the level of 0.22 was obtained 2 times.
3. A clear volume pattern (marked with a red arc) on the OBV chart shows the dominance of buyers and the expectation of continued growth
EXPECTATIONS: the best entry point was already on 20.01 at a price of about 0.23 and I missed it(
Next, I expect growth to the upper limit of the range (0.29), consolidation of the hike to historical highs

TRON bullish toward $0.5 ?#TRON is looking bullish!
All resistance levels have been broken, and it's now heading toward $0.30-$0.50. I'm expecting a 200-300% upward move from here.
Strong support at $0.140

TRX TronBINANCE:TRXUSDT BINANCE:TRXUSDT.P
#TRX is in a cautious climb, sitting around 0.16006 after a recent pullback. The chart shows a steady upward trend with gradual gains, indicating that the bulls are testing the waters. There's a key zone between 0.16143 and 0.16483 that might act as a decision point. If the bulls push through with confidence, we could see an attempt toward 0.16837 and possibly higher. However, if it stalls here, we might see some consolidation or a retest of the support around 0.15671. This could be a pivotal moment for TRX as it navigates between these critical levels.

TRXUSDTWe can accumulate trx at current price for mention elliot waves, this is the second time i am posting trx chart. TRX is stil bullish for me. This crypto is sideways from a long time and form a descending triangle and as per Elliot wave analysis we can see a third wave in this crypto. I have mention two levels as per third wave analysis we can see a downfall from this two point the it will form a 4-5 wave . then it will go on
let's see how it will perform
Thanks
ishu prajapati

TRON View!A well-known figure in the crypto industry, Justin Sun, founder of TRON
TRXUSD
and chief adviser to Huobi, opened up in an unusual post on social networks. In particular, he responded to rumors regarding his Bitcoin investments.
Sun expressed confidence in Bitcoin's future but clarified that he did not take a long position at the $69,000 price level.
I am very optimistic about the development of Bitcoin and have great confidence in its future. However, I would like to clarify that I did not go long on Bitcoin at the $69,000 price l

Justin Sun Reveals Gas-Free Stablecoin Transfers on TRON NetworkTRON founder Justin Sun announced that his team is developing a stablecoin solution to increase institutional adoption of such assets.
On July 6, Sun revealed that a gas-free stablecoin solution will launch on the TRON network in the fourth quarter of this year.
Gas-Free Stablecoin Solution
Sun explained that this innovation means users will not need to pay a gas fee for stablecoin transactions. Instead, the stablecoins will cover the fees themselves. This solution will initially be available on the TRON Network before expanding to Ethereum and other Ethereum Virtual Machine (EVM)-compatible public chains.

Will TRX Price Cross $0.5 Mark This Year?Tron has a market cap of $10 Billion and is ranked 16th in the cryptoverse. The VM ratio of the asset price is 0.02 with a drop of 7% in the volume. TRX is currently trading near the value of $0.11 with a drop of 0.14% in the intraday session.
TRX token price is currently seeing a weak consolidation on the daily chart. It is trading below the 50 and 100 EMA with a negative crossover in the past. The upside trend of TRX price can see a halt near $0.2. Meanwhile the support price can be seen near $0.09.
The RSI of the token price is currently near 44 with a negative slope in it. The overall sentiment of the indicator is bearish in nature.


The Tussle Between Justin Sun Vs SEC Continues
Tron is a blockchain based operating system developed by the tron foundation in 2017. Initially the token was launched in the Ethereum blockchain and later it was moved into its own blockchain.It supports various types of smart contracts and dapps.
Recently Tron foundation alongside Justin sun, Bittorrent and Rainberry submitted a new pre-motion letter on May 2. It proposed a plan for moving to reject the SEC revised complaint. The given document also says that the defendants and SEC have agreed on a briefing schedule without the need for a pre-motion conference unless deemed necessary as per the data revealed by cryptodaily.

Tron is gaining movement in bullish wedge and heading to 0.15$Tron is continuously trading in long time bullish wedge and now it's gaining momentum after touch the bottom of this wedge if it's true it can touch 0.150 mark very soon.

TRXUSDTI am watching this crypto from a long time , this crypto is sideways from a long time and form a descending triangle and as per Elliot wave analysis we can see a third wave in this crypto. I have mention two levels as per third wave analysis we can see a downfall from this two point the it will form a 4-5 wave . then it will go on
let's see how it will perform
Thanks
ishu prajapati


shortit is taking resistance again in previous rejection and we can expect fall again from current level


trx behivour this idea only learning purpose so let's start here we seen minor trend id down but support would be work like seen in pic than more chnace to reverse up side
