ITC 1D Time frame📊 Updated Snapshot
Current Price: ~₹405
Day Range: ₹402 – ₹410
52-Week High: ₹499
52-Week Low: ₹399
📈 Technical Outlook
Support Zones:
Strong support at ₹405 (current zone)
Next support at ₹398
Resistance Zones:
Immediate resistance at ₹410–₹416
Next resistance at ₹421
Trend Bias: Weak bearish → stock is near 52-week low, testing crucial support.
📌 Step-by-Step View
If it holds above ₹405–₹398: Buyers may step in, possible bounce toward ₹416–₹421.
If it breaks below ₹398: More downside risk opens, weakness can extend further.
Upside revival only above ₹421 closing: That will change trend toward bullish.
ITCGX trade ideas
Trading Platforms and Software Innovations1. Evolution of Trading Platforms
1.1 Traditional Trading Methods
Before the advent of electronic platforms, trading was conducted manually on exchange floors. Key features of traditional trading included:
Open outcry system: Traders would shout bids and offers in trading pits.
Manual record-keeping: Orders were recorded by hand or using simple ledger systems.
Limited access: Only brokers and institutional traders had direct access to the market.
Despite its effectiveness at the time, traditional trading was slow, prone to errors, and lacked transparency.
1.2 Emergence of Electronic Trading
The late 1970s and 1980s marked the beginning of electronic trading. The introduction of computers and telecommunication networks allowed exchanges to digitize order matching. Key milestones included:
NASDAQ (1971): One of the first electronic stock markets, allowing automated quotes.
Electronic Communication Networks (ECNs): Platforms like Instinet facilitated electronic trading between institutions.
Automated order routing: Brokers could send client orders directly to exchanges electronically.
This shift significantly improved speed, transparency, and accessibility.
1.3 Rise of Online Retail Trading
The 1990s and early 2000s saw the democratization of trading due to the internet. Retail investors gained direct access to markets via online trading platforms. Features included:
Real-time market quotes.
Portfolio tracking tools.
Commission-based trading at lower costs.
Interactive charts and research tools.
Companies like E*TRADE, TD Ameritrade, and Interactive Brokers played pivotal roles in popularizing retail online trading.
2. Components of Modern Trading Platforms
Modern trading platforms integrate multiple functionalities to serve the needs of diverse market participants. Key components include:
2.1 User Interface (UI) and User Experience (UX)
A well-designed UI/UX allows traders to navigate the platform efficiently. Features include:
Customizable dashboards: Displaying watchlists, orders, charts, and news.
Drag-and-drop tools: Simplifying order placement and portfolio management.
Mobile access: Smartphone apps ensure trading on-the-go.
2.2 Market Data Integration
Accurate and real-time market data is crucial for decision-making. Platforms typically provide:
Live quotes: Stock, commodity, forex, and crypto prices.
Depth of market: Showing bid-ask spreads and liquidity levels.
News and analytics feeds: Financial news, macroeconomic data, and research reports.
2.3 Order Execution and Routing
Efficient order execution is the heart of any trading platform. Innovations include:
Direct market access (DMA): Enables traders to send orders directly to exchanges.
Smart order routing (SOR): Automatically finds the best price across multiple exchanges.
Algorithmic order execution: Minimizes market impact and slippage.
2.4 Risk Management Tools
Modern platforms provide tools to monitor and mitigate trading risks:
Stop-loss and take-profit orders: Automatic risk control measures.
Margin and leverage tracking: Ensuring compliance with regulatory requirements.
Real-time P&L analysis: Assessing profitability and exposure.
3. Types of Trading Platforms
3.1 Broker-Hosted Platforms
These platforms are offered by brokerage firms and allow traders to access various markets. Examples include:
Interactive Brokers’ Trader Workstation (TWS): Known for advanced tools and global market access.
TD Ameritrade’s thinkorswim: Focused on derivatives and technical analysis.
3.2 Direct Market Access Platforms
DMA platforms provide institutional traders with direct connection to exchanges. Features include:
High-speed execution.
Access to multiple liquidity pools.
Customizable algorithmic trading strategies.
3.3 Algorithmic and Quantitative Platforms
Algorithmic trading platforms are designed for automated trading strategies. Features include:
Backtesting modules: Simulate strategies using historical data.
Execution algorithms: VWAP, TWAP, and iceberg orders.
Integration with programming languages: Python, R, and C++ for strategy development.
3.4 Cryptocurrency Trading Platforms
The rise of digital assets has led to specialized crypto trading platforms:
Centralized exchanges (CEX): Binance, Coinbase, Kraken.
Decentralized exchanges (DEX): Uniswap, PancakeSwap.
Features include crypto wallets, staking, lending, and advanced charting tools.
4. Software Innovations in Trading
4.1 High-Frequency Trading (HFT)
HFT uses ultra-fast algorithms to execute trades in milliseconds or microseconds. Innovations include:
Colocation services: Servers placed near exchange data centers for speed.
Latency optimization: Minimizing delays in data transmission.
Statistical arbitrage: Exploiting tiny price discrepancies.
HFT has transformed equity, forex, and derivatives markets by increasing liquidity but also raising regulatory concerns.
4.2 Artificial Intelligence and Machine Learning
AI-driven trading platforms analyze large datasets to detect patterns and make predictions:
Predictive analytics: Forecasting price trends and volatility.
Natural language processing (NLP): Extracting insights from news, earnings reports, and social media.
Reinforcement learning: Adaptive algorithms learning from market behavior in real-time.
4.3 Cloud-Based Platforms
Cloud technology has made trading platforms more scalable and accessible:
Remote accessibility: Traders can access platforms from anywhere without local installation.
Scalable computing resources: Handle large datasets and backtesting efficiently.
Lower operational costs: Eliminates the need for expensive on-premise infrastructure.
4.4 Social Trading and Copy Trading
Social trading platforms allow users to follow and replicate trades of successful traders:
Interactive features: Chat, news feeds, and performance rankings.
Copy trading automation: Replicates trades in real-time.
Community-driven insights: Encourages collaboration and learning.
4.5 Mobile and App-Based Innovations
Mobile platforms have made trading instantaneous:
Push notifications for market alerts.
Touch-based order execution.
Integration with digital wallets and payment gateways.
5. Security and Compliance Innovations
With the growth of online trading, security and regulatory compliance have become critical. Innovations include:
5.1 Encryption and Secure Authentication
Two-factor authentication (2FA): Adds extra layer of security.
End-to-end encryption: Protects sensitive data.
Biometric verification: Fingerprint and facial recognition.
5.2 Regulatory Technology (RegTech)
Platforms integrate tools to monitor compliance with global regulations.
Automated reporting and audit trails for regulators.
Anti-money laundering (AML) and Know Your Customer (KYC) protocols.
5.3 Fraud Detection and Risk Analytics
Real-time monitoring of suspicious trading activities.
AI-driven anomaly detection.
Protection against insider trading and market manipulation.
6. Impact of Trading Platform Innovations
The innovations in trading software have profoundly impacted the financial markets:
Increased Market Efficiency: Faster execution reduces arbitrage opportunities.
Democratization of Trading: Retail investors gain access to tools previously reserved for institutions.
Enhanced Risk Management: Automated tools minimize human errors and manage exposure.
Global Market Access: Traders can operate across multiple time zones and asset classes.
Data-Driven Decision Making: Advanced analytics empower informed trading strategies.
7. Challenges and Future Trends
7.1 Challenges
Despite advancements, trading platforms face challenges:
Cybersecurity threats: Constantly evolving attacks.
Regulatory hurdles: Different jurisdictions impose varying requirements.
Market volatility risks: Algorithmic errors can exacerbate market swings.
Technology costs: High-speed trading infrastructure is expensive for small traders.
7.2 Future Trends
Integration of AI and Quantum Computing: Ultra-fast predictive models and optimization.
Expansion of DeFi and Blockchain Platforms: Transparent, decentralized trading systems.
Personalized Trading Experiences: AI-driven insights tailored to individual traders.
Sustainable and ESG Trading Platforms: Tracking environmentally and socially responsible investments.
Virtual Reality (VR) Trading: Immersive trading environments for enhanced visualization and analysis.
Conclusion
Trading platforms and software innovations have transformed financial markets by enhancing speed, accessibility, and efficiency. From the manual open-outcry systems to AI-driven, cloud-based, and mobile platforms, technology has democratized trading and empowered traders with unprecedented tools and insights. As technological advances continue, the future of trading platforms promises even greater integration of AI, blockchain, and personalized experiences, shaping a new era of intelligent and efficient financial markets.
The evolution of trading platforms underscores the symbiotic relationship between technology and finance, where innovations drive market growth, risk management, and accessibility for participants across the globe.

ITCITC Daily Snapshot
Current Price: ~₹405
Day’s Range: ~₹401 – ₹406
🔍 Key Levels
Support: Around ₹399 – ₹401 (near-term buying zone)
Resistance: Around ₹409 – ₹412 (supply zone)
📈 Technical Picture
Trend: Slightly bearish to sideways, but stabilizing above ₹405 gives some strength
RSI (Daily): Neutral zone, neither overbought nor oversold
Moving Averages: Price is close to short-term averages, so a decisive breakout above ₹409 is needed for bullish confirmation
VWAP: Trading near VWAP, showing balance between buyers and sellers
✅ Summary
At ₹405, ITC is near the middle of its range.
If it holds above ₹405 and breaks ₹409–₹412, bullish momentum can pick up.
If it falls below ₹401, it may retest support near ₹398.
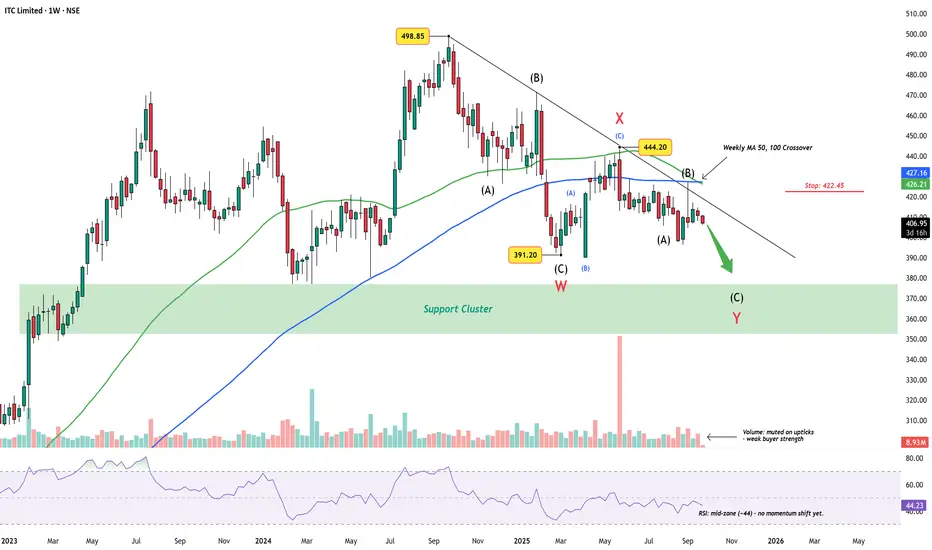
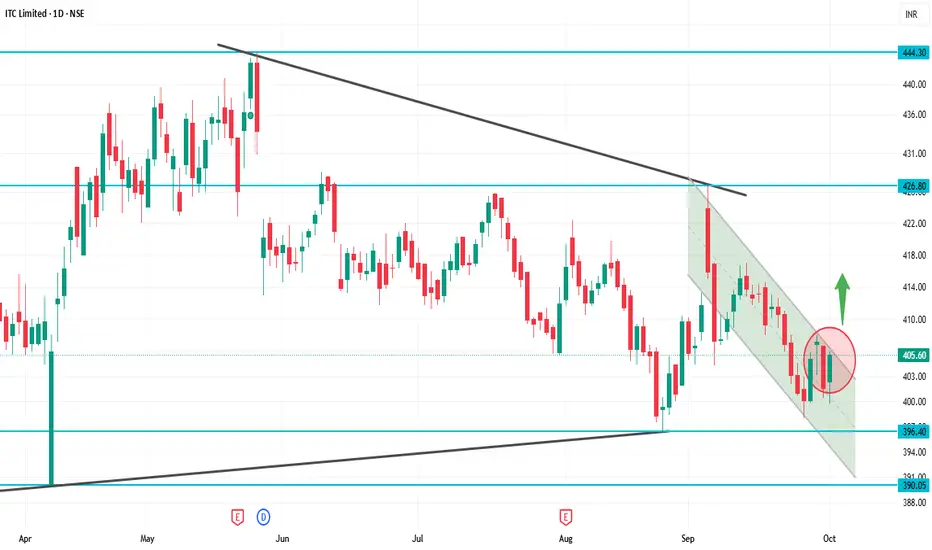
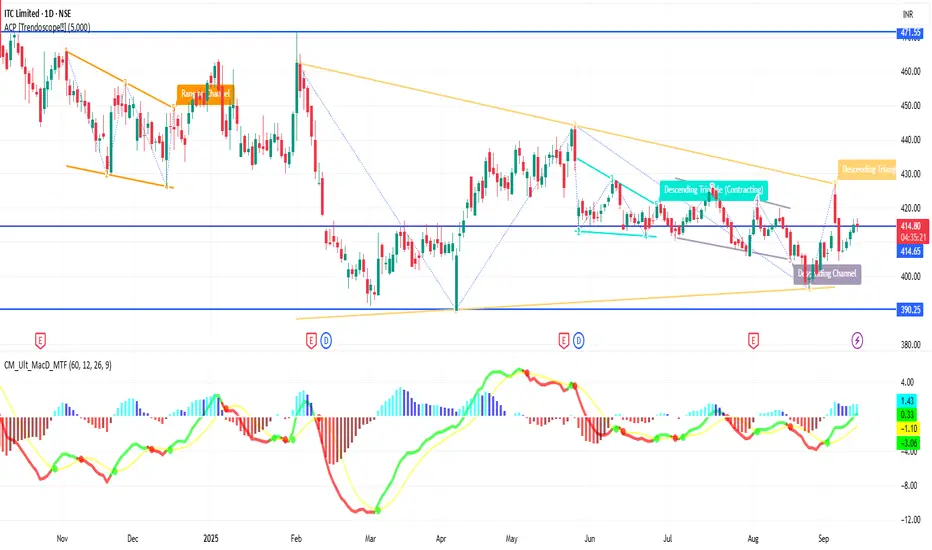
ITC Limited Weekly Chart – Wave Y Targets Support ClusterITC has been trending lower since the ₹498.85 peak, carving out what appears to be a complex W-X-Y correction. The first leg (W) found support near ₹391.20, followed by a corrective bounce into X at ₹444.20. The decline since then has kept price under a descending trendline, respecting the larger corrective rhythm.
Wave Count
Wave W: Completed into the ₹391.20 low.
Wave X: Counter-trend rally capped at 444.20.
Wave Y: Now unfolding, with sub-wave (C) still incomplete.
The broader structure hints that ITC may continue toward the support cluster (₹350–375) before this correction runs its course.
Indicators
Volume : Muted on upticks – rallies lack buying strength.
RSI (~44) : Mid-zone, leaving space for further downside before oversold conditions.
Weekly 50/100 MA crossover : Adds weight to the ongoing corrective bias.
Invalidation
A decisive break above ₹422.45 and sustained strength beyond 427 would question this bearish view, hinting at a possible shift back to bullish sequences.
Summary
Unless ITC reclaims higher ground above 422.45, the bias stays toward a Wave Y completion in the support cluster zone.
Disclaimer: This analysis is for educational purposes only and does not constitute investment advice. Please do your own research (DYOR) before making any trading decisions.
ITC 1D Time frameCurrent Price: ₹405.60
52-Week High: ₹524.35
52-Week Low: ₹390.15
Trend: Downward — trading below 5, 20, 50, 100, 200-day moving averages
Daily Chart Insights
Price below moving averages → bearish trend.
RSI & MACD → weak momentum, signaling short-term selling pressure.
Support zone at ₹390–₹400 → critical; a break below can push price down to ₹370–₹380.
Resistance at ₹420–₹430 → a strong close above may signal trend reversal.
Strategy / Outlook
Bearish Bias: Short-term trend is downward.
Buying Opportunity: Near support zones (₹390–₹400) if it holds.
Bullish Trigger: Close above ₹430 with strong volume indicates potential reversal.
Risk Management: Use stop-loss below critical support zones.
ITC 1D Time frameCurrent Price: Please confirm, but ITC is trading near 440–445 zone recently.
Current Trend: Stock is in consolidation after a recent decline; sideways movement visible.
Support Zone: Strong support lies at 435 – 438. If this holds, stock may bounce.
Resistance Zone: Major resistance is around 450 – 455. A breakout above 455 can bring fresh upside.
Indicators: Daily candles show buyers trying to defend lower levels, but volume is moderate.
Outlook:
Above 455 → bullish momentum may return.
Below 435 → weakness can extend toward 425.
👉 In short:
Range: 435 – 455.
Neutral tone, waiting for breakout.
Options Trading Boom1. The Evolution of Options Trading
Options trading has been around for centuries. Its earliest form can be traced back to ancient Greece, where philosopher Thales is said to have used olive press contracts to profit from harvest predictions. But modern options markets began to take shape in the 20th century.
1973 – The CBOE (Chicago Board Options Exchange) was founded, creating the first organized exchange for standardized options contracts.
The same year, the Black-Scholes Model was introduced, giving traders a mathematical framework to price options.
In India, options trading was introduced much later — in 2001, with stock options and index options gradually gaining traction.
For decades, options were mostly used by large investors for hedging risks. Retail participation was limited due to complexity, lack of awareness, and accessibility issues. However, the landscape has dramatically changed in the last decade.
2. Why the Boom?
The options trading boom is the result of multiple forces coming together. Let’s look at the major drivers:
(a) Technology and Trading Platforms
Advances in online brokerages, mobile apps, and real-time data have made options trading accessible to millions. Earlier, one needed a broker and significant capital, but today platforms like Zerodha, Upstox, Robinhood, and Interactive Brokers allow users to trade with just a few clicks.
(b) Low Cost and Leverage
Options provide huge leverage. For a small premium, traders can control large positions in underlying stocks or indices. This attracts both speculators and small retail investors looking for high returns with low capital.
(c) Market Volatility
Periods of high volatility (such as the COVID-19 pandemic and global economic uncertainty) have made options attractive. Traders use them to profit from large price swings or hedge risks in turbulent times.
(d) Retail Investor Participation
The rise of financial literacy, YouTube channels, Telegram groups, and online communities has led to an explosion in retail participation. People now see options as a way to grow wealth faster than traditional investing.
(e) Globalization and FOMO
The success stories of options traders in the U.S. (like those from the WallStreetBets community during the GameStop saga) have inspired traders worldwide. Fear of missing out (FOMO) has further accelerated participation.
3. Options Trading in Numbers
The boom is not just hype; it’s backed by hard data.
U.S. Markets: In 2021, options trading volumes hit record highs, with over 9.9 billion contracts traded, surpassing stock trading volumes.
India: NSE (National Stock Exchange) has emerged as the largest derivatives exchange in the world by volume, thanks to the surge in index options trading. Weekly expiry contracts on Nifty and Bank Nifty see massive participation.
China & Europe: Options markets are growing, although regulatory frameworks differ.
These figures highlight the shift from equities to derivatives as the preferred playground for traders.
4. Types of Options Strategies Driving Popularity
Options aren’t just about buying calls and puts; their real beauty lies in the ability to craft strategies for different market conditions. Some of the most popular strategies include:
Covered Call Writing – Investors hold stocks and sell call options to generate income.
Protective Put – Buying puts to protect against downside risks.
Straddle/Strangle – Profiting from volatility by buying both calls and puts.
Iron Condor & Butterfly Spread – Neutral strategies that profit from limited price movement.
These strategies make options versatile. Whether the market is bullish, bearish, or range-bound, traders can position themselves accordingly.
5. Options and Retail Traders
Retail traders are at the heart of this boom. Several factors explain their surge in participation:
Lower Entry Barriers: Small capital requirements make it easier for new traders to start.
Educational Content: Online tutorials, courses, and trading communities have simplified concepts.
Gamification of Trading: Apps provide user-friendly interfaces, notifications, and even rewards, making trading engaging.
Short-Term Thrill: Options provide quick results, unlike traditional investing, which takes years.
But while retail participation has democratized finance, it has also raised concerns about reckless speculation.
6. Risks in the Options Boom
The boom is exciting, but it comes with risks. Many traders underestimate the complexities of options and focus only on quick profits.
Leverage Risk: Small premiums can lead to big losses if the market moves against the trader.
Lack of Knowledge: Many retail traders jump in without understanding Greeks (Delta, Theta, Vega, Gamma).
High Failure Rate: Studies show that a large percentage of retail traders lose money in options.
Addiction to Trading: Options can be addictive due to their casino-like thrill.
This is why experts stress on risk management, position sizing, and proper education.
7. Institutional Players and Market Makers
The options boom isn’t just retail-driven. Institutional investors, hedge funds, and market makers also play a major role.
Hedging: Institutions use options to protect large portfolios.
Liquidity: Market makers provide liquidity by continuously buying and selling contracts.
Algorithmic Trading: Quant funds use algorithms to exploit pricing inefficiencies in options.
This mix of retail enthusiasm and institutional sophistication adds depth to the market.
Opportunities in the Options Boom
The boom isn’t just about trading; it has created opportunities in multiple areas:
Education & Training: Demand for options trading courses and mentorship has skyrocketed.
Technology Startups: Fintech firms building options analytics tools are flourishing.
Content Creation: Influencers and educators focusing on options have large audiences.
Brokerages & Exchanges: Higher volumes mean more revenue for exchanges and brokers.
Conclusion
The options trading boom is a defining trend of modern financial markets. It represents the democratization of sophisticated financial instruments that were once restricted to big players. Today, a college student with a smartphone can access the same markets as a hedge fund manager.
But this democratization comes with responsibilities. While options offer flexibility, leverage, and opportunities, they also demand knowledge, discipline, and risk management. Traders who treat options like a casino may lose big, while those who master strategies can use them to build wealth and manage risks effectively.
The boom is not a bubble; it’s an evolution in how markets operate. Options are here to stay, and their influence will only grow in the coming years. Whether you’re a retail trader, an institutional investor, or a policymaker, understanding the dynamics of this boom is essential for navigating the future of finance.
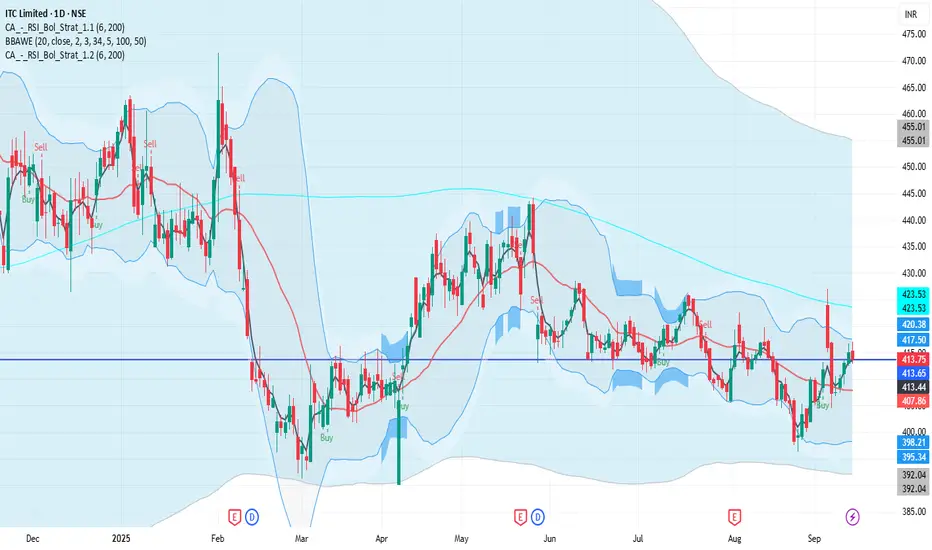
ITC 1D Time framePrice Action
Current Price: ₹413.75 (approx)
Day’s Range: ₹413.05 – ₹414.30
52-Week Range: ₹390.15 – ₹528.50
🔹 Support & Resistance
Immediate Support: ₹410 – ₹408
Next Support: ₹402 – ₹397
Immediate Resistance: ₹416 – ₹420
Next Resistance: ₹422 – ₹428
ITC 1D Time frame📉 Current Market Snapshot
Previous Close: ₹413.05
Day's Range: ₹412.85 – ₹417.05
52-Week High: ₹528.50
52-Week Low: ₹390.15
Market Cap: ₹5.18 lakh crore
Dividend Yield: ~3.47%
P/E Ratio: 25.9
ROE: 27.3%
ROCE: 36.8%
Debt-to-Equity Ratio: 0.00
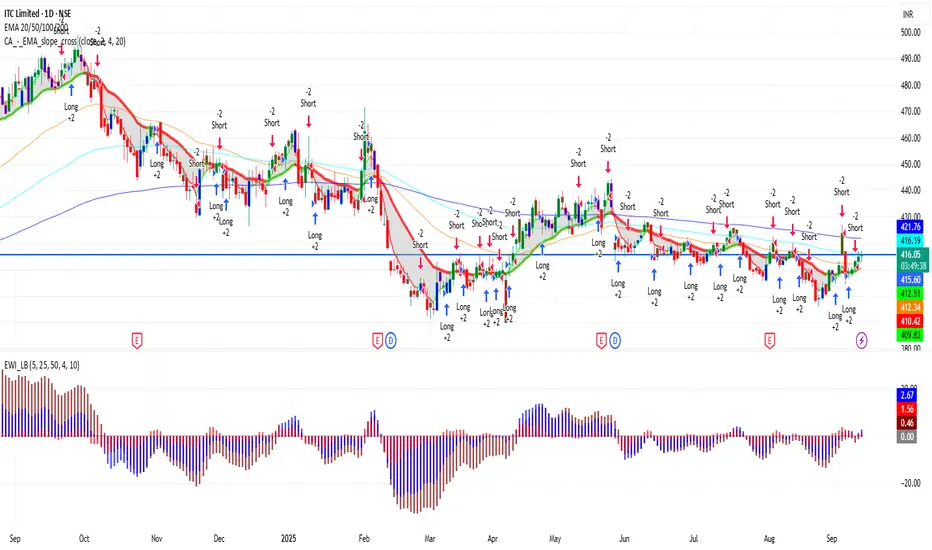
ITC 1D Time frame🔢 Current Level
ITC is trading around ₹413 – ₹416
🔑 Key Resistance & Support Levels
Resistance Zones:
₹416 – ₹421 (near-term resistance; breakout above this may lead to further upside)
₹420 (psychological resistance)
₹428 (stronger resistance above)
Support Zones:
₹412 – ₹413 (immediate support)
₹410 (short-term support; break below may indicate weakness)
₹398 – ₹400 (deeper support zone)
📉 Outlook
Bullish Scenario: If ITC holds above ₹412 – ₹413, upward momentum may continue. Break above ₹417 – ₹420 can open the way toward ₹428+.
Bearish Scenario: If it falls below ₹410, risk increases toward ₹398 – ₹400.
Neutral / Range: Between ₹412 – ₹417, ITC may consolidate before a directional move.
ITC 1D Time frame🔢 Current Level
Trading around ₹414 – ₹432
🔑 Key Resistance & Support Levels
Resistance Zones:
₹435 – ₹438 (near-term resistance; breakout above this may lead to further upside)
₹442 (stronger resistance above)
Support Zones:
₹425 – ₹428 (immediate support)
₹420 (stronger support if price dips further)
₹415 – ₹417 (deeper support zone)
📉 Outlook
Bullish Scenario: If ITC holds above ₹428, upward momentum may continue. Break above ₹438 can open the way toward ₹442+.
Bearish Scenario: If it falls below ₹420, risk increases toward ₹415 – ₹417.
Neutral / Range: Between ₹428 – ₹438, ITC may consolidate before a directional move.
All negative news brushed aside is positiveITC Technical Analysis (CMP: 415)
Key Observations:
- Small corrections indicate strength, suggesting the uptrend remains intact.
-
- Fibonacci Analysis: The stock's reversal before the first support at 375 demonstrates buying interest and strength.
-
- RSI Analysis: The oscillator's decline to support levels, while the stock's price correction is minimal, indicates underlying strength.
- Moving Averages: The convergence of MAs suggests the stock is poised for a directional move.
-
- Trendline Analysis: A weekly close above the trendline would confirm the bullish outlook.
Conclusion: With all oscillators at support levels, it's likely that the correction is nearing its end, setting the stage for a potential upside move.

ITC 1D Time frame📍 Current Price Action
Current price around ₹415
Day’s range: ~ ₹412 – ₹417
52-week range: ~ ₹390 – ₹528
⚙ Technical Indicators
RSI (14): ~65 → bullish momentum, nearing higher strength
MACD: Positive → supports upside bias
ADX (14): High (≈ 60-65) → strong trend strength
Stochastic / Williams %R: Showing overbought signals → risk of short-term pullback or consolidation
📊 Moving Averages & Trend Structure
Short/medium/long-term moving averages (10, 20, 50, 100, 200 day) largely give buy signals
The 5-day MA is slightly below current price → short-term pullback potential
🔧 Support & Resistance Levels
Immediate Support: ~ ₹410
Next Support Zone: ~ ₹405 – ₹400
Immediate Resistance / Pivot Territory: ~ ₹416 – ₹417
Higher Resistance: ~ ₹420 – ₹422 (if the current resistance is cleared)
🧠 Summary
ITC is in a bullish trend on the daily chart with strong momentum and multiple indicators supporting upward move. But since some overbought signals are showing up, there’s a chance for a pullback or consolidation near resistance. Key to watch: holding above ₹410 keeps the bullish bias. Breaking above ~₹416-417 convincingly could open up room toward ~₹420+. If price falls below support near ₹405-410, downside risk increases.

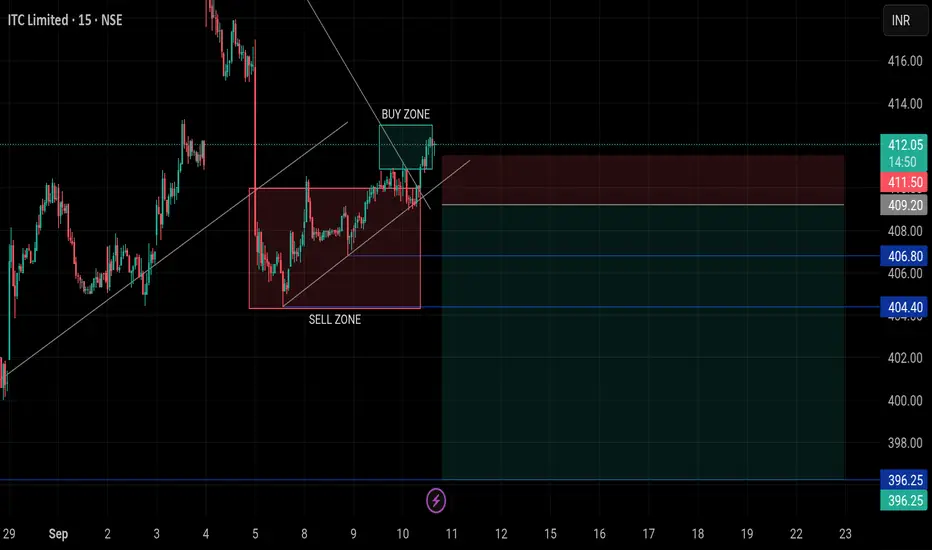
ITC | Sell Setup | 10 Sep 2025 – 13:30 IST📊 ITC | Sell Setup | 10 Sep 2025 – 13:30 IST
Buy Zone: 412.95 – 410.90
Sell Zone: 410.00 – 404.30
Scenario : Sell
Entry: 409.20
Stop Loss: 411.50
Targets:
TP1 → 406.80
TP2 → 404.40
TP2 → 396.25
Analysis:
From Sell Zone (410.00 – 404.30) creates possibilities for a sell move.
Stay alert on updates here.
⚠️ Disclaimer: This idea is shared for educational purposes only and should not be considered financial advice. Please do your own analysis before making trading decisions.
Impact of Rupee-Dollar Exchange Rate on Indian StocksIntroduction
The stock market is a complex system where numerous factors—both domestic and global—interact to determine price movements. One such crucial factor is the exchange rate between the Indian Rupee (INR) and the US Dollar (USD). The Rupee-Dollar exchange rate plays a vital role because the US Dollar is the world’s reserve currency, the primary medium of global trade, and a benchmark for financial transactions worldwide.
In India, the economy is deeply interconnected with global trade, capital flows, and financial markets. Any change in the value of the Rupee against the Dollar has wide-ranging implications on businesses, investors, and the stock market. Companies that import raw materials or export finished goods, sectors like Information Technology (IT), Pharmaceuticals, Oil & Gas, Banking, Aviation, and even Foreign Institutional Investors (FIIs), are directly influenced by these fluctuations.
This essay explores in detail how the Rupee-Dollar exchange rate impacts Indian stocks, covering the theoretical background, sectoral influences, investor behavior, macroeconomic effects, and real-world case studies.
Understanding the Rupee-Dollar Exchange Rate
The exchange rate refers to how much one unit of a currency is worth in terms of another. In India, the exchange rate most closely tracked by investors is INR/USD—the number of Rupees required to buy one US Dollar.
If 1 USD = ₹80, it means that importing something worth $1 will cost ₹80 in India.
If the Rupee depreciates (falls in value), say 1 USD = ₹85, imports become more expensive, but exporters receive more Rupees for the same Dollar earnings.
If the Rupee appreciates (gains in value), say 1 USD = ₹75, imports become cheaper, but exporters earn fewer Rupees per Dollar.
This constant push-and-pull directly influences corporate profitability and, in turn, the stock market.
Why Does the Rupee Move Against the Dollar?
The exchange rate fluctuates due to a combination of domestic and global factors:
Demand & Supply of Dollars – If India imports more than it exports, demand for Dollars rises, weakening the Rupee.
Foreign Institutional Investment (FII) Flows – When FIIs invest in Indian equities, they bring in Dollars, strengthening the Rupee. Conversely, when they pull out, the Rupee weakens.
Interest Rate Differentials – Higher interest rates in the US attract global investors, increasing demand for Dollars.
Crude Oil Prices – India is heavily dependent on crude imports. Rising oil prices increase Dollar demand, weakening the Rupee.
Geopolitical Events – Wars, sanctions, and global economic slowdowns push investors toward the Dollar as a "safe haven."
Inflation & Growth Rates – Higher inflation in India compared to the US reduces the Rupee’s purchasing power.
These factors cause daily volatility in the Rupee-Dollar exchange rate, impacting stock prices.
The Link Between Exchange Rate and Stock Market
The Rupee-Dollar relationship influences stocks in three broad ways:
Corporate Earnings Impact – Companies that earn or spend in Dollars see changes in profitability.
Foreign Investor Behavior – FIIs track currency stability before investing in emerging markets like India.
Macroeconomic Sentiment – A stable Rupee improves confidence, while sharp depreciation raises concerns about inflation, current account deficit, and fiscal health.
Sector-Wise Impact of Rupee-Dollar Exchange Rate
1. Information Technology (IT) Sector
Indian IT companies like TCS, Infosys, Wipro, and HCL earn the majority of their revenue in Dollars by exporting software services to the US and Europe.
A weak Rupee is positive for IT stocks since they earn more Rupees for the same Dollar revenue.
Example: If Infosys earns $1 billion, at ₹80/USD revenue = ₹80,000 crore. If Rupee falls to ₹85/USD, revenue = ₹85,000 crore (without increasing actual Dollar earnings).
Impact: Rupee depreciation → IT stocks rally. Rupee appreciation → IT stocks face margin pressure.
2. Pharmaceutical Sector
Similar to IT, Pharma companies like Sun Pharma, Dr. Reddy’s, and Cipla export a large share of medicines to the US.
A weak Rupee boosts export revenues, but import costs (like Active Pharmaceutical Ingredients from China) may rise.
Impact: Net positive for export-oriented pharma firms, but mixed for those heavily dependent on imports.
3. Oil & Gas Sector
India imports over 80% of its crude oil needs, priced in Dollars.
A weak Rupee makes oil imports costlier, increasing input costs for companies like IOC, BPCL, HPCL.
This also impacts sectors like aviation, paints, fertilizers, and chemicals, which rely on crude derivatives.
Impact: Rupee depreciation hurts oil & gas and related sectors.
4. Aviation Industry
Airlines like IndiGo, SpiceJet, and Air India earn revenue in Rupees but pay for aircraft leases, maintenance, and fuel in Dollars.
A weak Rupee increases costs significantly, leading to lower margins.
Impact: Rupee depreciation is negative for aviation stocks.
5. Banking & Financial Services
Banks with significant foreign borrowings may face higher repayment costs when the Rupee falls.
However, if they hold Dollar assets, they benefit.
Investor sentiment in the financial sector often mirrors overall macroeconomic stability tied to currency movements.
6. Import-Oriented Companies
Sectors like electronics, automobiles, FMCG (raw materials), and chemicals rely on imports.
A weaker Rupee raises raw material costs, compressing margins unless passed on to consumers.
7. Export-Oriented Manufacturing
Sectors like textiles, gems & jewelry, and leather benefit from a weaker Rupee as global buyers pay in Dollars.
However, if raw materials are imported, the benefits get diluted.
Impact on Foreign Investors
Foreign Institutional Investors (FIIs) are among the biggest drivers of the Indian stock market.
Stable Rupee: Encourages FIIs to invest since currency risk is lower.
Weakening Rupee: Even if stock returns are strong, FIIs may lose money when converting Rupees back to Dollars.
Example: If Nifty rises 10% but the Rupee falls 8% against the Dollar, FIIs net only ~2% returns.
Sudden depreciation often triggers FII outflows, leading to stock market corrections.
Thus, exchange rate stability is as important as stock fundamentals in attracting foreign capital.
Macroeconomic Effects on Stock Market
Inflation: A weak Rupee increases import costs (oil, electronics, machinery), leading to inflation. High inflation reduces corporate margins and consumer demand, pressuring stocks.
Current Account Deficit (CAD): Higher import bills widen CAD, weakening investor confidence.
Government Fiscal Position: Subsidy burdens (fertilizers, fuel) rise with Dollar appreciation, impacting fiscal deficit and bond yields, indirectly affecting equities.
Monetary Policy: RBI may raise interest rates to defend the Rupee, impacting borrowing costs and stock valuations.
The Way Forward
India’s growing integration into the global economy ensures that the Rupee-Dollar dynamic will continue to influence stocks. Key trends to watch:
US Federal Reserve policies – Dollar movements globally.
Energy Transition – Reducing oil imports will lower currency vulnerability.
Boosting Exports – Government initiatives like PLI schemes strengthen export-led sectors.
RBI Interventions – Maintaining stability via forex reserves.
Conclusion
The Rupee-Dollar exchange rate is more than just a number—it’s a reflection of India’s economic health, trade balance, and global investor confidence. Its impact on the stock market is far-reaching:
Exporters like IT and Pharma gain from Rupee weakness.
Import-heavy sectors like oil, aviation, and FMCG suffer.
Investors—both domestic and foreign—adjust portfolios based on currency trends.
Macroeconomic stability is closely linked to exchange rate dynamics.
For stock market participants, understanding this relationship provides an edge in making informed investment decisions. In the long run, India’s structural reforms, increasing exports, and growing financial depth may reduce vulnerability to Rupee-Dollar volatility. Until then, every swing in the currency will continue to ripple across Dalal Street.
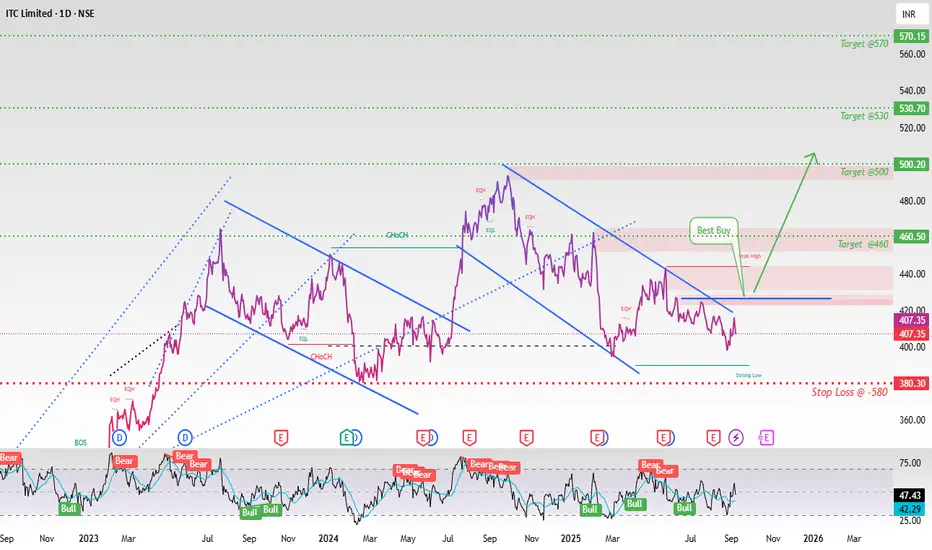
ITC Ltd – Trade IdeaNSE:ITC
ITC Ltd – Trade Idea
Recommendation : BUY
Entry Level : Above ₹425+
Stop Loss : Below support zone of **₹480**
Target Levels : ₹460 / ₹500 / ₹530 / ₹570
---
**Technical Rationale* *
* ITC is forming a **Flag & Pole pattern**, a bullish continuation setup indicating potential for further upside once the consolidation ends.
* Sustaining above ₹425 will likely confirm the breakout, opening room for higher targets.
* Support is well-placed near ₹480; holding this level keeps the bullish momentum intact.
---
**Fundamental Snapshot**
* **P/E Ratio**: \~14.92 – attractive compared to FMCG peers, suggesting reasonable valuation.
* Diversified business model across Cigarettes, FMCG, Hotels, Paper & Agri.
* Strong balance sheet with robust cash flows and healthy dividend payout.
---
**Outlook**
The confluence of **bullish technical structure (flag & pole)** and **comfortable valuations** makes ITC a favorable candidate for **swing to positional trades**.
Risk is well-defined with support near ₹480, while upside potential remains strong toward ₹570 levels.
---
Thanks & Happy Trading
Disclaimer:
This idea is only for educational purposes,
Please Trade at your own RISK''
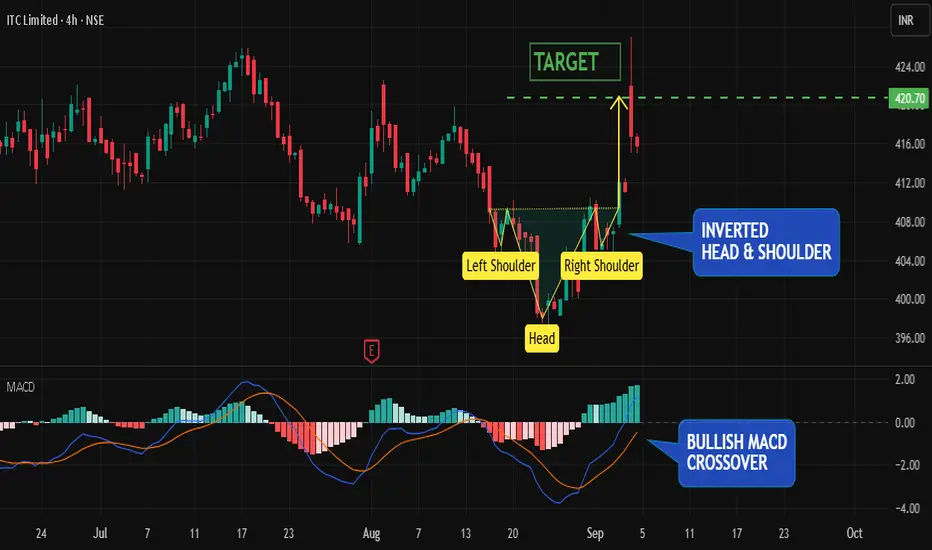
ITC Breaks Higher on Inverted Head & Shoulders Breakout-> Inverted Head & Shoulders Pattern -
ITC recently completed an Inverted Head & Shoulders formation , a strong bullish reversal pattern. The breakout above the neckline signaled renewed buying interest, and recent price action confirmed that momentum with a decisive upward move.
-> Bullish MACD Crossover -
Adding strength to the breakout, the MACD line crossed above the Signal line few days back, confirming a bullish crossover. This technical indicator reinforces the positive sentiment and indicates strong momentum building in favor of the bulls. The combination of pattern breakout and indicator alignment explains recent upward surge.
=> NOTE -
Bullish momentum of this pattern is over as target has been reached
Inflation Nightmare1. Introduction: Understanding Inflation
Inflation is one of the most powerful forces shaping economies, markets, and daily life. It refers to the general increase in prices of goods and services over time, reducing the purchasing power of money. While moderate inflation is normal in growing economies, an inflation nightmare occurs when prices spiral out of control, destabilizing societies and threatening livelihoods.
To visualize:
If a loaf of bread cost ₹50 last year but now costs ₹100, people feel the direct pinch.
If wages don’t rise as fast as prices, living standards fall.
If inflation expectations rise, people rush to buy today rather than tomorrow, fueling more inflation.
An inflation nightmare is not just about economics; it is also about psychology, politics, and survival.
2. Normal Inflation vs. Inflation Nightmare
Mild/healthy inflation (2–4% per year): Supports growth, encourages spending and investment.
High inflation (6–10% per year): Hurts savings, reduces confidence, and strains households.
Hyperinflation (50%+ per month): Total collapse of currency value, leading to social unrest and chaos.
An inflation nightmare lies in the last two categories—when price rises become unbearable and unpredictable.
3. Causes of Inflation Nightmare
(a) Demand-Pull Inflation
“Too much money chasing too few goods.” When demand surges faster than supply, prices rise. Example: booming economies after wars.
(b) Cost-Push Inflation
When production costs (wages, raw materials, oil, transport) rise, businesses pass costs to consumers. Example: Oil price shocks in the 1970s.
(c) Monetary Expansion
Excessive printing of money by central banks dilutes value. Example: Zimbabwe (2008), Venezuela (2010s).
(d) Supply Chain Disruptions
Pandemic lockdowns, trade wars, and shipping crises push prices higher. Example: Global supply crunch during COVID-19.
(e) Geopolitical Conflicts
Wars and sanctions disrupt trade flows, raising energy and food costs. Example: Russia-Ukraine war impacting wheat, oil, and gas prices globally.
(f) Inflation Expectations
If people believe inflation will rise, they demand higher wages, buy goods early, and businesses raise prices preemptively—creating a self-fulfilling spiral.
4. The Anatomy of an Inflation Nightmare
An inflation nightmare often unfolds in three stages:
Warning Signs – Rising food, rent, and fuel prices, currency weakening, fiscal deficits.
Acceleration Phase – Prices rise monthly, people lose trust in currency, hoarding begins.
Crisis & Collapse – Hyperinflation, barter trade, dollarization, social unrest, political change.
5. Global Case Studies of Inflation Nightmares
(a) Weimar Germany (1920s)
Reparations after WWI and money printing caused hyperinflation.
At peak, prices doubled every 3 days.
Workers were paid twice daily, rushing to buy bread before prices rose.
(b) Zimbabwe (2008)
Government printed excessive money.
Inflation reached 79.6 billion % in one month.
100 trillion Zimbabwean dollar notes became worthless.
(c) Venezuela (2013–2019)
Oil crash + political instability.
Inflation crossed 1,000,000%.
Shortages of medicine, food, and essentials.
(d) Turkey (2021–2023)
Currency crisis and unorthodox monetary policy.
Inflation surged above 80%.
People shifted savings to dollars and gold.
(e) Argentina (Recurring crises)
Chronic fiscal deficits and weak currency.
Inflation near 100% in 2022–2023.
Savings eroded, economy dollarized unofficially.
These examples show how inflation nightmares devastate middle-class savings, destroy business confidence, and topple governments.
6. Impact of Inflation Nightmare
(a) On Households
Shrinking purchasing power.
Rising food, rent, and utility costs.
Erosion of savings and pensions.
Decline in living standards.
(b) On Businesses
Rising input costs.
Uncertainty in planning and investment.
Pressure to increase prices, risking demand collapse.
(c) On Investors
Bonds and fixed deposits lose value.
Stock markets volatile.
Safe havens like gold and real estate gain.
(d) On Governments
Pressure to increase subsidies and social spending.
Difficulty in borrowing as bond yields rise.
Risk of political instability and protests.
(e) On Global Trade
Exchange rate volatility.
Higher import bills for energy and food.
Capital flight to stable economies.
7. Why Inflation Nightmares are Dangerous
Uncertainty: People don’t know future prices, making planning impossible.
Wealth Destruction: Savings, pensions, and salaries evaporate in real terms.
Inequality: Rich hedge via assets, poor suffer most.
Loss of Trust: Citizens lose faith in government and currency.
Social Chaos: Strikes, protests, and riots often follow.
8. Inflation Nightmare in the 2020s Context
COVID-19 pandemic: Stimulus packages + supply bottlenecks fueled inflation.
Russia-Ukraine War: Spikes in oil, gas, and food prices globally.
Climate Change: Crop failures push food inflation higher.
De-dollarization debates: Weakening confidence in traditional reserve currencies.
Countries like Sri Lanka (2022) faced an inflation nightmare with shortages of fuel, medicine, and food—leading to political collapse.
9. Coping Mechanisms during an Inflation Nightmare
(a) Individual Level
Shift savings to inflation-protected assets (gold, real estate, equities).
Cut discretionary spending.
Focus on skills that secure wage growth.
(b) Business Level
Hedge raw material costs.
Diversify suppliers.
Innovate with technology to reduce costs.
(c) Government Level
Tight monetary policy (raise interest rates).
Fiscal discipline (reduce deficit spending).
Strengthen currency reserves.
Subsidies for essentials to protect poor households.
10. Lessons from History
Prevention is better than cure: Once hyperinflation starts, it is hard to stop.
Trust is key: Currency depends on people’s confidence.
Independent central banks are vital for credibility.
Diversification of economy prevents over-dependence (like Venezuela on oil).
Conclusion
An inflation nightmare is more than rising prices—it is the collapse of trust in money itself. History shows how devastating it can be, destroying middle-class security, collapsing businesses, and reshaping politics.
While moderate inflation is a sign of growth, uncontrolled inflation can become a nightmare—haunting economies for decades. The key lies in responsible policies, diversified economies, and resilient households.
Just like nightmares disturb our sleep, inflation nightmares disturb the dream of economic stability.
Options OI Trade Outlook — Bullish Setups Only________________________________________
📊 Options OI Trade Outlook — Bullish Setups Only
“This analysis is shared purely for educational purposes and market awareness — not a trading recommendation.”
(Educational Purpose | Not Financial Advice | SEBI Compliant)
Hello Traders 👋,
Here are today’s 7 Bullish Option Setups based on OI + Price Action + IV + Greeks study.
This is strictly for learning and educational purposes only.
________________________________________
🟢 1. ITC 410 CALL
LTP: 7.25
Sentiment: Bullish | Trend: Up | Strength: 5/5 (Strong)
IV: 13.3 | Delta: 0.55 | Theta: -0.20 | Vega: 0.46
Buildup: Long Build-up
Why?
410 CE shows a strong Long Build-up with price ↑ 70.6% and OI ↑ 31.2%.
Volume jumped +305.9%, confirming active participation.
Low IV makes premiums attractive. Delta 0.55 indicates higher ITM probability.
________________________________________
🟢 2. CGPOWER 700 CALL
LTP: 23.5
Sentiment: Bullish | Trend: Up | Strength: 5/5 (Strong)
IV: 30.9 | Delta: 0.52 | Theta: -0.65 | Vega: 0.79
Buildup: Long Build-up
Why?
700 CE surged +127% in price with OI ↑ 216.5% — strong long confirmation.
Volume spiked +2962%, showing aggressive buying.
IV rising (+10.3%) supports premium expansion.
________________________________________
🟢 3. COLPAL 2340 CALL
LTP: 61.7
Sentiment: Bullish | Trend: Up | Strength: 5/5 (Strong)
IV: 22.4 | Delta: 0.53 | Theta: -1.52 | Vega: 2.64
Buildup: Long Build-up
Why?
2340 CE gained +89.8% in price with OI ↑ 146.9%.
Volume surged +2357%, indicating strong trader interest.
Moderate IV gives a balanced risk-reward setup.
________________________________________
🟢 4. LT 3600 CALL
LTP: 76.25
Sentiment: Bullish | Trend: Up | Strength: 5/5 (Strong)
IV: 15.9 | Delta: 0.55 | Theta: -2.34 | Vega: 4.06
Buildup: Long Build-up
Why?
3600 CE rose +29.2% with OI ↑ 3.6%.
Volume ↑ 71%, confirming active participation.
Delta 0.55 signals higher ITM chances with bullish momentum.
________________________________________
🟢 5. BRITANNIA 5800 CALL
LTP: 172
Sentiment: Bullish | Trend: Up | Strength: 5/5 (Strong)
IV: 21.6 | Delta: 0.57 | Theta: -3.46 | Vega: 6.52
Buildup: Long Build-up
Why?
5800 CE rallied +49.6% with OI ↑ 16.5%.
Volume jumped +566%, confirming buying momentum.
IV rising (+9.4%) shows strong premium expansion potential.
________________________________________
🟢 6. ASIANPAINT 2500 CALL
LTP: 77
Sentiment: Bullish | Trend: Up | Strength: 3.9/5 (Strong)
IV: 20.8 | Delta: 0.59 | Theta: -1.40 | Vega: 2.79
Buildup: Short Covering
Why?
2500 CE benefited from short covering — price ↑ 21% while OI ↓ 21.6%.
This indicates shorts exiting, fueling bullish momentum.
Volume dipped (-15.9%), so position sizing should be careful.
________________________________________
🟢 7. DMART 4800 CALL
LTP: 101
Sentiment: Bullish | Trend: Up | Strength: 5/5 (Strong)
IV: 20.2 | Delta: 0.50 | Theta: -3.53 | Vega: 5.40
Buildup: Long Build-up
Why?
4800 CE rose +12.1% with OI ↑ 17.5% — strong long confirmation.
Volume ↑ 159.9% adds conviction.
IV easing (-6.1%) ensures better fills with controlled risk.
________________________________________
⚠️ Disclaimer – Please Read Carefully
The information shared here is meant purely for learning and awareness.
It is not a buy or sell recommendation and should not be taken as investment advice.
📌 I am not a SEBI-registered investment advisor.
📌 All views expressed are based on personal study, chart patterns, and publicly available data.
📌 Trading in stocks or options carries risk. Markets can move unexpectedly. Losses can exceed capital.
📌 Past setups do not guarantee future outcomes.
👉 Beginners: Use this for study & paper trading only.
👉 Experienced traders: Apply your own risk management & strategy filters.
👉 Always consult a SEBI-registered financial advisor before real trades.
________________________________________
💬 Found this useful?
🔼 Boost this post to help more traders learn.
✍️ Share your thoughts/setups in comments — let’s grow together.
🔁 Share with fellow traders & learners.
👉 Follow for more clean, structured breakdowns with discipline at the core.
🚀 Stay Calm. Stay Clean. Trade With Patience.
Trade Smart | Learn Zones | Be Self-Reliant 📊
________________________________________

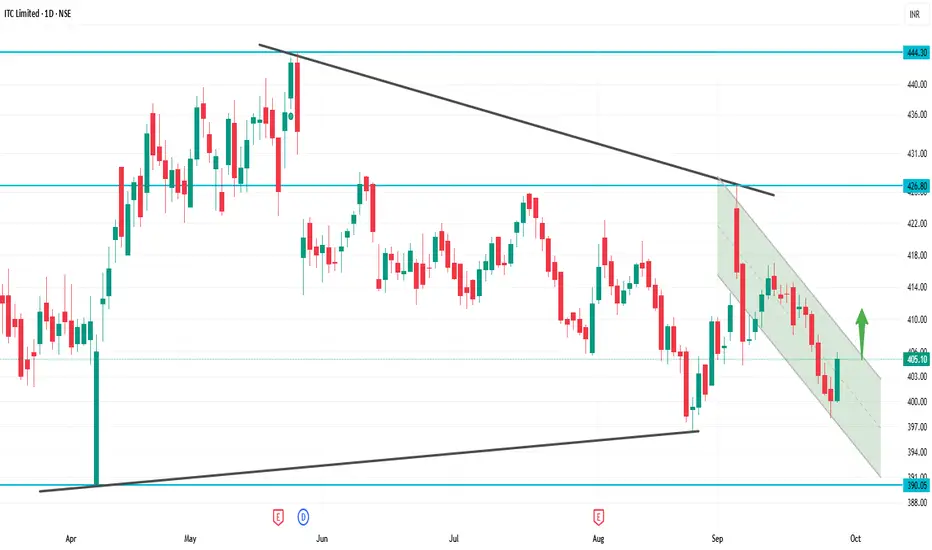
ITC Swing trading opportunityFor a swing trade in ITC, consider buying if the price stays above the EMA 21 (₹408.50) and breaks out above the channel resistance (₹412–₹415); waiting for a bullish MACD crossover or a close above ₹415 adds extra confirmation. Set your first profit target at ₹420–₹425, and if the momentum continues, aim for ₹430–₹435. Protect your trade by placing a stop loss just below recent support, around ₹398–₹400, to minimize risk if the price reverses unexpectedly.

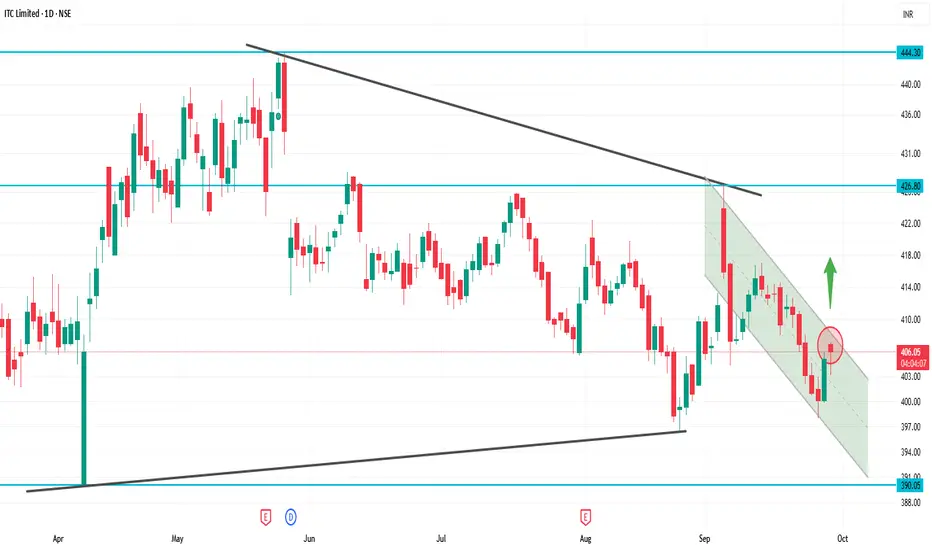
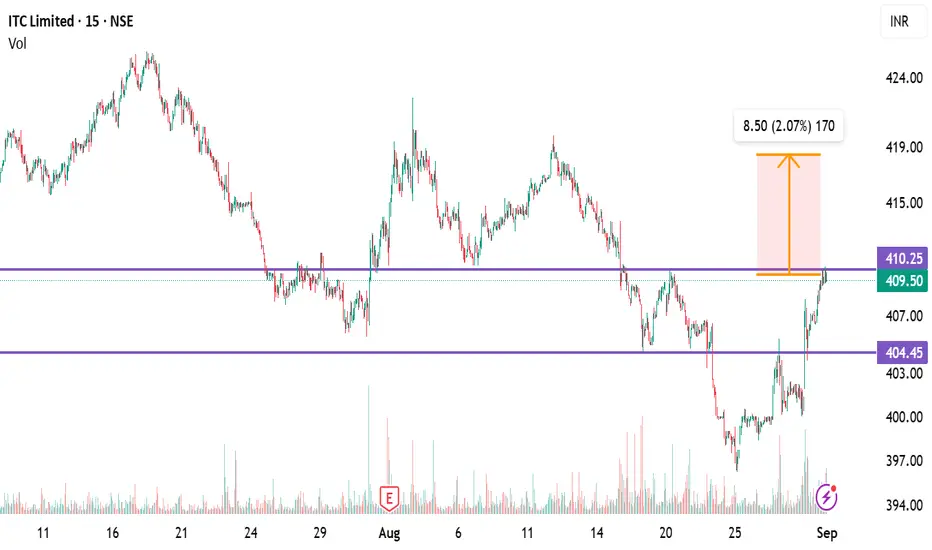
ITC – 2% Upside Expected from CMPLooking for a potential 2% move up from current market price (CMP). Watching closely for confirmation on price action. Short-term trade setup based on momentum and recent support hold.
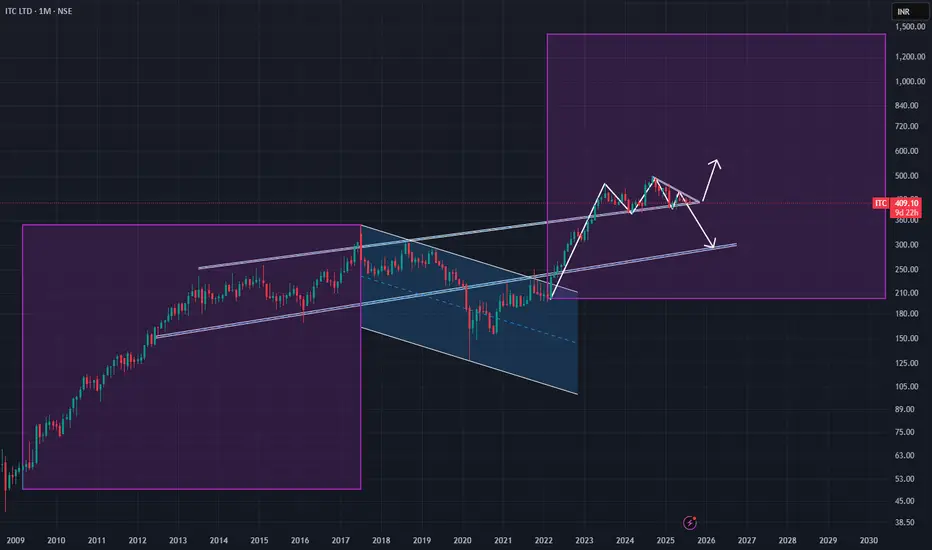
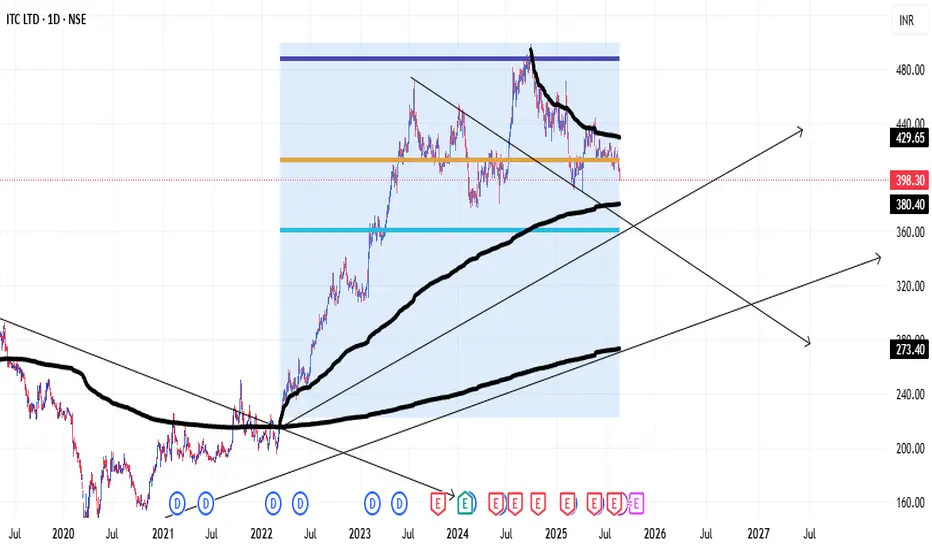
ITC Projection Here’s a clear explanation of **ITC Limited’s Business Model** 👇
---
### **ITC Business Model Overview**
**1. Diversified Conglomerate Structure**
ITC Limited operates as a multi-business conglomerate with presence across **FMCG, Hotels, Paperboards & Packaging, Agri-Business, and IT services**. This diversification reduces risk and ensures multiple revenue streams.
---
**2. Major Business Segments**
* **FMCG (Fast-Moving Consumer Goods):**
* Cigarettes (Flagship business, \~35-40% revenue share)
* Branded packaged foods (Aashirvaad, Sunfeast, Bingo, Yippee, B Natural)
* Personal care (Fiama, Vivel, Savlon)
* Lifestyle retail (Wills Lifestyle, John Players earlier)
* Stationery & matches
* **Hotels:**
* Operates premium, luxury, and business hotels under ITC Hotels, WelcomHotel, Fortune, and Aashray brands.
* **Paperboards, Paper & Packaging:**
* Integrated manufacturing of eco-friendly paperboards, specialty papers, and packaging solutions.
* **Agri-Business:**
* E-Choupal digital platform connects directly with farmers for procurement of wheat, soybeans, coffee, etc.
* Supplies to domestic and export markets.
* **IT Services:**
* ITC Infotech offers technology consulting and digital solutions globally.
---
**3. Value Creation Strategy**
* **Backward Integration:**
Own sourcing (agriculture, paper) ensures cost efficiency and quality control.
* **Brand Building:**
Heavy investment in R\&D, innovation, and strong distribution network.
* **Sustainability Focus:**
ITC positions itself as carbon-positive, water-positive, and solid-waste recycling positive.
* **Synergy Across Businesses:**
Agri-business supports FMCG (e.g., sourcing wheat for Aashirvaad), packaging supports branded foods, etc.
---
**4. Revenue & Profit Mix**
* Cigarettes remain the **largest profit generator**, though FMCG and agri-business are growing rapidly.
* Hotels and paperboards provide diversification but contribute less to profit compared to FMCG & cigarettes.
---
✅ **In short:** ITC runs a **multi-vertical business model**, with cigarettes as the cash cow funding expansion into FMCG, hotels, and other sustainable ventures, creating long-term shareholder value.
---
thanks
ITC viewITC ahead of the extra duty over 40% slab planned by the government on tobacco-cigs, the stock is indicating a weakness as only 9 days are left for the monthly close, it will be interesting to see if (make or break)