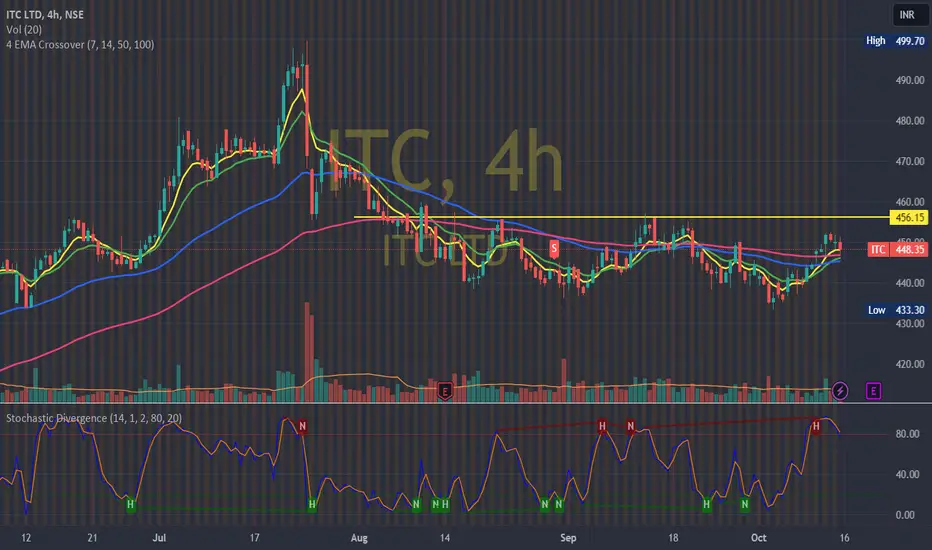
ITC LOOKS GOODHi friends, it is 4 hour time frame chart of ITC
Observations-:
1-RSI trending up while price making lower lows.
2-Price completed breakout retest and bouncing from retest zone.
3-Second time price bouncing from same price zone
3-Breakout of Falling trendline.
On the basis of above observations i am going long in it.
Kindly like if you like my analysis.
ITCGX trade ideas

ITC looks BULLISH, Good for long term.In this video, I have provided my view on ITC for swing trading as well as long term investing.
Watch the video for more details.

ITCItc W pattern breakout abv 456
targets 480 & 500
swing trade
good support at 435 levels sl below 435 closing

ITC-Watch list stock -Wait for 455 levels for any fresh entryITC:Shall keep in the watch list.Holding above 455 and a break out at this levels likely Double bottom or W-Pattren break out and suggests 475+positional Target
ITC looks good for swing tradeIt has formed series of higher highs and higher lows which is indicating that this stock is in uptrend. And now, after a pullback it has shown a breakout which is indicating that this stock is ready to show some bullish moves. Trade at your own risk.

Stock of the year at important junctionNSE:ITC after having a splendid run throughout the year is now at a very important junction. It is a fairly visible H&S (Head & Shoulder) in making but breakdown looks like snowball's chance in hell. Hence that means NSE:ITC can be a good reversal candidate but only after strong close above 456 level. That should lead NSE:ITC towards 500 and then further for new highs. Breakout above 456 may look for a inverted H&S or double bottom breakout. Things are difficult for equity market but the course of this war shall be decided in upcoming days when we will know the participating countries and fronts. One can add NSE:ITC at current levels if they have missed the rally throughout as it is holding on its levels, 432-430 shall act as stop loss. A closing below these levels shall trigger the breakdown of the above-mentioned H&S. We have 2 inside bars in last 4 candles which also indicate accumulation at current levels. It will be very exciting to see which way these positions move. If a breakdown takes place then NSE:ITC will move towards 415-420 levels otherwise this trending stock should remain the contender for more upside this year and further.

ITC# Keep a Lookout for Breakout.
●SL can be maintained below the low of Breakout candle or at previous swing low or at support.
●Enter the trade after a closing on Daily basis.

#ITC Cash : Looks good around 445-447#ITC Cash -Positional for 2 weeks
27.09.2023
Looks good around 445-447
Stoploss 441
Tgt 456-460/480/500
Cmp 449.35

ITC Ltd. May bounce back to ATH 490ITC Ltd. have been holding support zone of 440 since last 1.5 month and today gave solid green candle of 1.5%.
It may break resistance of 455 and move towards 490 shortly.

ITC go long 🚀🚀ITC go long it it crosses 455.65
Entry price : 455.70
Stop loss : 435.85
Target : 492.35

ITC LTDITC LTD looks good to accumulate here with swing low or support area as stop loss for trading purpose. NOTE:- This is for short term trading only, not for investing purpose. Time duration is 1 to 2 months max.

Itc Can start a new waveItc may have completed 2nd wave & will start a new if lows are maintained..
Keep stop loss of 438 or 436 as per you risk appetite for targets of 457 - 470.. will look charts further after that


ITCITC:- If we get a breakout, we can see upside movement.
Hello traders,
As always, simple and neat charts so everyone can understand and not make it too complicated.
rest details mentioned in the chart.
will be posting more such ideas like this. Until that, like share and follow :)
check my other ideas to get to know about all the successful trades based on price action.
Thanks,
Ajay.
keep learning and keep earning.

Reverse HnS in ITC. Epecting up moveITC forming reverse HnS. Expecting an up move if the pattern breaks out.


ITC UPDATEAs.said.to take hedge against st long. Also said to wait for 15 min to take hedge. Today ITC didn't came down below 443 in first half and so no hedge should be entered. Even though if entered there is minimal loss. Also.said.in conclusion that ITC should resume its uptrend from today. ITC closed.at 447 again and above resistance. ITC is in narrow range an it can expand on upside may be from tomorrow or day.
Conclusion
Hold long. Cash purchase is advised.
Close hedge if opened.Given to close hedge on break above.446.

ITC daily chart falling wedge possible breakoutITC is forming a falling wedge pattern on daily chart in my view...cmp 443. If it holds 430 levels one can see a move till 456 and 490 short term


ITC - Short Idea - Intradayoffering a user-friendly interface and real-time updates, this tool will cater to both novice and experienced traders seeking a competitive edge

ITC: UPDATE.Since you may have bought ITC on our analysis, We are giving update. We have bought ITC and not worried as we can hold it if it comes down to 385 also. But since you all may get worried if it break as it had closed at 442, And so I am updating on ITC.
First of all we see ITC movement, it had tried to break bellow neck line 3 to 4 times but was unsuccessful. Then it break above resistance of 446 and then again came down to 442. This simply means buying is comming at 438 and selling g at 450.
Secondly it again had stuck in narrow range, which should have expanded today.
Now since we have bought it at 447 we are in loss of 5 Rs. If bought in cash then there is no.wory only holding g period will increase , but if bought in f & o then hedge your position by selling 440 call. If ITC close above 446 then close call with 3500 loss and let long carry on. If ITC close bellow 440 then carry both short call and long ITC till 435 is taken out. If 435 is taken out close long and carry on short call. 440 call is @10. In second senerio call will become 0. Wait for first 15 min before taking hedging decession. As said earlier in nifty analysis that option is for those who can bear loss. Who cannot bear loss they can buy only in cash.
We have marked green support line which is neck line. It is strong support.
ITC had made lower high in last 3 days. So again low of 3 days before too falls near support line.
Conclusion
ITC may resume its upward journey from Monday onwards provided it hold 440.

ITC @ 442 09-SEP-2023ITC @ 442 09-SEP-2023
As long as 355/128 holds support, we will see more up move towards 700/1000/1500

ITC: ALL BUYAs said in previous analysis ITC triggered long. Now 338 had become good support. Carry on long with given SL earlier. ItC looking for 466 1st trgt, ie 4% return.
