ITC Q4 FY25 and FY25 Full-Year Results ReportExecutive Summary
ITC’s financial performance for Q4 FY25 and the full fiscal year demonstrates operational stability in its core businesses, with headline profits influenced by exceptional, non-recurring gains. The company continues to manage challenging market conditions with marginal improvement in recurring profits and robust dividends for shareholders.
Key Financial Highlights
Q4 FY25:
Gross Revenue: ₹18,266 crore (up 9.2% YoY)
EBITDA: ₹5,986 crore (up 2.5% YoY)
Profit Before Tax (PBT): ₹6,417 crore (up 2.1% YoY)
Profit After Tax (PAT): ₹4,875 crore (up 0.8% YoY)
Headline Net Profit: ₹19,561.57 crore (reflects one-time exceptional gain, not recurring profit)
FY25 (Full Year)
Gross Revenue: ₹73,465 crore (up 10.2% YoY)
PAT: ₹20,092 crore (up 0.9% YoY)
Dividend: Final dividend of ₹7.85/share for FY25, bringing total annual dividend to ₹14.35/share.
Analysts view ITC’s core business as resilient under tough conditions, with “modest” organic profit growth.
Strong cash flows and consistent dividends make ITC an attractive pick for risk-averse, long-term investors.
The demerger of the hotel business is expected to sharpen management focus and potentially enable better growth performance in future periods.
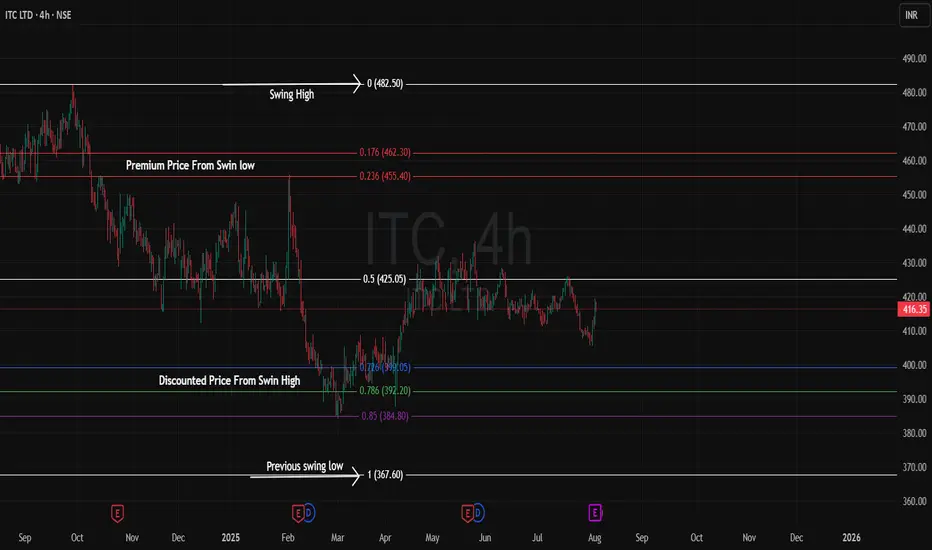
Chart Technical Understanding
The Fibonacci retracement tool is applied from the recent swing high to the swing low (in a downtrend), or from swing low to swing high (in an uptrend).
The area from 0% to 50% (below midpoint) signals discount, and 50% to 100% (above midpoint) signals premium.
If price falls deeply from its swing high, you can quantify how much is discounted by seeing how far below the 50% line it is.
If price rallies back above the 50% level after retracing, it enters the premium area, indicating the asset is again priced at a premium relative to its prior correction.
Disclaimer: lnkd.in
ITCGX trade ideas
[Positional] ITC Buy IdeaNote -
One of the best forms of Price Action is to not try to predict at all. Instead of that, ACT on the price. So, this chart tells at "where" to act in "what direction. Unless it triggers, like, let's say the candle doesn't break the level which says "Buy if it breaks", You should not buy at all.
=======
I use shorthands for my trades.
"Positional" - means You can carry these positions and I do not see sharp volatility ahead. (I tally upcoming events and many small kinds of stuff to my own tiny capacity.)
"Intraday" -means You must close this position at any cost by the end of the day.
"Theta" , "Bounce" , "3BB" or "Entropy" - My own systems.
=======
I won't personally follow any rules. If I "think" (It is never gut feel. It is always some reason.) the trade is wrong, I may take reverse trade. I may carry forward an intraday position. What is meant here - You shouldn't follow me because I may miss updating. You should follow the system I share.
=======
Like -
Always follow a stop loss.
In the case of Intraday trades, it is mostly the "Day's High".
In the case of Positional trades, it is mostly the previous swings.
I do not use Stop Loss most of the time. But I manage my risk with options as I do most of the trades using derivatives
Let's see what will happened next A consolidation pattern formed near the bottom, indicating accumulation. Price action showed a breakout above the short-term resistance level, confirming bullish momentum. This breakout is followed by a green candle closing strongly above the resistance, which signals potential upward continuation.
A long position is considered at the breakout point.
Stop-loss is placed below the consolidation support area to limit downside risk.
Target is set based on a higher risk-reward ratio, aiming for a favorable profit relative to the risk taken.
The green shaded area represents the reward zone, while the red shaded area marks the risk. The setup aligns with a classic breakout strategy where price breaks through resistance after a period of consolidation.

ITCPrice has formed a cup pattern and giving the break out. 420 is acting as resistance and price is consolidating in that area.
Buy above 422 with the stop loss of 416 for the targets 428, 432, 436 and 440.
Sell below 398 with the stoploss of 403 for the targets 394, 390 and 384.
Always do your own analysis before taking any trade.

ITC (ITC Ltd)- Analysis Bullish Levels -if sustain above 479 (early entry risky) then 515 then 551 to 561 or 588 to 597 safe entry if sustain above this for a week) target can be around 679 to 716 first target, if sustain above for a week or two then we expect more upside and wait for targets around 798 to 834 then 916 to 953 if sustains above for for week or two then hold
Bearish levels :- if sustain below 415 swing trade exit below this if sustains for 2-3 days then 378 then 342 to 333 or 305 to 296 good support with SL 260 for long terminvestors below this more bearish.
**Consider some Points buffer in above levels
**Disclaimer -
I am not a SEBI registered analyst or advisor. I does not represent or endorse the accuracy or reliability of any information, conversation, or content. Stock trading is inherently risky and the users agree to assume complete and full responsibility for the outcomes of all trading decisions that they make, including but not limited to loss of capital. None of these communications should be construed as an offer to buy or sell securities, nor advice to do so. The users understands and acknowledges that there is a very high risk involved in trading securities. By using this information, the user agrees that use of this information is entirely at their own risk.
Thank you.
ITC will start going downwards soonTECHNICAL INDICATORS -
DOUBLE TOP PATTERN :
Recently NSE:ITC has formed a double top pattern indicating strong bearish potential for the stock
Double top is formed when 2 consecutive peaks are formed with a dip or low between them
HANGING MAN CANDLESTICK :
The stock has also formed a hanging man candlestick which denotes reversal of upward trend to downward trend
Hanging man is formed when a candlestick has long lower shadow and small upper body at the top
STRONG SUPPORT-RESISTANCE ZONE :
The stock has also taken reversal from a very strong support-resistance zone twice in the last 1 month indicating very stong momentum for the stock to go downwards
PROFIT TARGET :
411
STOP LOSS :
435

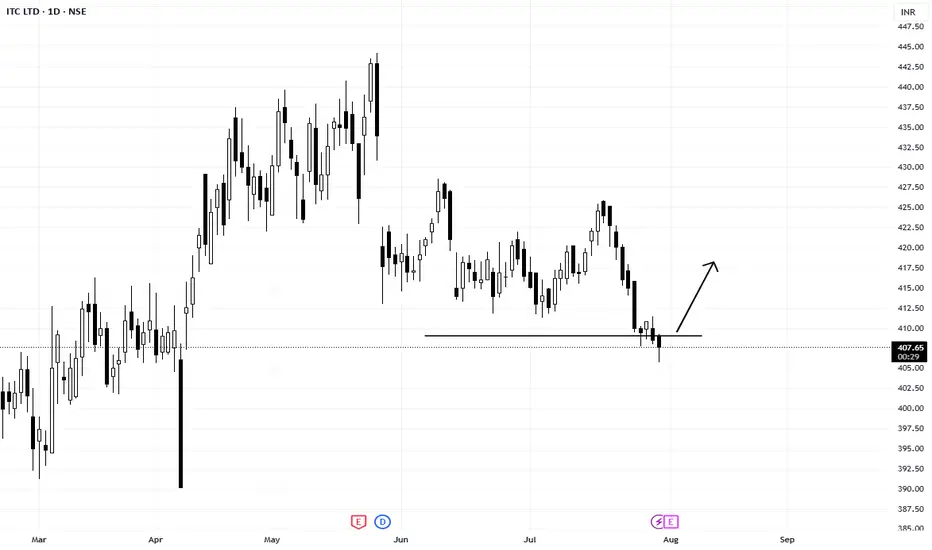
ITC very short term swing setup If we see any improvement today or tomorrow. We can see some up move
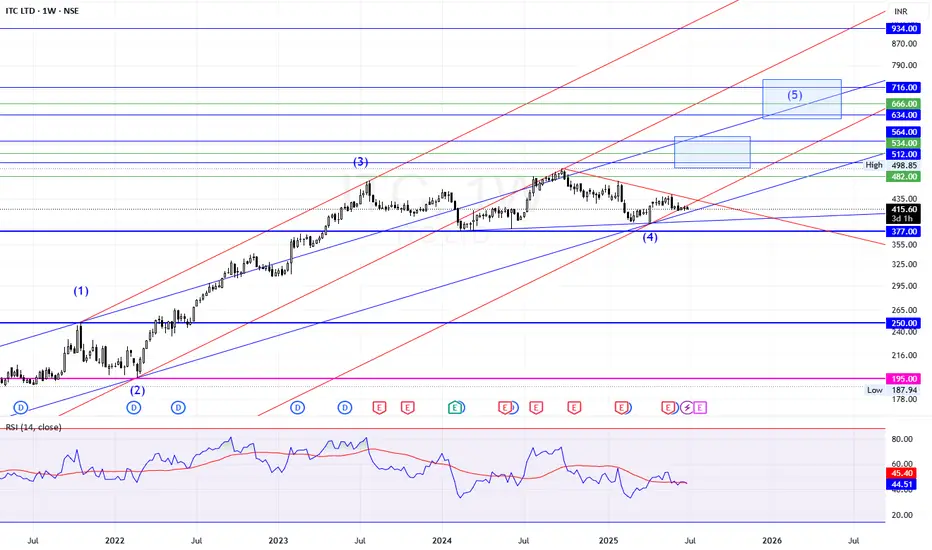
ITC LIMITED ANALYSIS 01-JUL-2025 @ 415LTP 415
Supports: 377/250/195
Resistances: 445/499
As long as the above supports hold, I expect 512-534-564 minimum on the upside.
Ultimate target zone: 634-666-716.
Extension 934.
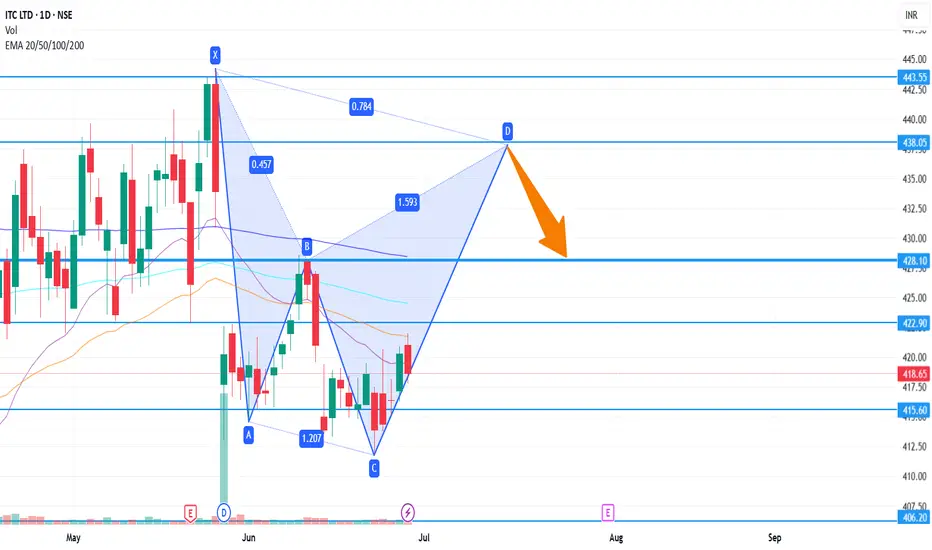
ITC Short Term 438ITC on daily chart is forming a bearish harmonic pattern.
If it follows the pattern formation then next targets at 428 and 438
Stop Loss is 413
ITC | 1 hr Idea – 10 June 2025 / SWING📌 ITC | 1 hr Idea – 8 June 2025
Bias: Neutral inside box
CMP: ~432.00
Market Structure
• Box consolidation between 426–434; no clear breakout yet.
• Momentum dead – wait for confirmation.
Levels
│ R1 434.00 │ R2 438.00
│ S1 426.00 │ S2 421.00
Trade Plan
🟢 Breakout Long → Entry on 1‑hr close > 434.50.
Targets 438 / 442 | SL 429.
🔴 Breakdown Short → Entry on 1‑hr close < 425.50.
Targets 422 / 418 | SL 430.
Notes
• Expect volatility spike after box breakout.
• Patience needed – don’t chase inside range.
Set alerts at 434.50 and 425.50; manage risk ≤ 1% per trade.
#PriceAction #ITC #1hr #GLOBALTRADESECURITIES

Price Action Trading Price action trading is based on analyzing the raw movement of price over time without relying heavily on indicators. It involves picking out key levels, reviewing candlestick patterns, and recognizing reversal and continuation setups to capitalize on market opportunities.

ITC (Maximum Potential Drop)Predicting the exact extent of a potential drop in ITC's stock price is challenging due to the influence of multiple dynamic factors, including market sentiment, macroeconomic conditions, and company-specific developments. However, based on available data and recent trends, here’s an analysis of how much ITC’s stock price could potentially drop.
Factors That Could Drive a Larger Drop
BAT Stake Sale Impact: The recent 2.5–2.87% stake sale by British American Tobacco (BAT) caused a 3–5% drop in ITC’s stock price on May 27–28, 2025. If BAT continues to offload its stake (currently ~22.5–22.7%), further selling pressure could push the price lower, potentially toward ₹400 or below, especially if market sentiment remains negative.
Weak Fundamentals: ITC’s Q3 FY25 results showed a 7.51% drop in net profit, and the paperboards segment is under pressure from low-priced imports and subdued demand. Continued underperformance could drive the stock closer to or below the 52-week low of ₹399.
Market and Regulatory Risks: Broader market volatility, such as the 1.4% decline in Indian indices due to India-Pakistan tensions, or potential increases in tobacco taxation (e.g., a proposed 35% GST rate), could exacerbate declines. A severe market correction or adverse policy changes might push ITC toward ₹390–₹400, a 4–7% drop from current levels.
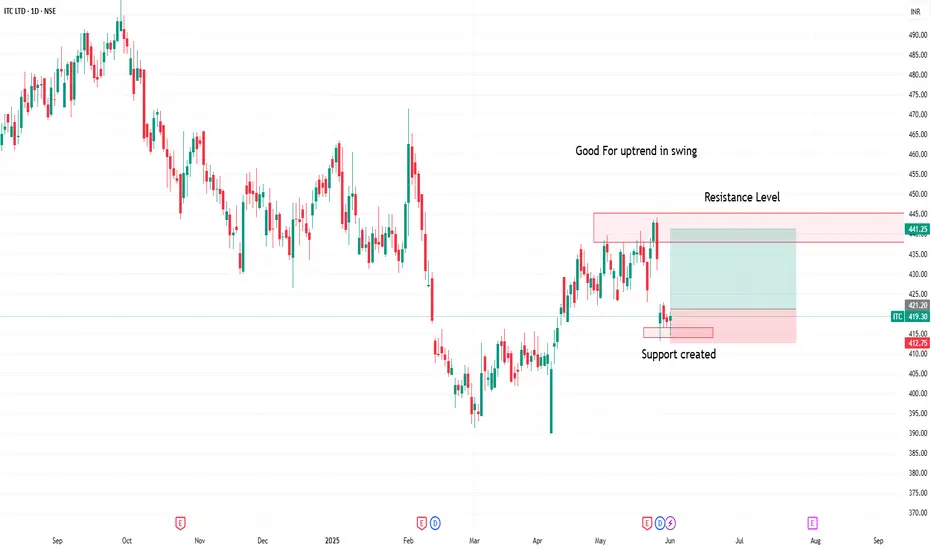
ITC creating strong support for uptrend1. Good fundamental stock
2. Good opportunity for long term and swing
3. Small Stop Loss with great R:R
What is Technical Trading ?Technical trading, also known as technical analysis, involves studying historical price charts and market statistics to identify patterns and trends in order to make informed trading decisions. It focuses on the belief that market prices reflect all available information, and past patterns can help predict future price movements.

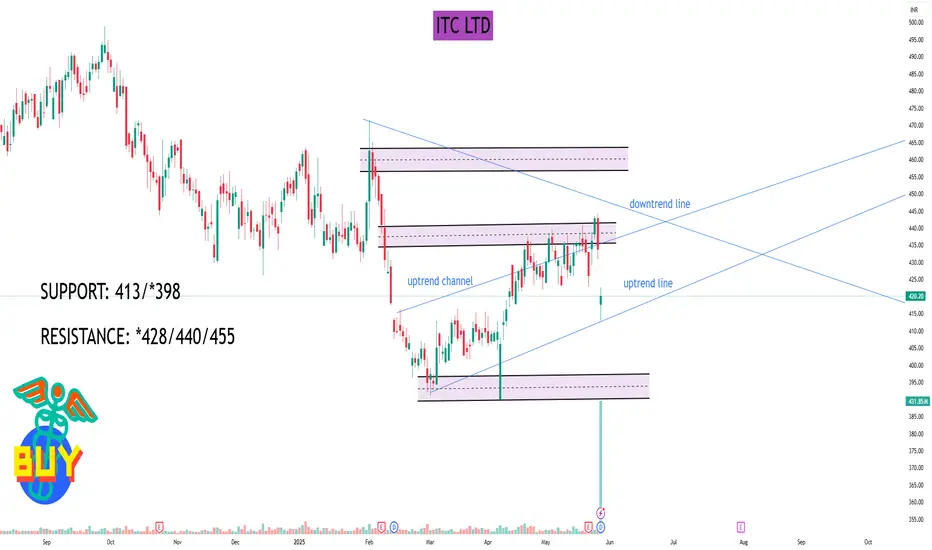
ITC LTD#ITC
STOCK NAME: ITC LTD (NSE)
CHART ANALYSIS: Symmetrical triangle within an uptrend channel.
Approaching apex, breakout or breakdown will give major move. Trading near critical support.
TREND: Consolidation inside Medium-term Uptrend
SUPPORT: 413/*398
RESISTANCE: *428/440/455
TRADE SETUP:
BUY above 428 | SL 416 | Targets 440 / €455
X SELL below *413 | SL 423 | Targets ₹400 / €388
I AM NOT SEBI REGISTERED. THIS IS ONLY FOR EDUCATIONAL PURPOSE.
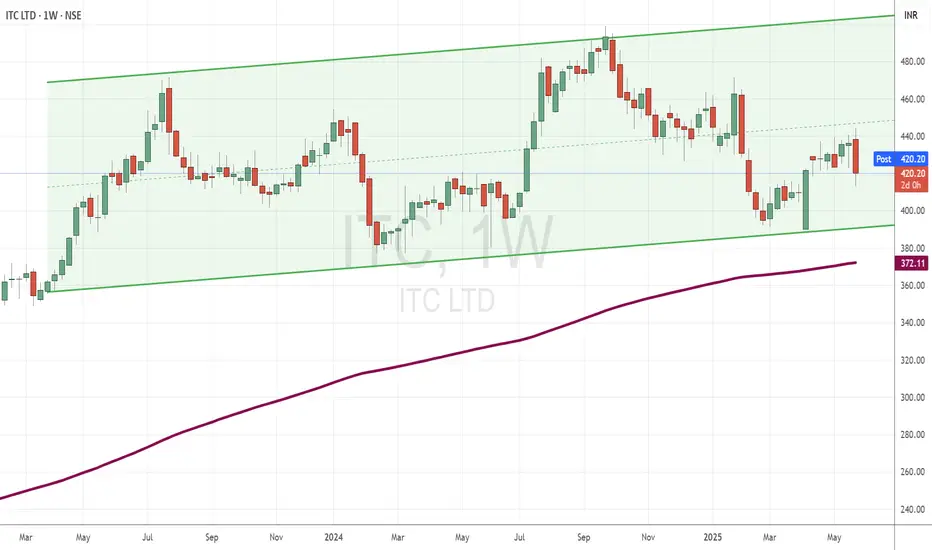
ITC Approaches Key Support Within Mild UptrendTopic Statement:
ITC is trading in a range with a slight bullish tilt, presenting structured opportunities within a defined channel.
Key Points:
* The stock is moving within a slightly bullish up-trending channel, making it suitable for channel-based trading
* A head and shoulders candlestick pattern is emerging, which may signal potential short-term weakness
* The price is nearing the 180-day EMA, making levels near or below it attractive for long-term buying opportunities
Heads Up! ITC Looks Ready to FlyAfter a steady decline from its highs, ITC has made a strong comeback, bouncing perfectly off its trendline support. And now—it’s broken past its trendline resistance!
📈 This breakout could be the start of a new bullish wave, with momentum likely to carry the stock higher in the sessions ahead.
💰 Dividend Alert: ITC has announced a final dividend of ₹7.85 per share, with the ex-date on 28th May. This is the highest dividend declared by ITC in the last 5 years. That could bring some serious action in the next couple of trading days.
🎯 All eyes on ITC—this might just be the breakout we’ve been waiting for!

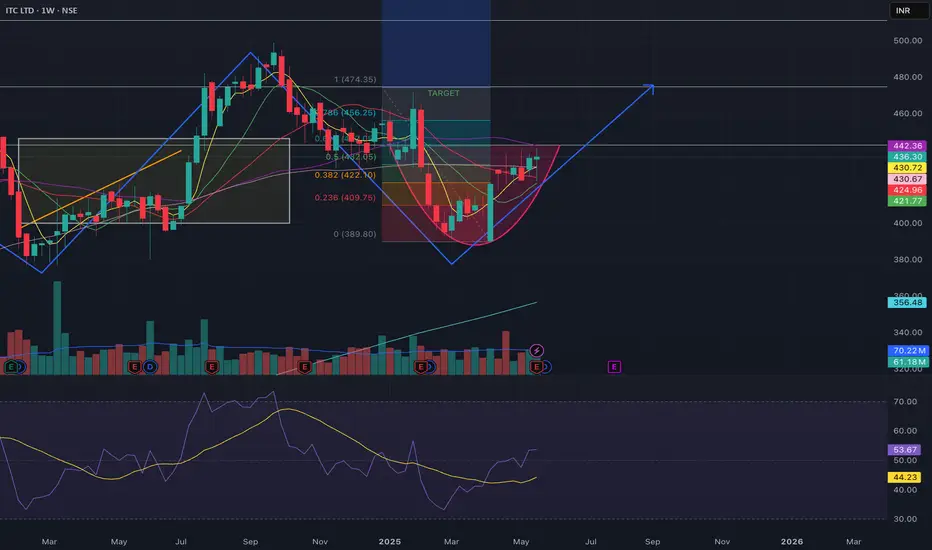
ITC ready for breakout with target of 500CUP formation in W
Presently at resistance 440.
Taken support at all the MA.
FMCG index is also consolidation.
Breakout above 440 for target of 500
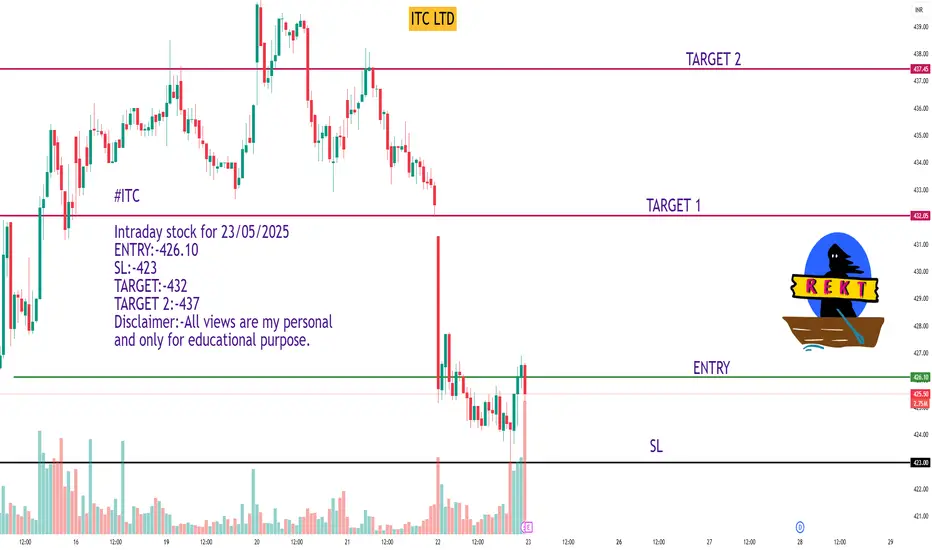
ITC LTD#ITC
Intraday stock for 23/05/2025
ENTRY:-426.10
SL:-423
TARGET:-432
TARGET 2:-437
Disclaimer:-All views are my personal and only for educational purpose.
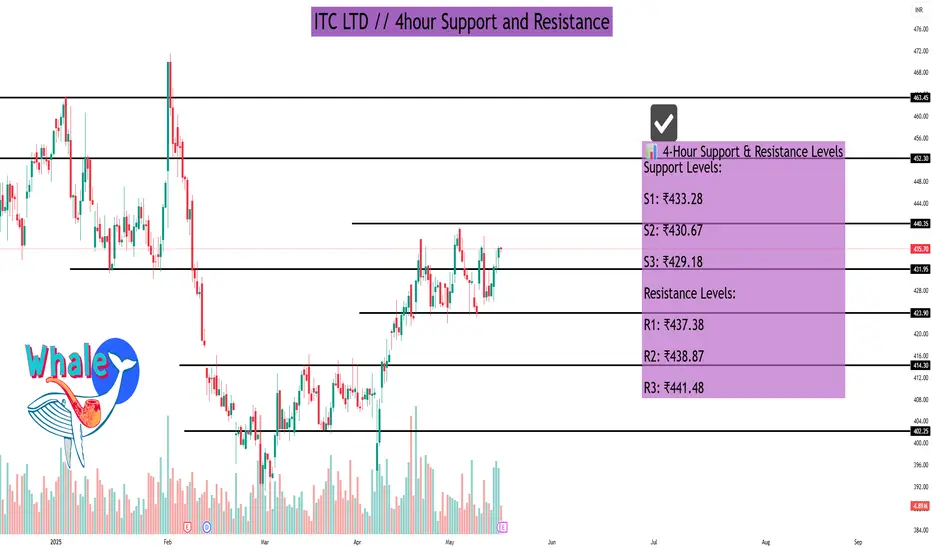
ITC LTD As of May 16, 2025, ITC Ltd. (NSE: ITC) is trading around ₹435.70. Analyzing the 4-hour timeframe, the following support and resistance levels have been identified based on various technical indicators:
📊 4-Hour Support & Resistance Levels
Support Levels:
S1: ₹433.28
S2: ₹430.67
S3: ₹429.18
Resistance Levels:
R1: ₹437.38
R2: ₹438.87
R3: ₹441.48
These levels are derived from pivot point calculations and can serve as potential areas where the price might experience support or resistance.
🔍 Technical Indicators Overview
Relative Strength Index (RSI): 58.98 – Indicates neutral momentum.
Moving Average Convergence Divergence (MACD): 3.86 – Suggests mild bullish momentum.
Average Directional Index (ADX): 17.89 – Points to a weak trend strength.
Stochastic Oscillator: 51.37 – Reflects neutral conditions.
Supertrend Indicator: ₹413.32 – Below current price, indicating a bullish signal.
Parabolic SAR: ₹437.35 – Slightly above current price, suggesting potential resistance.
📈 Fibonacci Retracement Levels
Considering the downtrend from ₹491.00 (Jan 3, 2025) to ₹390.15 (Apr 7, 2025), the key Fibonacci retracement levels are:
23.6%: ₹413.95
38.2%: ₹428.67
50%: ₹440.57
61.8%: ₹452.48
76.4%: ₹467.20
These levels can act as potential support or resistance zones as the price retraces its previous move.
🧠 Trading Insights
The current price is approaching the R1 resistance level at ₹437.38.
If the price breaks above this level with strong volume, it may test higher resistance levels.
Conversely, if it fails to break through, it might retrace to the support levels mentioned above.
Traders should monitor these levels closely and consider using stop-loss orders to manage risk.
ITC STOCK IN BREAKOUT ZONE BULLparallel channel and wedge pattern , now in resistance , weekly canlde spinning top , above breakout then boom

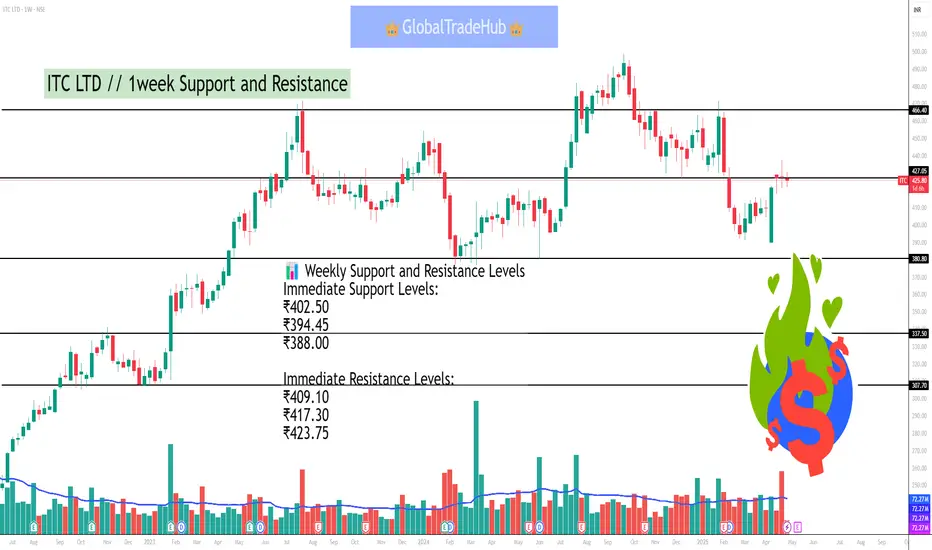
ITC LTD // 1week Support and ResistanceAs of May 1, 2025, at 10:20 AM IST, ITC Ltd (NSE: ITC) is trading at ₹403.05. Based on recent technical analysis, here are the key support and resistance levels for the stock on a weekly (1W) chart:
📊 Weekly Support and Resistance Levels
Immediate Support Levels:
₹402.50
₹394.45
₹388.00
Immediate Resistance Levels:
₹409.10
₹417.30
₹423.75
These levels suggest that if the stock price declines below ₹402.50, it may find support around ₹394.45 and ₹388.00. Conversely, if the price rises above ₹409.10, it could encounter resistance near ₹417.30 and ₹423.75.
🔍 Technical Indicators
ADX (Average Directional Index): 29.19 – indicates a trending market.
RSI (Relative Strength Index): 47.4 – suggests neutral momentum.
MACD (Moving Average Convergence Divergence): -4.66 – indicates a negative trend.
CCI (Commodity Channel Index): 2.74 – suggests neutral momentum.
These indicators suggest a neutral to slightly bearish outlook for ITC in the short term.
📈 Summary
ITC is currently trading near its immediate support levels. A break below ₹402.50 could lead to a decline towards ₹394.45 and ₹388.00. On the upside, resistance is observed at ₹409.10, ₹417.30, and ₹423.75. Traders should monitor these levels closely, as a decisive move beyond these support or resistance levels could signal the next directional move.
ITC Limited ( India’s largest diversified conglomerates )ITC Limited Overview
ITC Limited is one of India’s largest diversified conglomerates, headquartered in Kolkata. Established in 1910 as the Imperial Tobacco Company, it has transformed into a multi-business enterprise with a strong focus on sustainability and innovation.
Key Business Segments
FMCG (Fast-Moving Consumer Goods):
Branded Packaged Foods: Aashirvaad, Sunfeast, Bingo!, Yippee!, and Kitchens of India.
Personal Care: Savlon, Vivel, Fiama, and Engage.
Education & Stationery: Classmate and Paperkraft.
Lifestyle Retail : Wills Lifestyle and ITC Fiama Di Wills.
Hotels:
Luxury hospitality chain ITC Hotels (e.g., ITC Maurya, ITC Grand Chola) with over 120 properties.
Focus on "Responsible Luxury" with LEED-certified green buildings.
Paperboards, Paper & Packaging:
Leading manufacturer of sustainable packaging solutions.
Brands: PAPERKRAFT, ECOLEAF.
Agri Business:
Agri-commodity exports (soy, coffee, spices) and farm-to-fork value chains.
e-Choupal : Digital initiative empowering 4 million+ farmers with market access.
Information Technology:
ITC Infotech (subsidiary): Provides AI, cloud, and cybersecurity solutions globally.
Sustainability & ESG Leadership
Carbon Positive: 3x renewable energy use vs. consumption.
Water Positive: 2x water replenished vs. used.
Solid Waste Recycling Positive: 1.5 million+ metric tons recycled.
Social Impact: 12 million+ livelihoods supported through CSR initiatives.
Global Footprint
Exports to 90+ countries (agri-products, apparel, FMCG).
ITC Infotech operates in 30+ countries.
Leadership
Chairman: Sanjiv Puri (since 2020).
Known for driving diversification into non-tobacco businesses and ESG focus.
