US30 – Rising Wedge on Thin Ice ! The Dow has been pushing higher for weeks, but the structure it’s building isn’t the most comfortable for bulls. Right now, price is sitting inside a rising wedge — a pattern that often looks strong until momentum fades and it breaks lower.
What’s happening now?
Buyers are still trying to defend n
About Dow Jones Industrial Average Index
Dow Jones* often refers to the Dow Jones Industrial Average, which was one of the first stock indices and is one of the most commonly referred to barometers of equity performance in the United States. The Dow Jones Industrial Average, not to be confused with the Dow Jones Transportation index (which was the first index), is often called, "the Dow" or "DJIA," and consists of thirty stocks which traditionally were industrial-based. But in recent years as the US economy has become more consumer-oriented, the index has seen a change in composition that no longer has much to do with direct industrial investment.
Related indices

Bearish Signal in Dow Jones: Will 45,000 Hold?Dow Jones Analysis – Bearish Signal Emerges
The Dow Jones Industrial Average (DJI) has shown signs of weakness over the past couple of sessions. On Tuesday, the index formed a shooting star candlestick pattern — a classic reversal signal that often indicates exhaustion in the uptrend.
Yesterday,

Dow Jones Update – Short Entry After Red Zone Rejection✅🎯💥Following my previous Dow Jones analysis, price retested the red supply zone near 46,076 and was rejected. It then moved back below the previous high at 46,026, triggering my short entry on the M5 timeframe.
Trade Outcome:
Entry: 46,026 (confirmation after rejection on M5)
Target: Reached Risk/
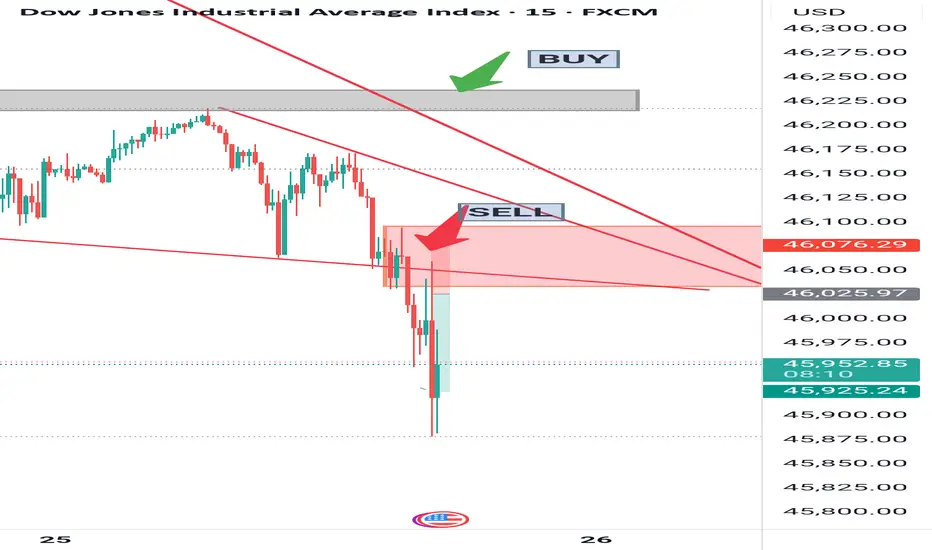
Dow Jones – Sell on Red Zone Rejection, Buy Above Gray Box✅✅If it confirms during the stock market session, we will trade the Dow Jones only during this time and as a scalper. According to the following scenario:
On the Dow Jones chart, my trading plan is based on two key zones:
Sell Scenario: If price retests the red zone (46,080–46,040) and gets reject

An idea on DJI (US30) #US30TRADE PLAN : US30 - DOW JONES INDEX
Based on a Trend analysis of US30, had a plan to short the index at the NYSE Open as the structure shifted to the downside.
*This is not financial Advise just an analysis for educational Purpose*

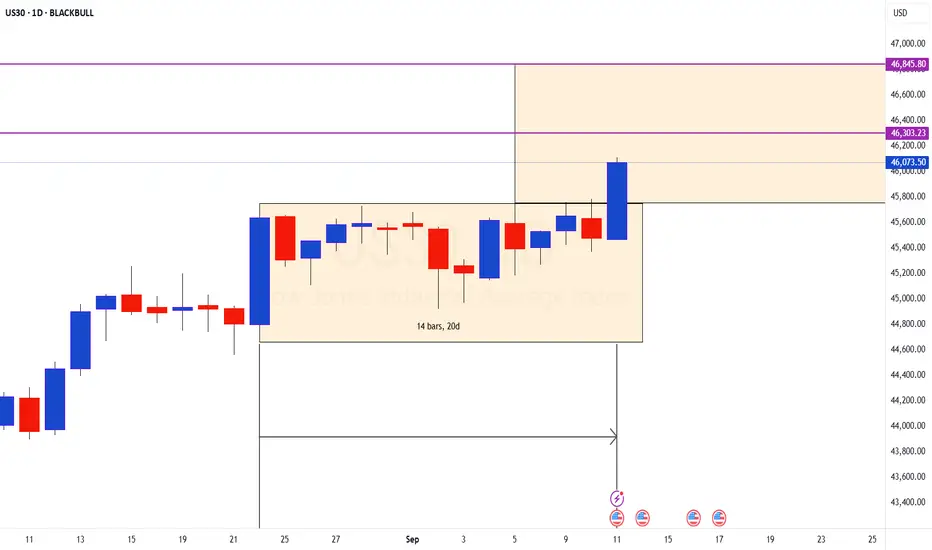
NR14 Breakout on DOW US30A perfect textbook trading set up on DOW.
Price has been trading sideways after the strength candle formed on the 22nd Aug.
Price has now broken out of the range after 14 days of consolidation.
Pattern range is 1100 points and the target is 46845
Disclaimer: I am not a SEBI registered Analyst
Dow Jones The Dow Jones is trading near 46,315, pushing toward strong weekly resistance around 47,250; a breakout above this level could set up a move toward the psychological 50,000 zone, while any rejection may trigger a pullback toward the key support areas around 42,000, with deeper cushions near 35,500 a

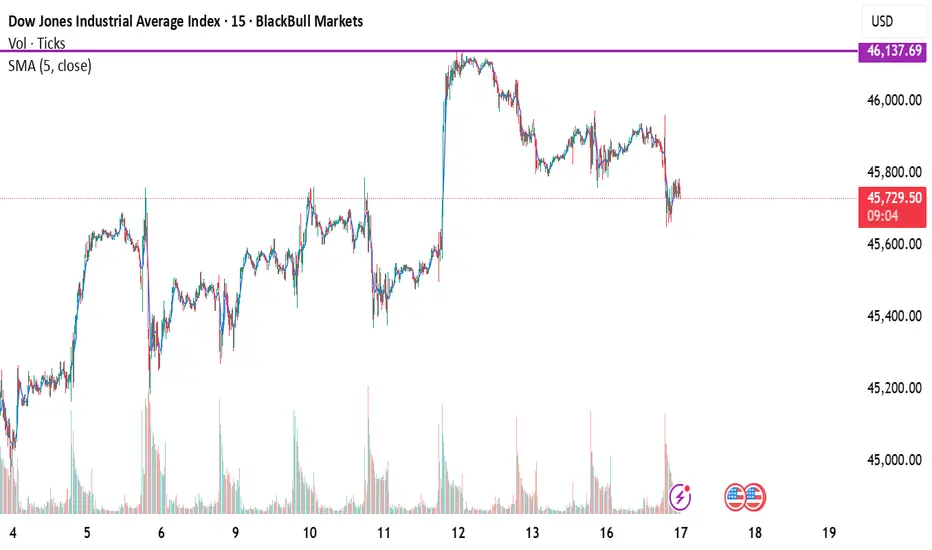
Bullish SetupPrice is currently consolidating after a recent pullback and holding above the 45,700 zone, which is acting as short-term support. If the price sustains above this level, I expect bullish momentum to continue and price to retest the recent swing high near 46,137.
📈 View: Bullish
🎯 Target: 46,137
DJI - Short tradeBased on monthly range for next 1 to 2 weeks market can move down. SL last month high, for 1:3

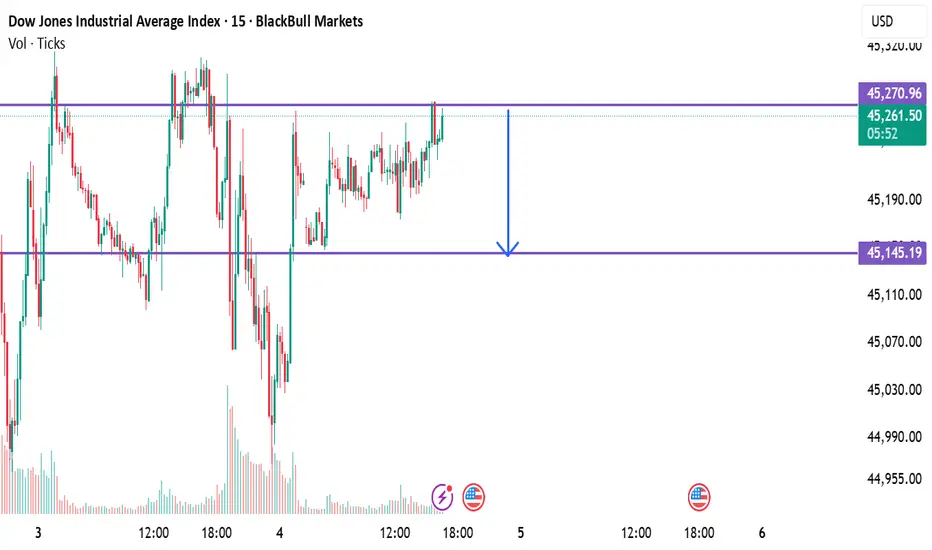
US30 short view – expecting a downside move with a target of 45,"US30 short view – bearish momentum expected with a downside target of 45,145
See all ideas
Summarizing what the indicators are suggesting.
Oscillators
Neutral
SellBuy
Strong sellStrong buy
Strong sellSellNeutralBuyStrong buy
Oscillators
Neutral
SellBuy
Strong sellStrong buy
Strong sellSellNeutralBuyStrong buy
Summary
Neutral
SellBuy
Strong sellStrong buy
Strong sellSellNeutralBuyStrong buy
Summary
Neutral
SellBuy
Strong sellStrong buy
Strong sellSellNeutralBuyStrong buy
Summary
Neutral
SellBuy
Strong sellStrong buy
Strong sellSellNeutralBuyStrong buy
Moving Averages
Neutral
SellBuy
Strong sellStrong buy
Strong sellSellNeutralBuyStrong buy
Moving Averages
Neutral
SellBuy
Strong sellStrong buy
Strong sellSellNeutralBuyStrong buy
Displays a symbol's price movements over previous years to identify recurring trends.
Frequently Asked Questions
The current value of Dow Jones Industrial Average Index is 46,758.28 USD — it has risen by 0.51% in the past 24 hours. Track the index more closely on the Dow Jones Industrial Average Index chart.
Dow Jones Industrial Average Index reached its highest quote on Oct 3, 2025 — 47,049.64 USD. See more data on the Dow Jones Industrial Average Index chart.
The lowest ever quote of Dow Jones Industrial Average Index is 28.48 USD. It was reached on Aug 8, 1896. See more data on the Dow Jones Industrial Average Index chart.
Dow Jones Industrial Average Index value has increased by 1.42% in the past week, since last month it has shown a 3.20% increase, and over the year it's increased by 11.07%. Keep track of all changes on the Dow Jones Industrial Average Index chart.
The top companies of Dow Jones Industrial Average Index are NASDAQ:NVDA, NASDAQ:MSFT, and NASDAQ:AAPL — they can boast market cap of 4.56 T USD, 3.85 T USD, and 3.83 T USD accordingly.
The highest-priced instruments on Dow Jones Industrial Average Index are NYSE:GS, NASDAQ:MSFT, and NYSE:CAT — they'll cost you 789.98 USD, 517.35 USD, and 497.85 USD accordingly.
The champion of Dow Jones Industrial Average Index is NYSE:GS — it's gained 61.24% over the year.
The weakest component of Dow Jones Industrial Average Index is NYSE:UNH — it's lost −39.01% over the year.
Dow Jones Industrial Average Index is just a number that lets you track performance of the instruments comprising the index, so you can't invest in it directly. But you can buy Dow Jones Industrial Average Index futures or funds or invest in its components.
The Dow Jones Industrial Average Index is comprised of 30 instruments including NASDAQ:NVDA, NASDAQ:MSFT, NASDAQ:AAPL and others. See the full list of Dow Jones Industrial Average Index components to find more opportunities.