DOW Jones WXYXZ Pattern seems to be complete.DOW Jones WXYXZ Pattern seems to be complete even though the Fibonacci extension XYXZ is just 0.9 and not =>1. Reason being XZ retracement has completed 5 waves showing > 2.68 times retracement starting from 2nd X. But we will get the confirmation of the reversal only if 2 daily candles closes above 31021. Thus we can start accumulating good stocks in small quantities at any retracement from here.
DOW Jones can correct till 27210 as well.
Trade ideas

Dow jones made lower low yet again Dow jones has making lower lows with lower highs which is not a good signal in upcoming 6 months for USA and other economies such as Nifty.
To know full analysis kindly click on the
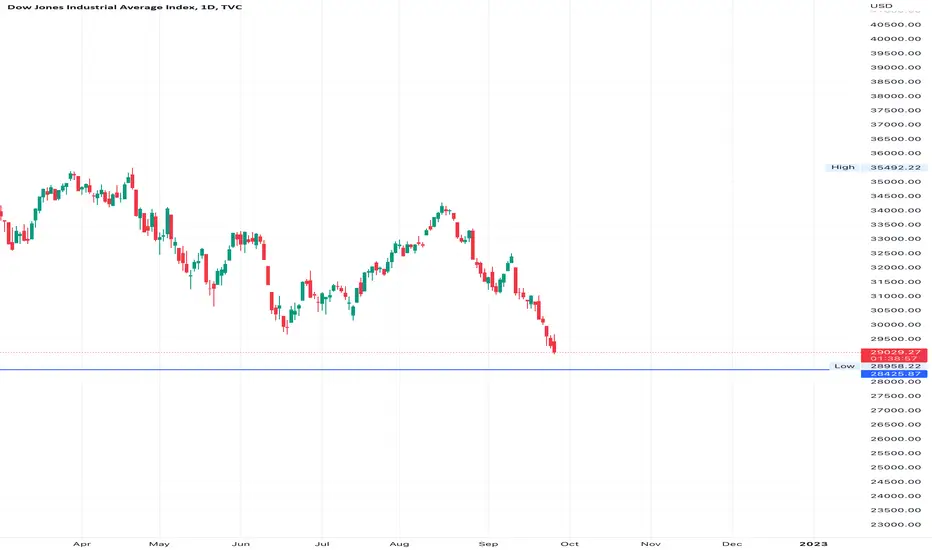
Dow JonesDow jones will revert back of area between 28500-28000.
There is a huge demand zone. As mention in chart

Dow Jones - Inverse Cup and Handle / Rounding Top - Key levelsTrading at key support now.
Levels in the chart.
Forming lower lows so far.

Dow Futures- What next after 52 week low ? Dow futures are trading near a very strong demand zone. the possibilities from here could be
it keeps consolidating - accumulation happens for sometime in this zone and jumps from here
it retraces quickly as per harmonic to 30900 lvls and falls from those levels
it continues to fall and may come back to re-test and down move continues
the probability of it retracing to 30900 lvls looks higher due to harmonic pattern, AWAP support , demand zone plus few sellers would prefer booking something at these levels and few buyers would try to average out at these levels so that they get decent exit.
What could be a possible trade ?
Good risk - reward would be to go long with small SL of 28900 lvls got a target of 30900.
Let me know if you guys think otherwise or have any better idea
Safe Trading

DowDow Trading setup
closing above resistance will trigger buying and forming temporary bottom
closing below support will trigger more selling pressure
I'm thing Dow is making a temporary bottom
Good R:R

Inverted Cup and handle Pattern : DJITechnically, Dow is really at a critical zone. Keeping in mind that Equity is a growing asset, today's DJ:DJI session would be very Important. DJI has given a close below its neckline and completed its Pattern. There are concerns of recession as well. Will the DJ:DJI fall and complete its target or there will be pattern failure? Here ADX is showing above 24, indicating that markets are about to trend. Rsi indicates the oversold condition in the market.
* It is just my analysis and no recommendation of Buy or Sell is Given.

WE BOUNCE THIS WEEK!Historically, when 200 MA is tested on weekly frame, it bounces. IM looking for this bounce- retest- lose 200- bearish retest- continuation to downside.

DJIAAs said in earlier update, 29890_29400 support zone and 200 WMA have been tested and made low 29250 but closed in between the support zone. Now sustain above this, we may see bounce or
below that, there is a unfilled gap zone in between 28902_28495 which may act as support for near term

Inverted Cup & Handle pattern in monthly timeframeHello All,
Market is at very important point where it can take support and go higher and if rejection we have big fall.
My expectation is at least 3000 points if cup and handle broke.
FED hike warnings really bothering the market and on Friday it broke previous low and touches 20% fall from Jan 2022. However if it closed with the same momentum on Friday then we would’ve seen big gap down on Monday opening.
Please note this is just my observation only and for purely for educational purposes.
Trade at your own risk.

Dow JonesW got a HAMMER candle on the DJIA on a DAILY basis,,, and I think an UPSIDE will ensue, upto the Range as pointed out by the RED ARROW. However, we are in an ABCD pattern on a Longer Time Frame, pointing towards 27600, which is where the Downturn should End. It has become a very interesting phase in the Times of the Financial Markets. As markets are going Lower...... People are getting More n More BEARISH.
Mr Bhardwaj........ Let me understand the LOGIC from your """ I HAVE BEEN TOLD NIFTY WILL GO DOWN TO 15300"" SOURCE..... what his/her Logic is ???? This I have been told, OR I heard OR SOMEONE TOLD ME doesn't work in the Market. And for GODS sake, please keep HERESAY OUT of the Picture. Show me the LOGIC.... if you cannot, DO NOT COMMENT

DOWJONES LONGNote : Trading in any financial market is very risky. I post ideas for educational purpose only. It is not financial advice. Do not hold us responsible for any potential loss you may incur. Please consult your financial adviser before trading.


Dow JonesI expect a MAJOR LOW on the DJIA to settle at apprxxx 28300-28700 range . Thereafter a 29-22 % RISE upto apprxx 36000 and MAYBE beyond that into iii/3 . This WAVE should and WILL be the MOST REWARDING once you catch it

DJI Seems Weak! S1-30520 & S2-29589 may act as supports.DJI's significant "Strong Weekly Closing" confirmed breakdown. Besides this, extreme volatility spurt in VIX too signaling the weakness. Although i am a learner. But this is somewhat remarkable. So sharing this view!
Thanks

dow making head and shoulders dow making head and shoulders seems like a genuine breakdown but market is king !

DOWJONES possible levels in 2023It looks like Dow Jones is ready for a new low of 25300-18150 in 2023. (This statement is purely based on Charts and some Economical analysis.)
while Indian Markets are ready for a new high of 19900-20840 and this too based on Charts only. Please do your own analysis

Dow Jones technical analysis ahead of FOMCThe US headline CPI data released last week surprised the market with a smaller drop than expected. As such, a higher chance is being given to a 75-basis-points rate hike in the upcoming September FOMC meeting. The US stock market reacted with a major sell-off last week, signalling that the summer rally has overstayed its welcome.
The Dow Jones plunged by 1,300 points or 4.2% last week. The S&P500 dropped by 5.2%, while the NASDAQ declined by 6.0%.
The interest rate decision from the Fed due this Wednesday (UTC -4) will be a significant event for US markets this week. The market is currently pricing in an 85% chance of a 75bps rate hike and a 15% chance of a 100bps hike.
Looking at the current price action for the Dow Jones in combination with the Schaff Trend Cycle indicator, indicates that the downside's strength still present and may continue to stick around. The Schaff Trend Cycle is currently sitting far below the 25 level at sub-5.
However, this indicator’s current condition may also be a sign that the Dow Jones may be oversold. In such a case, we might expect the index to perform a reversal and retest the 31,200 level, before continuing the downtrend. Traders looking for a counter-trend trade might want to watch and wait for the Schaff Trend Cycle to close above the 25 levels.
With the upcoming FOMC meeting and the expectation of a 75bps or greater rate hike, we may expect a reaction to the downside during the day and a hitting of the 30,000-support area. Breaking below the 30,000-demand zone will open up the 29,500 to 29,000 targets.

Dow JonesI have put before you what I perceive to be the DJIA analysis based on EW. Since the DJIA history is far more complex and goes way way back even before we had any sort of exchange in India, I have taken the Liberty of avoiding the minute/minor waves as the Chart would get tooooo Messy.
However, I have marked out the wave counts from 29568, and so far it is playing to the HILT as per EW.
On the Current wave going ON on DJIA. We have completed i/3 and are currently in ii/3 down. This ii/3 can be calculated @ 38.2 to 61.8% of the ENTIRE RISE from 18213 to 36679. If you calculate it, you will get a figure of 29600 @ 38.2% retracement. However I have gone just a Little bit below to show it as a THROW UNDER which it will do to throw out every BULL.
The WORLD is Totally Bearish and BULL MARKETS are created on FEAR ( covid) ( ukrain) etc etc. History shows and Each One of you needs to see this..... whenever Interest rates have Risen, Markets have had a Temporary BLIP downwards, but in the subsequent years have given a CAGR of almost 12% more or less.
To Me, it seems like WORLD MARKETS WILL ALLIGN WITH THE DOW JONES NOW. They are all going to move forward in very similar directions/patterns/trends. Nifty will align with the DJIA as both are in wave ii/3 currently. Once the Divergence on Both comes to some sort of Same Level...... markets are likely to take off.

DJIADJIA breached the falling trendline resistance & 50 WMA but can't hold above it, formed shooting star & evening star pattern near critical resistance and falling down.
Now 29890_29400 will be next support zone where 200 WMA too converges. Below that, there is a unfilled gap zone in between 28902_28495 which may act as support.

DJI 1 DAY CHART This is just view of DJI 1D chart that break the trendline in major time frame so if you are long in DJI so cut your long position and take bearish bate. And target in short term is 30600 in downside and further fall coming the break of 30600.

DOW JONES 30 sell mode active soon AS PER THEPRICE ACTION DOW JONES HAS CRACKED PROPERLY. there is some important levels has been drawn for reference, which can be a used as support so if any level breached on 5 min tf then go for down side as target. do the same untill 2 stop loss gets hits..
