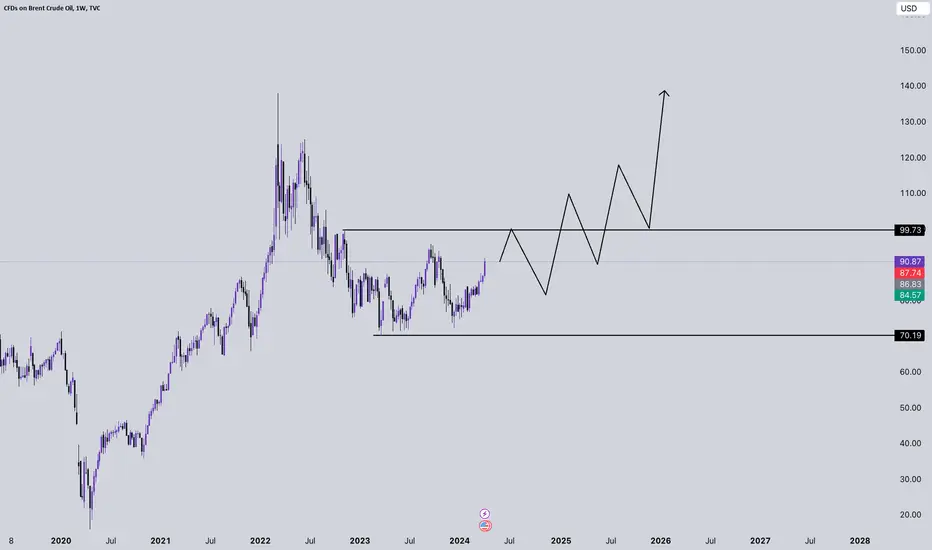
UK OIL Technical Analysis - The weekly outlook for UK Oil looks very positive and promising
- The base is getting matured on the weekly whereas the Daily base has already matured
- As of now waiting for the base to form and enter once you see a low getting taken out by huge demand
- My Bias over this is straight bullish and nothing else to consider
Trade ideas

UKOIL BRENT CRUDEAfter 5months of rigorous compression it nears its long term resistance trendline
With VCP pattern its likely to break resistance forming upthrust candle.stop loss closing below the rising support trendline

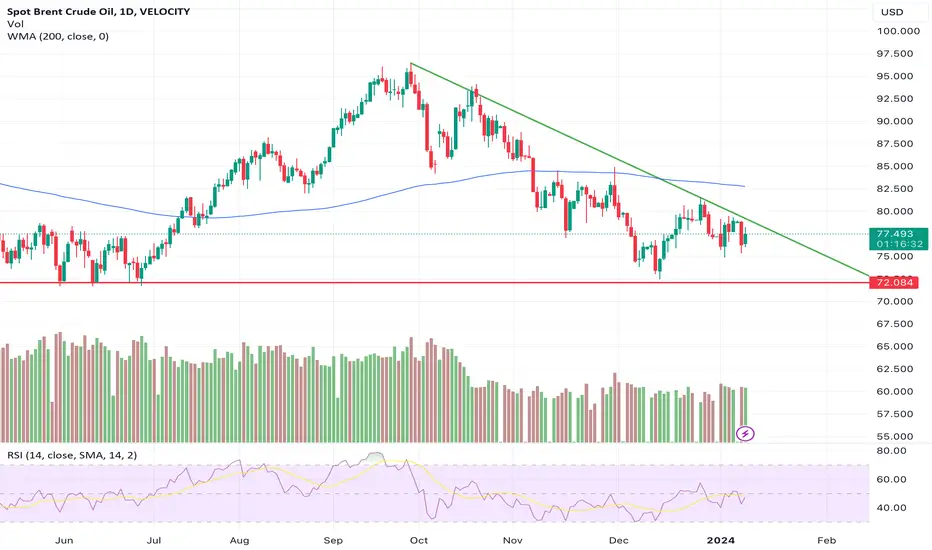
Crude levels - Bearish bias due to fundamentalsOn a downtrend with strong support at 72. On confirmation of breaking upper line can enter but problem is with fundamentals. Saudi cutting 2 dollars is bearish as it decreases the incentive for US producers and showes the lack of confidence with respect to demand. So Can even push below the 72 support and go down before uptrend. Till then wait and watch
UKOIL is on hourly demand zone. Good opportunity to go long .UKOIL is came back 3rd time on its major demand zone. I am expecting to go up in US session. this is a swing trade so hodl it.

Oil headed towards $60. A Real possibilityOil has tendency to fall by more than 70% from the top. After topping out at $138. After many production cuts and effort to arrest fall in price by OPEC+ and news that Oil is headed to $300, Oil continues to show weakness. Lower demand from bigger economies, expectations of falling Oil price and shift to alternate fuel will further pull-down Oil prices, possibly to $60 by end of year 2024.

Brent Crude Oil - Target US$ 93Brent Sweet Crude completed primary wave 4 with satisfactory completion of pattern, down to the miniscule degree, yesterday. The rebound since then, appears to be the impulse of primary wave 5, though its too early stage to conclude whether it would be impulse or diagonal. Even if wave 4 were to continue into double correction, there should be retracement back to $84-86 to achieve 50% retracement back forming X to pave way for double threes. However, given the primary 1 to 3 structure and pattern, previous cycles' internal characteristics, it seems less probable that this primary wave 4 would take a double or triple three route.
In either condition, whether the current upswing is impulse of wave 5 of primary degree, or X of double correction, $84 is the first target, thereafter $93+.
Opportune time to open long, when the world is offloading stocks, that's the time to buy. I am adding fresh long to my existing long position (though I am bit late, yesterday on completion of pattern I was convinced, but wasted time in reassurance through many iterations).
Disclaimer : The contents herein are my personal views, for me to make an investment decision, shared here with an objective of seeking views and comments from traders community at trading view platform. Nothing contained herein should be construed as an advice, offer, inducement or encouragement to buy or sell any shares, security, derivatives linked to the security, debt security or any other security of the company mentioned herein. The readers must make their own independent assessment, evaluation and valuation of the company and/or any of the securities issued by it or referenced to it. The reader is advised to take advice from their professional financial advisors before entering into any transaction or making a financial decision, without relying on anything contained hereinabove, or views given as addendum or comments hereafter. The author shall not be responsible or liable, directly or indirectly, for any loss or damage, including loss of profits, caused to the reader, or any other person or third party, whether pecuniary or otherwise, whether in present or in future, whether incurred or probable. Any replication of the contents herein is strictly prohibited except with the prior written consent of the author.

Crude oilaccording to wave analysis still i can't say that correction is all completed as we can see chart so it can be double zig-zag and will reach to 65 and then bullish run is going to start and will reach at least 187 and then 263 after that corrrection is going to come for 4th wave.

Crude Oil Monthly UpdateCrude Oil again proved that Volatility means 'Crude Oil'
Only a Professional Trader can win with the success ration of 70-80% max if trade reglarly.
Now imp levels for the month of Dec is disclosed in this very imp video...
Kindly watch

Crude Oil Short Term OutlookCRUDE OIL Clearly visible triangle formation
TREND IS RANGE BOUND to NEGATIVE

Top down Annalise on BrentcrudeBlack horizontal Trandline# monthly
Red Trandline# weekly
Blue Trandline#daily
Lower range 70 & higher range is 98 now trading @ 80+ it's nearly lower range
If brent trade in 70/80 range for at least 6 month it's very good for indian stock market

Crude Short Sell LevelThe chart has the key level marked out. 85.70 will be a great level to short the commodity. The trend remains down though we have now reached a support and also the oscillators are oversold which will lead to some mean reversion. So best to wait for the level to be reached on the bounce and then short sell the commodity.

CRUDE oil seems like in no trade zoneCRUDE OIL or USOIL is in right range between 86.6 and 88.8
Major support is at 86 and 85.3.
Any movement above 89 or below 85 would have huge impact on Indian markets

#crudeoil - looking at a good Upmove.#crudeoil - looking at a good Upmove.
PS : Only for learning purpose. Pls observe.
CMP : Crudeoil MCX 7k Call at 302.50 INR

Analysis of Cruedoilbelow is analysis of crudeoil (BCOUSD) please watch it carefully it looks like bearish in short term for upcoming 3-4 days.

Brace for Brent $100 by next monthBrent oil completed it's correction last week after RSI divergence, and is now increasing strongly supported by good volumes. Next overbought zone on RSI places Brent around $100 mark.

Brent Oil buyers need validation from $92.50Brent oil buyers take a breather after posting the biggest daily jump in six months as the overbought RSI (14) line prods the energy bulls below a three-week-old horizontal resistance surrounding $92.50. However, a clear upside break of the 200-SMA and bullish MACD signals suggest further upside of the black gold price. Hence, the quote is likely to cross the immediate hurdle surrounding $92.50, which in turn will allow bulls to challenge the monthly high of around $94.30. In that case, September’s peak of near $96.50 and the $100.00 psychological magnet will be in the spotlight.
On the contrary, Brent Oil’s pullback remains elusive beyond the 200-SMA support of $90.80, quickly followed by the $90.00 threshold. Following that, a broad horizontal area comprising multiple levels marked since early September, close to $89.00-50, will challenge the energy sellers. Should the Oil bears manage to conquer the $89.00 support, its fall to the previous weekly low of $85.76 becomes imminent. However, the monthly low of $84.17 and the previous monthly trough surrounding $82.00 will test the south-run afterward.
Overall, Brent Oil price stays on the way to refreshing the monthly high unless it breaks the $89.00 support.

Brent Crude: Set for 104-108The chart set up suggests support around 85-87 odd levels
Minor resistance around 98 and eventual target for the set up could be 104-108
Risk::Reward ratio favors to go Long
Take care & sage trading..!!!
Disclaimer
-The view expressed here is my personal view
- Past performance is not a guarantee for future predictions
- I have been wrong in the past and can be wrong again in future too
- Use this for educational purpose
- Any decision you take, you need to take responsibility for the same
- It's your hard earned money. Treat it wisely
- Trade / Invest keeping in mind your trading style, goals and objectives, time horizon & risk tolerance
- if trading in F&O, understand that F&O trading involves risk
- Do take proper risk management measures
- Do your own analysis and consult your financial adviser if need be

The great N appears on Brent CRUDEThe great N appears on Brent CRUDE with 100 Dema crosses over 200 dDema.
#crude #oil

Short Crude oilThe 200 MA and the key pivot levels are all aligning. This also looks like an inclined head and shoulder pattern. The level marked on the chart is a very important level and as long as the market is below the level we expect the selling pressure to continue on the commodity.

Bullish Crude🟢RSI (14) on the #CRUDE UKOil 4D chart has crossed 50 mark
🟢Crude taken support near the long term support of 70 mark.
🟢It has given buy signal at 74.60 on VSA Momentum indicator.
🟢Can go to 89/99 in up coming months. Medium term. SL-70

CRUDE OILBreaking out of crude oil, a role of a villain to play a party pooper for Bhartiya Stock Market.

UK OIL 📈 Exciting Bullish Pattern Alert
📊 Pattern: Base Building
📌 Symbol/Asset: UK OIL
🔍 Description: The target of multiple patterns is pending, stock bounced back from solid support. Future & Options segment stock.
👉 Remember: Technical patterns are just one piece of the puzzle. Consider conducting further research, consulting with a financial advisor, and managing your risks appropriately.
