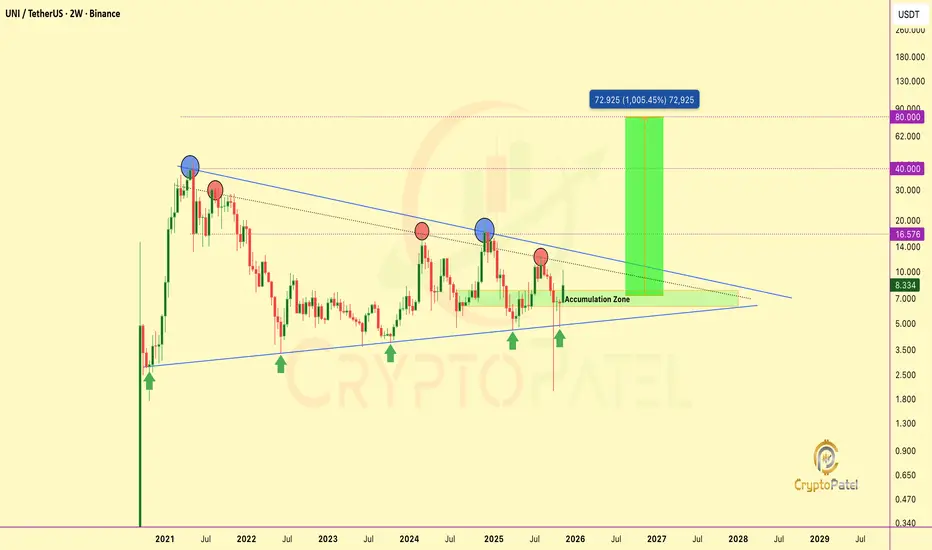
$UNI TA + FA align: Breakout loading toward $80CRYPTOCAP:UNI TA + FA align: Breakout loading toward $80
#UNI is coiling inside a multi-year descending triangle, with strong accumulation at $6–$7.
A breakout above $9–$10 could confirm a macro trend reversal toward $16.5 → $40 → $72+
Catalyst: Uniswap CEO Hayden Adams proposes turning on protocol fees, burning UNI & making it deflationary.
TA + FA = Bullish Expansion Loading...
NFA & DYOR
Trade ideas
UNIUSDT LONG H4 Entry breakoutTechnical Analysis (UNI/USDT – 4H Chart):
UNI is currently testing a key resistance zone at 6.9–7.4 after a short-term uptrend. A confirmed breakout above 7.4 could open the way toward 8.5 and 11.5 targets. The main support lies at 5.77.
Risk–reward ratio from current levels is around 1.4:1 (target 8.5) and 4:1 (target 11.5).
A rejection from resistance may trigger a pullback toward 5.77, while a strong 4H close above 7.4 signals bullish continuation

UNIUSDT: Are We on the Verge of a Bullish Breakout?Yello, Paradisers! The UNIUSDT chart is shaping up with some bullish signals, but will they lead to the rally we're looking for? Let’s dive into the setup.
💎UNIUSDT is currently displaying a strong bullish market structure, forming an inverse head and shoulders pattern. This classic formation is known for signaling potential trend reversals—if it plays out, it could lead to a notable move upward.
💎If UNIUSDT breaks out and closes a candle above the resistance zone, it will confirm this pattern, significantly increasing the probability of a sustained bullish move.
💎In the event of a pullback, we could see a double-bottom pattern forming around the support zone. For those tracking lower timeframes, it may be wiser to wait for a bullish I-CHoCH, as it could improve the odds in our favor before entering.
💎On the flip side, if price breaks down and closes a candle below the support zone, it would invalidate our bullish scenario. In that case, patience will be key—waiting for better price action and stronger signals will keep us on the right side of the trade.
Remember, Paradisers, trading is a game of probabilities, not certainties. Only disciplined traders who can master the art of patience make it far in this market. Stay focused, stay sharp, and trade strategically!
MyCryptoParadise
iFeel the success🌴


#UNI/USDT Bullish Momentum Building#UNI/USDT has shown a bullish divergence and is currently attempting to break through a significant resistance level. If it is able to successfully break this resistance, we could see a strong bullish movement in the market.

Uniswap Drives A Surge In L2 Trading, Will It Be Enough To Fight
Uniswap is one of the most popular decentralized trading platforms currently present in the market. It is an AMM and was launched way back in 2018 and has gained significant popularity since then. The platform provides liquidity and gives much more value to the Defi sphere.

💎 UNIUSDT: Potential bounce waiting for us.💎 Paradisers, #UNI is exhibiting a bullish market structure & has taken liquidity by breaking below the supportive trendline.
💎 You might have noticed that #UNIUSDT has bounced precisely from the bullish Order Block (OB), indicating that pending orders have been filled at this level. However, for confirmation, we need to see signs of a Change of Character (CHoCH) and a Break of Structure (BOS), and remember, the market is bearish in the short term, so caution is advised.
💎 If the price continues to break down below this point without any bullish signals, then we might expect a bounce from the demand level, but we'll need to see bullish signs for confirmation here as well.
💎 If the price further breaks down below these levels, it would be wise to wait for better price action to develop before making any decisions.

UNISWAP dump 20% within 24 hours but Why ?⚡️ Breaking News: SEC vs. Uniswap
What's Happening?
In a major escalation by the #SEC and White House, Uniswap, faces legal challenges. Instead of recognizing haydenzadams as a pivotal entrepreneur, they're taking him to court.
Why It Matters: This isn't just a problem for Uniswap. It's like the government starting a fight with the whole Crypto
Prices Falling Fast:
UNI's Big Drop: The price fell 20% from $11.11 to $9 within 24 hour after Uniswap got a warning from the SEC.
More Bad News: Because of this warning, Uniswap's token price went down 20%. It looks like they might get sued.
Everyone, Pay Attention!
Stay updated and stand up for crypto
#Uniswap #UNI CRYPTOCAP:UNI

UNI/USDT formed bearish divergence UNI volume is decreasing and formed bearish divergence , so time to grab uni.
Fair price to buy : 8.5$
IMP support is 8$

Uni Growth Spurt: Buy Your Ticket to Profit!Uniswap (UNI) Coin: Fundamentals, Recent News, and Disclaimer
Fundamentals
Uniswap (UNI) is the governance token for Uniswap, the largest decentralized exchange (DEX) on the Ethereum blockchain.
Launched in November 2018, Uniswap allows users to trade cryptocurrencies directly with each other without a middleman through an automated system called an automated market maker (AMM).
UNI token holders can participate in voting on proposals that affect the future development of the Uniswap protocol.
Recent News
Uniswap price currently sits around $12.83 USD (as of March 31, 2024).
The token has seen moderate growth in the last 24 hours.
Uniswap continues to face competition from other DEXes, but it remains a major player in the DeFi space.
Disclaimer
I am not a financial advisor and this is not financial advice. Investing in cryptocurrency involves a high degree of risk. Do your own research before making any investment decisions.

UNI a nice bull examplehere we can see many signals specially that we touch support then went 20% up , what a ride!!


UNI/USDT Analysis: Potential Correction towards 4.8-4.9 ?
UNI/USDT is currently facing a significant resistance area between 5.65 and 5.70.
Traders should closely monitor price movements within this range, as a breakout above it could signal a bullish trend continuation.
However, our analysis suggests that a price correction is likely in the near term. We expect UNI/USDT to correct towards the key support level at 4.8-4.9.
This correction would provide traders with an opportunity to consider long positions at a more favorable entry point.
Additionally, the 5.65-5.70 area has witnessed a support-resistance flip, indicating a shift in market sentiment.
Previously acting as a support, this zone has now turned into a resistance level. Traders should pay attention to this flip, as it may act as a catalyst for the anticipated price correction.
Despite the recent resistance, the price of UNI/USDT has been exhibiting upward movement by forming higher lows. This indicates the presence of an underlying bullish momentum in the market.
Conclusion:-
In conclusion, UNI/USDT is currently facing resistance in the 5.65-5.70 zone, while a correction towards the support level at 4.8-4.9 is expected. Traders should monitor the support-resistance flip and price movements for further confirmation.


UNIUSDT shortUni is overbought an most tfs. As per 3h tf, I think it will face a correction but not so deep. Lets see what happens. DYOR. NFA.

UNIUSDT CRYPTO crypto name : uniusdt
call type : positional
- crypto is sideways from last 300 days and forming a triangle pattern, currently crypto is breaking the channel
- forming lower high and lower high
- we can accumulate this crypto at current levels for target 10 $ , 12 $ and 18 $
Thanks

UNI/USDT SHORTTechnical analysis:
. UNIUSDT is in a range bound, and the beginning of an Downtrend is expected.
. It has Formed a Rising wedge pattern wich indicates the price to come down.
Take Profits:
TP1= @ 5.44
TP2= @ 5.00
TP3= @ 4.50
SL= 6.35
HAPPY TRADING.

💡Don't miss the great buy opportunity in UNIUSD @UniswapTrading suggestion:
". There is a possibility of temporary retracement to the suggested support line (6.25).
. if so, traders can set orders based on Price Action and expect to reach short-term targets."
Technical analysis:
. UNIUSDT is in a range bound, and the beginning of an uptrend is expected.
. The price is below the 21-Day WEMA, which acts as a dynamic resistance.
. The RSI is at 61.
Take Profits:
TP1= @ 6.70
TP2= @ 7.05
TP3= @ 7.37
TP4= @ 7.53
TP5= @ 7.79
SL= Break below S2
❤️ If you find this helpful and want more FREE forecasts in TradingView
. . . . . Please show your support back,
. . . . . . . . Hit the 👍 LIKE button,
. . . . . . . . . . Drop some feedback below in the comment!
❤️ Your support is very much 🙏 appreciated!❤️
💎 Want us to help you become a better Forex / Crypto trader?
Now, It's your turn!
Be sure to leave a comment; let us know how you see this opportunity and forecast.
Trade well, ❤️
ForecastCity English Support Team ❤️

UNI is trying to get in the uptrendMy analysis says if it retests the lower level of trend UNI price may go to 7.8. I will try to open my long at 7.15 if the price comes down with a target of 7.7 and stoploss near 6.8.

💡Don't miss the great buy opportunity in UNIUSD @UniswapTrading suggestion:
". There is a possibility of temporary retracement to the suggested support line (7.38).
. if so, traders can set orders based on Price Action and expect to reach short-term targets."
Technical analysis:
. UNIUSD is in an uptrend, and the continuation of the uptrend is expected.
. The price is above the 21-Day WEMA, which acts as a dynamic support.
Take Profits:
TP1= @ 7.77
TP2= @ 8.17
TP3= @ 8.74
TP4= @ 9.57
TP5= @ 10.08
SL= Break below S2
❤️ If you find this helpful and want more FREE forecasts in TradingView
. . . . . Please show your support back,
. . . . . . . . Hit the 👍 LIKE button,
. . . . . . . . . . Drop some feedback below in the comment!
❤️ Your support is very much 🙏 appreciated!❤️
💎 Want us to help you become a better Forex / Crypto trader?
Now, It's your turn!
Be sure to leave a comment; let us know how you see this opportunity and forecast.
Trade well, ❤️
ForecastCity English Support Team ❤️

📚Learn More💰Earn More - Inverse Head and Shoulders in UNIUSD📚 LEARN MORE
💰 EARN MORE
Inverse Head and Shoulders Definition:
A head and shoulders pattern is also a trend reversal formation.
It is formed by a Valley (left shoulder), followed by a Lower Valley (head), and then another Higher Valley (right shoulder).
A “Neckline” is drawn by connecting the highest points of the two Peaks. Neckline resistance does not need to be strictly horizontal.
This illustrates that the downward trend is coming to an end.
When a Head and Shoulders formation is seen in a downtrend, it signifies a major reversal.
The pattern is confirmed once the price breaches the neckline resistance.
In this example, we can easily see the head and shoulders pattern.
How to Trade the Head and Shoulders Pattern:
ENTRY:
we put an entry order above the neckline.
TARGET:
We can also calculate a target by measuring the lowest point of the head to the neckline.
This distance is approximately how far the price will move after it breaks the neckline.
❤️ If you find this helpful and want more FREE forecasts in TradingView
. . . . . Please show your support back,
. . . . . . . . Hit the 👍 LIKE button,
. . . . . . . . . . Drop some feedback below in the comment!
❤️ Your Support is very much 🙏 appreciated!❤️
💎 Want us to help you become a better Forex trader?
Now, It's your turn!
Be sure to leave a comment let us know how you see this opportunity and forecast.
Trade well, ❤️
ForecastCity English Support Team ❤️

UNI USDTUNIUSDT TA looks good...if we get a rejectionn from this support area our target will be 7.225
DYOR !!!

💡Don't miss the great buy opportunity in UNIUSD @Uniswap
Trading suggestion:
". There is a possibility of temporary retracement to the suggested support line (8.08).
. if so, traders can set orders based on Price Action and expect to reach short-term targets."
Technical analysis:
. UNIUSD is in an uptrend, and the continuation of the uptrend is expected.
. The price is below the 21-Day WEMA, which acts as a dynamic resistance.
. The RSI is at 50
Take Profits:
TP1= @ 9.64
TP2= @ 11.87
TP3= @ 13.67
TP4= @ 16.73
TP5= @ 20.08
SL= Break below S2
❤️ If you find this helpful and want more FREE forecasts in TradingView
. . . . . Please show your support back,
. . . . . . . . Hit the 👍 LIKE button,
. . . . . . . . . . Drop some feedback below in the comment!
❤️ Your support is very much 🙏 appreciated! ❤️
💎 Want us to help you become a better Forex / Crypto trader ?
Now, It's your turn !
Be sure to leave a comment; let us know how you see this opportunity and forecast.
Trade well, ❤️
ForecastCity English Support Team ❤️
