S&P 500 Bearish Reversal Setup: Short Entry Below Key ResistanceEntry Point: Around 5,678.79
Stop Loss: Around 5,833.61 (above recent resistance zone)
Target Point: Around 4,831.37 (indicating a bearish target)
2. Technical Patterns:
The price hit a resistance zone (highlighted in purple) and reversed—this is often a bearish signal.
The trendline break (marked with the orange dot and blue arrow down) suggests a potential trend reversal.
The moving averages (likely 50 EMA and 200 EMA) indicate the price is still above the support zone but weakening.
3. Risk/Reward Ratio:
Risk (Stop Loss – Entry): ~154.82 points
Reward (Entry – Target): ~847.42 points
Risk/Reward Ratio: Approximately 1:5.5, which is favorable for shorting.
4. Trade Sentiment:
Bearish bias based on the breakdown from the resistance zone and confirmation from chart patterns.
If the price fails to hold above 5,682.87, a short trade may be validated with the target at 4,831.37.
Trade ideas

Professional Trade Analysis: S&P 500 Index (SPX) – Swing Trade SChart Overview
Your chart shows the S&P 500 Index (SPX) on a daily timeframe with:
Recent strong bullish candles
Price reclaiming above short-term moving averages
RSI and MACD indicators showing bullish momentum
Well-marked support/resistance zones
Current Market Structure
Trend: The index is bouncing from a recent low, showing a potential trend reversal or strong corrective rally.
Support Zone: Around 5,250–5,300 (recent swing low and demand zone)
Resistance Zone: Around 5,800–5,900 (previous supply zone and near the upper edge of your marked green box)
Entry: Price is currently near 5,686, above the moving averages, confirming bullish momentum.
Suggested Swing Trade Plan
1. Bullish Bias (Long Position)
Entry: Around current price (5,650–5,700), ideally on a minor pullback to the 5,600–5,650 area for better risk/reward.
Stop Loss: Below recent swing low or the lower edge of your marked red box (around 5,425–5,450).
Target: 5,800–5,900 (upper resistance zone).
Rationale:
Strong bullish momentum, confirmation from RSI and MACD.
Price action has broken above moving averages.
Clear swing structure with defined risk and reward.
2. Bearish Bias (Short Position)
Consider only if: Price shows strong rejection at 5,800–5,900 with bearish reversal candlesticks or negative divergence on RSI/MACD.
Entry: Near 5,850–5,900 (if reversal signs appear).
Stop Loss: Above 5,950.
Target: Back to 5,600–5,650.
Key Professional Tips
Wait for Confirmation: If entering long, wait for a minor pullback or bullish reversal candle near support.
Risk Management: Risk no more than 1–2% of your capital per trade.
Monitor Indicators: Watch for RSI overbought/oversold and MACD crossovers for early exit signals.
Adjust Stops: Trail your stop-loss as price moves in your favor to lock in profits.
News Awareness: Be aware of any major economic events or earnings that could impact volatility.
Summary Table
Direction Entry Zone Stop Loss Target Zone Rationale
Long 5,650–5,700 5,425–5,450 5,800–5,900 Bullish momentum, trend reversal
Short* 5,850–5,900 5,950 5,600–5,650 Only on bearish reversal signal
*Short only if reversal is confirmed at resistance.
Final Note
Your setup is solid for a swing trade. Stick to your plan, manage risk, and let the price action guide your decisions. Happy trading! 🚀
If you want analysis on other instruments or more trade ideas, let me know!
S&P 500 Index Futures (ES)
Highly liquid and volatile, ideal for swing trading both bullish and bearish trends.
Strong, well-defined support and resistance zones.
Broad market exposure with frequent swings, making it suitable for price action strategies

S&P 500 reaches a crossroadhe S&P 500 index is very close to the trendline of the rising channel that it broke earlier along with the upper band and 66% retracement mark all together near 5700. The rise is three waves so far and if we top out near this resistance range then it was an X wave.

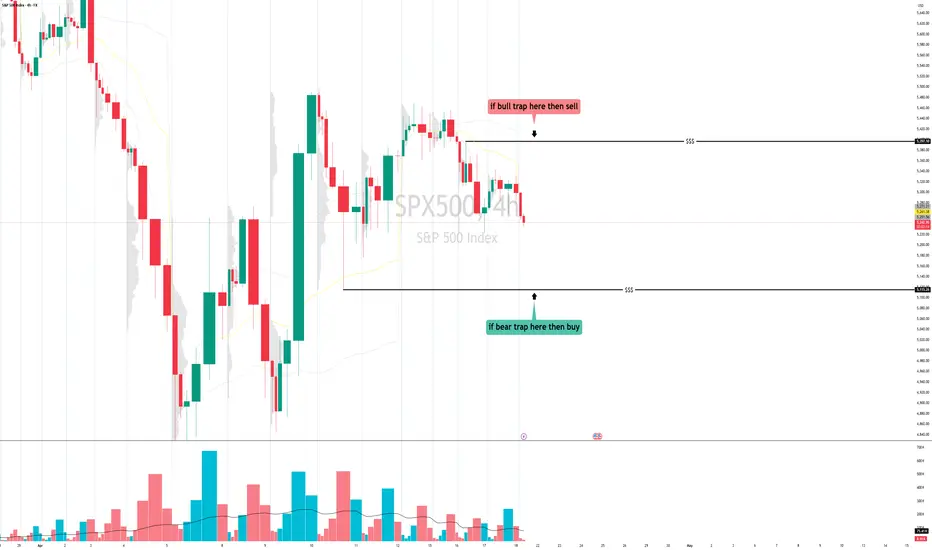
SPX wait bull trap and bear trapWait for confirmation of bull trap closing below liquidity line
Wait for confirmation of bearish trap closing above liquidity line
--
Trade carefully
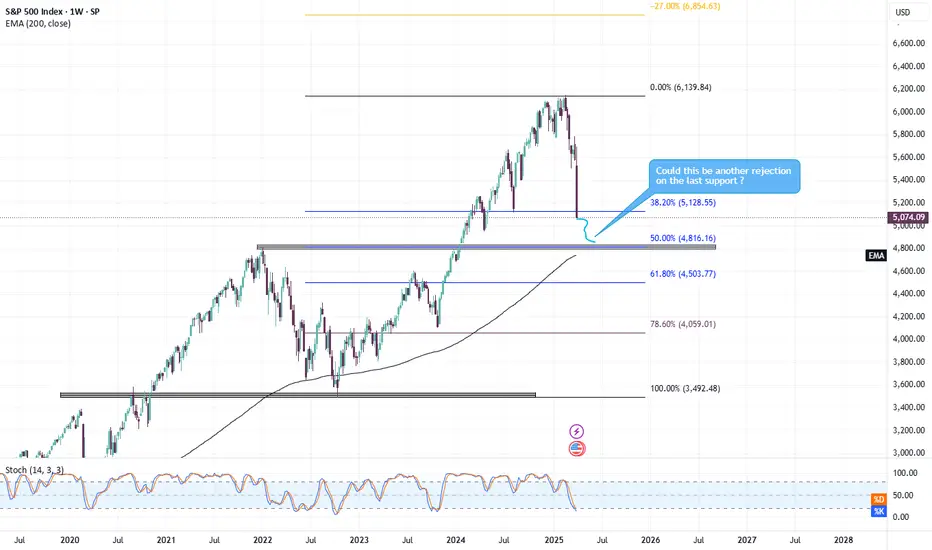
SPX LONGLooking at the chart right here, as we can see the S&P 500 is bottoming, and we will see the same thing happened on 9 May 2022, so what I see or expect from the 2025 correction is rejection to the 50% fibonacci retracement which is around 20% or we can expect a deeper correction which is to the 61.80% and also with the rejection to the MA200 and hope it bounces back up, let me know what do you guys think about SP500 right now
Sell SP500 and Waiting !!!!Everyone hoped Donald Trump would help the whole world — but no, he tore everything apart.
The S&P 500 broke the trendline and created a fakeout to make people believe there was no collapse coming.
Because the price touched support–resistance zones and bounced back strongly, I believe there’s no real growth — only an impending breakdown from the upper price range.
Stoploss and Take profit in this pictures.
Good luck all!

The Great S&P 500The S&P 500 is sitting comfortably on its scripted support, just waiting to see if it holds or breaks. Let’s hope our current American businessmen don’t make any decisions that might actually improve things! Wouldn't want him accidentally turning the world into a better place.

SPX probability of making top in December in zone 6500-6700 are getting higher in 2025 early 4-6 month can see correction of 10-15% as price are getting close to rising resistance trendline .Lets see 2025 .
(This are my personal views i might be wrong to )

S&P - Support is at 5070 or 4747 ?S&P would have fallen even if Trump didn't announce new tax on other countries. S&P has reached all my previous targets and there was no higher target left without a correction now. And this correction was expected fall and its been so steep and fast only due to new flow about tax. It has broken few previous support levels and from now first support coming at 5070 which is rising wedge target and also near to fib level and 4747 is ABC correction target which is the maximum low or correction can be expected in normal situation. In my view tax on other countries only supports domestic growth and in coming months US GDP will keep increasing only. so the latest tax news is supportive thing for equity market in 6 months to 12 months for sure. Use this for educational purpose and consult your advisor for any investment or trading. I am trying my best every time to time the market to help others.

SP500 TODAY GAP DOWN TO BULL TRENDSP500 TODAYS TRADING GAP DOWN TO BULL TREND The Institute for Supply Management's Chicago PMI reading rose to 47.6 in March from 45.5 in February, higher than the expected 45.0 print in a survey compiled by Bloomberg as of 7:00 am but still indicating contraction in the sector.
The sub-50 reading is in line with almost all of the other regional manufacturing data already released for March. The national ISM manufacturing index for March will be released on Tuesday.

SPX - short term Bearish TrendSPX has reached its given target last year during oct 2024. Nifty failed to follow this trend due to internal fraud work. After reaching the final target now SPX is in correction and small reversal wave as shown in chart. I do not see any strong data or very positive trend which will take spx upside without a correction. One can plan buying at lower levels in few weeks.

S&P 500 sliding down! Markets under pressure #SP500S&P 500 sliding down! Markets under pressure #SP500
📉 The S&P 500 is trending downward today as market volatility rises. Investors react to economic data, Fed policy expectations, and global uncertainties. Stay alert and manage risk accordingly! #SP500 #StockMarket #Investing #trade #markets #finance #money

SnP 500When I said at the end of January 25..... that the Dow was in a HnS formation..... I had calculated the Retracement on the SnP as well. SnP hit a new high and that was just to take out all the shorts on the Futures, and since then it hasn't stopped. Just a reminder what what I had written and the retracement thereof

SP500 at 200 day!!This is at opportunity you dont get so often, IMO! I buy a loooot out this week as we maybe also get a real selloff under 200day.

SPX breakdown on the charts, heavy selling expected!!SPX has reached 100% fib extension levels and will most likely not cross the recent high ~6200.
expect heavy fall from current levels.
as always trade as per your risk capacity.

S&P 500 at Critical Resistance – Breakout or Rejection? Resistance Zone (Highlighted in Red) 🛑
The price is currently testing a strong resistance level near 6,040 - 6,100.
Previous attempts to break this zone have failed, making it a key area to watch.
Ascending Triangle Pattern 📈
The price is forming higher lows, indicating bullish momentum.
If a breakout above 6,100 occurs, it could trigger a strong upward move 🚀.
200 EMA Support (Red Line) 📉
The 200-day EMA is at 5,658.98, providing a long-term support level.
If the price pulls back, this could act as a buying opportunity.
Possible Scenarios 🔮
✅ Bullish Breakout: A breakout above 6,100 could send the price toward 6,200+.
❌ Rejection & Pullback: If rejected, a drop to 5,900 or 5,700 (EMA support) is possible.
Conclusion: Bulls need a clear breakout to push higher, while bears might take control if the resistance holds. 📊🚦 Keep an eye on volume and confirmation candles for the next move!

Vatican Bank Cartel indicator strategy by yashgode9To effectively utilize the "VATICAN BANK CARTEL" indicator, I have developed a trading strategy that has yielded a net profit of 7.23% over three months. This strategy has proven profitable for me, although its success may vary depending on the market conditions in which you choose to trade. It is advisable to avoid using this strategy in highly volatile markets.
Here is a detailed outline of my strategy:
1. Indicator Setup:
- Apply the "VATICAN BANK CARTEL" indicator to your chart with the following settings:
- Depth: 30
- Deviation: 5
- Backstep: 5
- Use a 1-hour timeframe for this initial setup.
2. Secondary Analysis:
- Open a new tab in your browser and access the TradingView platform.
- Set the timeframe to 3 minutes for this second analysis.
3. Signal Interpretation:
- Monitor the 1-hour chart for a "buy" signal.
- Once a "buy" signal is identified, switch to the 3-minute chart to look for corresponding "buy" signals.
- Execute a buy trade on the 3-minute chart when it generates a "buy" signal.
4. Trade Management:
- Close your trade as soon as a "square-off buy" signal appears on the 3-minute chart.
- Continue this process until the 1-hour chart generates a "square-off buy" signal.
Note:- you can also use 5-min chart instead of 3-min chart, use whichever timeframe gives you profitable results.
In summary, this strategy involves taking advantage of “buy” signals across different timeframes, ensuring that trades are aligned with signals from both the 1-hour and 3-minute charts, while being cautious of market volatility.

S&PHello & welcome to this analysis
Today's gap down has covered the gap up made on 6th Nov and completed the formation of a Bullish Harmonic Gartley.
Sustaining above 5850 will confirm the reversal

SP500#1: HOW DOES NONFARM AFFECT SP500?🔎 1/ Fundamental Analysis
🟥 Political tensions:
• The US increases pressure on Russia through energy sanctions. This could lead to trade retaliation, negatively affecting the economy.
🟥 Interest rate policy:
• Interest rates are likely to remain unchanged until June, limiting the amount of money injected into the market – causing concern.
🟥 CPI data next week:
• Inflation is the biggest determinant of interest rate policy. Forecasts show that inflation is likely to increase again, continuing to put pressure on the market.
💡 Basic conclusion:
The market faces a less optimistic sentiment due to increasing economic and political risks.
📊 2/ Technical Analysis
🔵 W (Weekly) Frame:
• This week closed with a long-tailed, long-bodied candle – a strong bearish sign.
🔵 D (Daily) Frame:
• The bearish structure was confirmed after Friday's trading session.
🔵 H1 (Hourly) Frame:
• The bearish price structure is clear: consecutive lower highs, the support trendline is broken.
💡 Summary:
All three timeframes are supporting the downtrend.
📈 3/ Trading Plan
🟢 Correction strategy:
• Support zone: 5676~5750.
👉 Wait for price reaction at this zone to find an opportunity to enter the order.
⚠️ Note: The weekly candle closes badly, profit expectations should not be too high. Do not rush to catch the bottom!
🔴 Trade in the direction of the trend:
Resistance zone: 5890~5915.
👉 Plan: Wait for the price to react at the resistance zone to enter a sell order in the direction of the trend.
🎯 Profit target: 5680 - strong support zone.
❓ Which side are you on - BULL or BEAR?
💬 Leave a comment to discuss and exchange!

S&P completes a counter trend move in three wavesThe S&P 500 closed down last night after what looks like a three-day bounce that ended an a-b-c bounce back. Three waves up after five waves down sets us up for the next five waves down in wave 3. Wave 3 should take us back below the Wave 1 low of 5832

A Stock market crash can trigger a recessionSteepening cycles in the US yield curve have preceded stock market crashes in the past, and so far, this time is no different. As measured by the difference between the 10-year bond yield and the 2-year bond yield, the yield curve is now rising and made a higher high last night. The continued trend is toward a risk-off by investors out of equities into the safety of two-year or shorter-term bonds. Such stock market sell-offs have also resulted in a recession in the past so one follows the next.

S & P 500 : Rising WADGE (Very Bearish)S & P 500 is forming a Rising Wadge Pattern at top. Closing Below 6000 will be a clear breakdown from this pattern.
5440 will be seen as Pattern target.
Put Stoploss on closing basis.
(In Trading Time it may go above/below stoploss But closing price is most important).
These are levels are generated on the basis on Fibonacci Series
NOTE : I am not SEBI registered advisor in capital market.
Disclaimer:- Please always do your own analysis or consult with your financial advisor before taking any kind of trades. Please understand Risk in trading before taking any trade with your financial consult. I am only sharing my knowledge it may be right or sometimes wrong so I am not liable for any loss.
Dear traders, If you like my work then do not forget to hit like and follow me, and guy's let me know what do you think about this idea in comment box, i would be love to reply all of you guy's.
Thank you.

SPX Support & Resistance level for the dayThe S&P 500 Index (SPX) is one of the most widely followed equity indices, representing 500 of the largest publicly traded companies in the U.S. As such, its price action reflects the overall performance of the U.S. stock market and is closely watched by traders, investors, and institutions worldwide.
Volume Profile:
Areas with high trading volume can indicate strong support or resistance, as they signify areas where large institutional orders were placed.
Hypothetical Support and Resistance Levels for SPX:
Let’s assume we’re analyzing the S&P 500 Index (SPX) from recent trends. Below are potential support and resistance levels based on hypothetical recent price action:
Support Levels:
4,100 - 4,150 (Strong Support Zone):
If SPX has tested 4,100 to 4,150 multiple times in the recent past and bounced higher, this could be a significant support range. A break below this range could indicate a deeper pullback.
4,000 (Psychological Support):
4,000 is a major round number and could act as strong psychological support. Traders may look to buy if the price approaches this level.
3,900 (Previous Low / Support Zone):
If 3,900 was a level where SPX previously reversed or consolidated, it could act as a support level. A break below this could signal further downside, with the next support at 3,800.
3,800 (Lower Support Zone):
If the market experiences a major correction, 3,800 might be a significant support level based on previous price action and where the index has bounced in the past.
Resistance Levels:
4,300 - 4,350 (Recent High / Resistance Zone):
4,300 to 4,350 could be key resistance levels if SPX has faced difficulty breaking above this range recently. If it breaks this level, the next target could be higher.
4,500 (Psychological Resistance):
4,500 is another key round number. As SPX approaches this level, selling pressure from traders may increase, making it a likely point of resistance.
4,600 (Next Key Resistance):
If SPX has approached 4,600 previously and failed to sustain above it, this would act as a strong resistance level. A breakout above 4,600 could indicate strong bullish momentum.
4,700 - 4,800 (Upper Resistance Zone):
In a strong uptrend, 4,700 to 4,800 could be the next resistance zone. If SPX reaches this area, it could face significant selling pressure, and market participants might look to take profits.
Key Areas to Watch:
Breakout Above 4,350:
A breakout above 4,350 would be bullish and could indicate that SPX is heading towards 4,500 and possibly 4,600. Watch for a close above this level to confirm strength.
Breakdown Below 4,150:
If SPX breaks below 4,150, it could signal a pullback toward 4,000 or lower. A breakdown below 4,000 would suggest a deeper correction.
50-day and 200-day Moving Averages:
A break below the 50-day moving average could signal weakness in the short-term. Similarly, a break below the 200-day moving average could indicate longer-term bearishness.
