AUD/USDPrice action trading is a method of trading that relies on the interpretation of price movements, rather than technical indicators, to make trading decisions. It's based on the idea that historical price patterns tend to repeat themselves, and that by understanding these patterns,
Trade ideas

AUD/USD Potential Breakout from Descending TrendlineThe AUD/USD pair is approaching a critical breakout point from a descending trendline on the 1-hour timeframe. A series of higher lows indicate bullish momentum building up. If price successfully breaks above the trendline resistance, it could trigger a move toward the 0.63200 supply zone.
Key Observations:
Probable Breakout: Price is testing the descending trendline resistance.
Higher Lows Formation: A sign of buyers gaining control.
Risk-to-Reward: The setup targets a 1:2 risk-to-reward ratio.
Lmk your opinions in the comments below🚀

AUD/USD Rejection at Key Resistance – Potential Downside Ahead?The AUD/USD pair has once again rejected a strong supply zone around 0.6300, signaling potential downside pressure. The recent bullish momentum was halted as the price entered a key resistance area, aligning with a bearish structure.
Key factors influencing this setup:
1️⃣ Resistance Rejection: Price faced rejection from the blue zone, confirming selling pressure.
2️⃣ USD Strength: The USD still has space to move towards the next resistance, showing short-term bullishness.
3️⃣ Fundamental Bias: AUD remains weak due to ongoing trade war fears with China.
If the price holds below the rejection zone, we could see a drop toward 0.6180 and beyond. Bears will be watching for further confirmation before entering aggressively.
📉 Bearish bias unless price reclaims resistance. What are your thoughts on this setup? Let me know in the comments! 🚀

AUDUSD MULTI TIME FRAME ANALYSISHello traders , here is the full multi time frame analysis for this pair, let me know in the comment section below if you have any questions , the entry will be taken only if all rules of the strategies will be satisfied. wait for more price action to develop before taking any position. I suggest you keep this pair on your watchlist and see if the rules of your strategy are satisfied.
🧠💡 Share your unique analysis, thoughts, and ideas in the comments section below. I'm excited to hear your perspective on this pair .
💭🔍 Don't hesitate to comment if you have any questions or queries regarding this analysis.

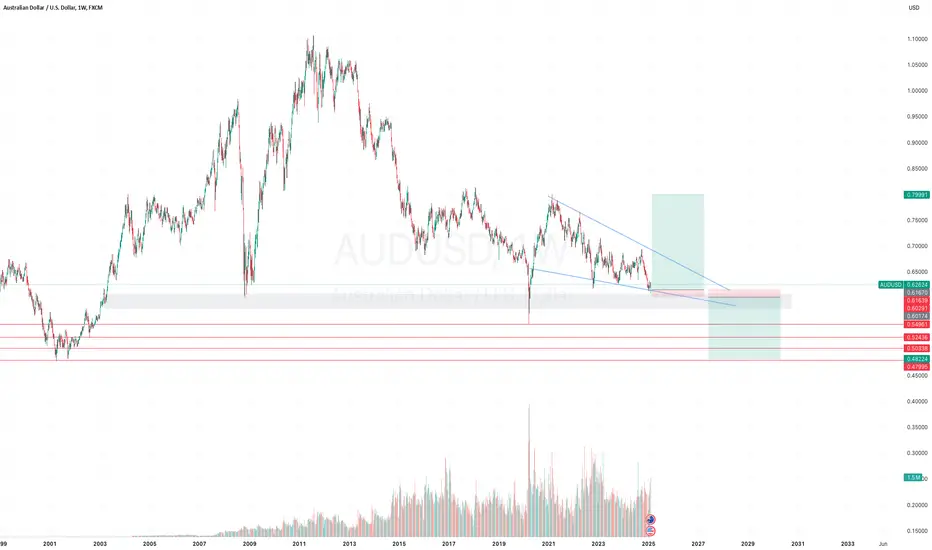
AUDUSD can move both side.AUDUSD current level should act as a support zone 0.62-0.58. If it breaks there will be massive downfall as per the pattern overview. 0.52 and 0.47 will be next stop. On contradiction there is also bullish wedge pattern forming which could also kill the sellers. One can easily try the big long with 2% SL & target above 10% 20%. If SL hit just reverse the position for bottom level liquidity targets. 0.54 0.52 0.47
LONG POSITION AUDUSDYou are indicating a long position build-up in AUD/USD with:
Entry: Likely near the current market price
Stop-Loss (SL): 0.62015
Target Price (TP): 0.63215
Risk-Reward Ratio (RRR): About 1:2 if entering near 0.6261
Key Considerations for This Trade:
Technical Levels: Check support at 0.6200 and resistance near 0.6320.
Fundamental Factors: Watch for RBA announcements, US Fed decisions, employment data, and inflation reports.
Market Sentiment: Look at risk-on/risk-off trends, especially in commodities and China-related news.
Dollar Strength: US economic data and Fed policy may impact USD demand.
Would you like a technical chart analysis or a fundamental update to support this trade idea? 🚀

LUCID TRAFFIC SIGNALThe "LUCID TRAFFIC SIGNAL" indicator is designed to provide a clear visual representation of market trends and potential price zones. By analyzing multiple timeframes, it highlights significant levels that can guide traders in identifying bullish, bearish, and neutral market conditions. The indicator uses color-coded lines to mark key price levels for different timeframes, helping traders make more informed decisions with ease.
This tool is ideal for those who want a straightforward, visually appealing way to monitor market dynamics and align their strategies with prevailing trends. Whether you're a day trader or a long-term investor, the "LUCID TRAFFIC SIGNAL" ensures you're equipped to navigate the markets confidently.

AUDUSD Short Setup at Bearish Order Block in 1H TFHello Traders!
Here's a simple but effective short setup idea for AUDUSD based on price action and market structure:
Key Insight:
AUDUSD is showing signs of bearish momentum as it approaches a bearish order block that aligns with a strong resistance zone. This makes it an ideal area to look for potential sell entries.
Setup Details:
Entry Zone: Place a short position near the bearish order block. Look for confirmation such as rejection wicks, bearish candlestick patterns, or momentum shifts on lower time frames before entering.
Target: The opposite side liquidity, where price is likely to seek equilibrium. This could be located near recent swing lows or a liquidity pool.
Stop Loss: Place it above the bearish order block to protect against invalidation of the setup.
Trade Plan:
Wait for price to tap into the bearish order block and monitor for signs of rejection before committing.
Manage your risk by calculating an appropriate lot size based on your risk management plan.
This setup offers a clear risk-to-reward structure, making it an appealing opportunity for those focusing on clean price action.
Let me know your thoughts on this setup and how you're approaching AUDUSD. Good luck, and trade safe!

AUDUSD SE;;📉 AUDUSD: Downtrend in Sight – Here’s What You Need to Know!
The AUDUSD pair is flashing bearish signals, pointing toward a potential slide. Here’s a deeper look into the key factors driving the market:
🔍 Key Drivers:
1️⃣ Australian Weakness:
Recent Australian economic data highlights slowing growth and subdued consumer sentiment.
The Reserve Bank of Australia’s cautious stance on rate hikes adds downward pressure on the Aussie dollar.
2️⃣ US Dollar Strength:
The USD continues to benefit from solid U.S. economic data, including strong labor market performance and robust retail sales.
Hawkish expectations from the Federal Reserve are keeping the greenback in demand.
3️⃣ Risk-Off Market Sentiment:
Global uncertainties (geopolitical tensions, economic slowdown fears) are fueling risk aversion.
Investors are flocking to the USD as a safe-haven asset, leaving the risk-sensitive AUD under pressure.
📊 Technical Insights:
Support Levels to Watch: AUDUSD is testing a critical support at . A break below this level could pave the way for further downside.
Resistance Zones: The pair faces strong resistance near , limiting potential upside corrections.
Indicators: Momentum oscillators and moving averages are aligning with bearish sentiment, signaling potential for further declines.
💡 Trading Strategy:
Consider short positions on a confirmed break below .
Set tight stop-losses and monitor key resistance areas for potential pullbacks.
Keep an eye on upcoming events, such as U.S. economic data and RBA announcements, which could influence market direction.
🔔 Stay Updated: Markets are volatile—timely insights are crucial. What’s your take on AUDUSD? Are you bullish or bearish? Let’s discuss in the comments! 👇

Bullish Idea on AUDUSDThe weekly timeframe chart of AUDUSD shows price reacting already at a key demand level; forming the basis of the bullish sentiment.
In order to confirm an imminent entry, one can plot a trendline of the two previous highs that yielded a bearish break, and await a sufficient bullish impulse that can break above the trendline as well as the previous low. This confirmation can be done on the 4-hour and 1-hour timeframe with SL below the weekly low, and TP at the highlighted supply on the H4.

LUCID TRAFFIC SIGNALThe "LUCID TRAFFIC SIGNAL" indicator is designed to provide a clear visual representation of market trends and potential price zones. By analyzing multiple timeframes, it highlights significant levels that can guide traders in identifying bullish, bearish, and neutral market conditions. The indicator uses color-coded lines to mark key price levels for different timeframes, helping traders make more informed decisions with ease.
This tool is ideal for those who want a straightforward, visually appealing way to monitor market dynamics and align their strategies with prevailing trends. Whether you're a day trader or a long-term investor, the "LUCID TRAFFIC SIGNAL" ensures you're equipped to navigate the markets confidently.

AUD/USD - Bullish Bounce Incoming?📈 AUD/USD - Bullish Bounce Incoming? 🚀
The pair has reached a critical demand zone (highlighted in purple) with a confluence of strong support and resistance levels. This aligns with our bullish view for a potential recovery.
🔍 Key Factors Supporting the Buy Setup:
1️⃣ Demand Zone: The price has sharply tested a key historical demand area (around 0.6225–0.6275), showing signs of buyers stepping in.
2️⃣ Support Confluence:
Strong horizontal support at 0.6225.
Demand-supply zone overlap further strengthens the level.
3️⃣ Oversold Conditions: The recent sell-off appears overextended, increasing the likelihood of a reversal.
🚀 Upside Targets:
First Target: 0.6604 (short-term resistance).
Second Target: 0.6681–0.6696 (key Fibonacci retracement level).
🚨 Risk Management:
Stop Loss: Below 0.6140 (below the demand zone to avoid false breakouts).
💡 Pro Tip: Monitor price action closely in this zone for confirmation of bullish momentum before entering.
🔔 Follow us for more actionable setups!

AUDUSD - SWING TRADE IDEA ON LONG SIDESymbol - AUDUSD
AUDUSD is currently trading at 0.6305
I'm seeing a trading opportunity on buy side.
Buying AUDUSD pair at CMP 0.6305
I will be adding more if 0.6270 - 0.6240 comes & will hold with SL 0.6215
Targets I'm expecting are 0.6360 - 0.6410 & 0.6450
Disclaimer - Do not consider this as a buy/sell recommendation. I'm sharing my analysis & my trading position. You can track it for educational purposes. Thanks!

Audusd Pullback It also means that should the US dollar continue to strengthen and the yuan weaken, AUD/USD runs the real risk of moving below 63c. The 10-day SMA is capping as resistance and makes a likely area for bears to reload, unless the Feed deliver a dovish surprise to send AUD/USD higher.

AUDUSD 15Min SetupAUDUSD - 15 Min Long
Reason -
- 4H Liquidity Sweep
- 15m Inducement
- 1 min OB+ FVG
- FIB 50 Retrace
- 40 degree inverse for sweep (you wont understand this , just take it)

AUDUSD_H4the normal divergence is positive and with the failure of the ending pattern of the celling and crossing the specified level can be entered into the purchase position

AUDUSD_1HAUDUSD_1H BEARISH
Everything is mentioned on Charts.
Please always look for double confirmation before entry.
Wish you Happy & safe Trading.
Trade as per your own RISK
Please Note:
My studies are for educational purpose only.
Please consult your financial advisor before Trading or Investing.
I'm not responsible for any kinds of your Profits & Losses.

Audusd - 1 hr bullish trend Audusd rally now - 1 hr timeframe
Buy now at 0.64000
Target 0.64600++
Good luck...!

Audusd - 1 hr bullish trend Audusd rally now - 1 hr timeframe
Buy now at 0.64000
Target 0.64600++
Good luck...!

AUD/USD Big trend shortwhen price move out sideway, this continue big trend short,
we continue short when prick pull back and appear signal sell on M15 and h1

AUDUSD_1HAUDUSD_1H BEARISH
Everything is mentioned on Charts.
Please always look for double confirmation before entry.
Wish you Happy & safe Trading.
Trade as per your own RISK
Please Note:
My studies are for educational purpose only.
Please consult your financial advisor before Trading or Investing.
I'm not responsible for any kinds of your Profits & Losses.

AUDUSD MULTI TIME FRAME ANALYSISHello traders , here is the full multi time frame analysis for this pair, let me know in the comment section below if you have any questions , the entry will be taken only if all rules of the strategies will be satisfied. wait for more price action to develop before taking any position. I suggest you keep this pair on your watchlist and see if the rules of your strategy are satisfied.
🧠💡 Share your unique analysis, thoughts, and ideas in the comments section below. I'm excited to hear your perspective on this pair .
💭🔍 Don't hesitate to comment if you have any questions or queries regarding this analysis.

AUDUSD SETUP FOR TODAYM15 is pure bullish till daily resistance at 0.65697.
As per SnR, i found daily strong level where price can reverse and continue with M15 bullish move.
As per SMC, Orderblock is found with FVG and also it's unmitigated. so it's high probability Order block.
So as per SnR and SMC, SnR POI is aligned with SMC POI.
Buy AUDUSD from that D1 and H4 price line or from directly from Orderblock.
Note : Risk must be max 1% of account balance.
