AUDUSD MULTI TIMEFRAME ANALYSIS AUDUSD remains bullish, even though we’re testing a premium area on the daily. Upside toward the weekly high of 10 Nov 2025 is still possible(PMH). Two scenarios for today:
(A) A setup inside the Asian range (B-grade idea).
(B) A deeper pullback toward ~0.65320, which is the higher-quality, A-plus discounted entry.
If price reaches either zone and I see a strong rejection + LTF structure shift, I’ll look for longs targeting the previous day’s high and the prior monthly high. A deeper correction is more likely, so Scenario A is my preferred setup.
setup quality B :⭐⭐⭐
setup quality A : ⭐⭐⭐⭐⭐
Trade ideas

AUDUSD MULTI TIMEFRAME ANALYSIS Hello traders , here is the full multi time frame analysis for this pair, let me know in the comment section below if you have any questions , the entry will be taken only if all rules of the strategies will be satisfied. wait for more price action to develop before taking any position. I suggest you keep this pair on your watchlist and see if the rules of your strategy are satisfied.


AUDUSD - SELLAUD/USD Sell Setup 🦘💵
📉 Primary Trade:
Sell @ 0.6502 — Previous day NY session high
Looking for rejection or liquidity grab around this level.
📉 Backup Trade:
Sell @ 0.6519 — Previous day London session high
Secondary zone if price breaks above NY high.

AUDUSD - BUYAUD/USD – Buy Setup 💹
📍 Reason:
1️⃣ Capwave signal on 1H
2️⃣ Session low formed – London session within LDN + NY range

AUD/USD Long Setup – Buying the Pullback with Clear RiskPair: AUD/USD
Entry: 0.65335
Stop Loss: 0.65275
Take Profit: 0.65535
Risk–Reward Ratio: ≈ 1:3.3
This isn’t a signal — it’s a guide for structure-based entries with tight risk control.
Always wait for price action confirmation before jumping in 🚀

Market ThinkingThe market had been under pressure, but now it’s starting to show some bullish momentum building up — higher lows are forming, and each dip is getting bought up a little faster.
The entry around 0.6544 could be the start of a fresh upward impulse if price continues to hold above that zone. I’ll be looking for signs of confirmation: maybe a strong bullish candle, or a breakout above minor resistance.
If buyers stay active and momentum builds, there’s room for price to climb toward the 0.6712 target zone, which also matches a previous swing high — an area where profit-taking might start to happen
Risk is clearly defined — if price breaks below 0.64969, it means buyers failed.
Reward potential — aiming for a move toward 0.67123 gives a healthy risk-to-reward ratio (roughly 1:3).
The goal isn’t to predict perfectly, but to react to what the market confirms.
It’s a patient setup — waiting for the market to prove strength before committing fully

AUDUSD BREAKS CHANNEL RESISTANCE - TREND SHIFT AHEAD?Symbol - AUDUSD
AUDUSD is undergoing a corrective phase after breaking above the resistance of the descending channel. The market now requires consolidation or the formation of a trading range above 0.6525 to sustain bullish momentum.
The US dollar remains in a consolidation phase and shows limited potential for further appreciation. Mounting pressure ahead of the upcoming Federal Reserve meeting may act as a supportive factor for the Australian dollar.
The pair is transitioning into a distribution phase following a period of consolidation. The breakout above 0.6525 confirmed a breach of the descending channel’s resistance, signaling the early stages of a potential trend reversal. Sustained price action above this level could pave the way for continued upside movement.
Resistance levels: 0.6567, 0.6610
Support levels: 0.6525, 0.6493
Currently, the pair is attempting to establish a shift in trend direction. The ongoing consolidation and distribution above the previously broken trendline are constructive signs. However, the formation of a defined trading range will be essential to confirm the establishment of a new local uptrend.

AUD/USD (3H)...AUD/USD (3H) chart, here’s a breakdown of what I see and how the target can be projected:
---
🧠 Pattern Analysis
My identified a Cup and Handle pattern, which is a bullish continuation setup.
Cup low: around 0.6450
Cup rim (resistance / breakout level): around 0.6580 – 0.6590
Current price: ~0.6585 (right around the breakout level)
Handle: short pullback, touching near Ichimoku cloud support — healthy structure before potential breakout.
---
🎯 Target Projection (Cup & Handle Rule)
Cup and Handle target = Breakout level + Depth of the cup
Depth of cup:
0.6585 (rim) – 0.6450 (bottom) = 0.0135
Target = 0.6585 + 0.0135 = 0.6720
---
✅ Target Summary
Entry (breakout confirmation): above 0.6590
Target: 0.6720
Stop-loss: below 0.6535 – 0.6540 (below handle & cloud support)
Risk/Reward ratio: ~1:2.5
---
💡 Bonus Confirmation
Price is above the Ichimoku Cloud (bullish bias).
Handle retracement is shallow and respecting Tenkan/Kijun lines — typical of strong continuation setups.
Volume on breakout (watch for increase) would add confirmation.
---
Final Target: 0.6720 (main take-profit zone)

AUD-USD is in Breakout Of Cup & Handle PatternIn 4 Hr Time Frame the AUD-USD has broken the Trendline and also the Cup & Handle breakout & Retest has already been Completed as per the Chart Pattern . The FVG will act as a major Support & it is in a strong Bull Trend as per the Chart .

Growth in Emerging MarketsIntroduction
Emerging markets are nations that are transitioning from developing to developed status, characterized by rapid industrialization, growing financial markets, and increasing integration into the global economy. These economies — such as India, China, Brazil, Indonesia, South Africa, and Mexico — have become the engines of global growth over the past three decades. They represent not only significant opportunities for investment and trade but also a vital source of innovation, labor, and consumption.
In the 21st century, emerging markets have been at the forefront of global economic transformation. Their collective share of global GDP has risen dramatically, fueled by urbanization, technology adoption, infrastructure development, and a growing middle class. Yet, these markets also face substantial challenges — including income inequality, political volatility, inflationary pressures, and vulnerability to external shocks. Understanding their growth dynamics is crucial for policymakers, investors, and global businesses seeking to capitalize on the shifting balance of economic power.
Defining Emerging Markets
An “emerging market” is typically defined as an economy that exhibits some characteristics of a developed market but has not yet achieved that status. These economies are often marked by:
Rapid GDP growth and industrialization
Expanding middle-class populations
Developing but volatile financial markets
Institutional and infrastructural transformation
Increasing participation in global trade and investment
Organizations such as MSCI, International Monetary Fund (IMF), and World Bank classify countries as emerging markets based on factors like per capita income, market accessibility, and financial development. Major emerging markets are often referred to collectively as BRICS (Brazil, Russia, India, China, South Africa) or MINT (Mexico, Indonesia, Nigeria, Turkey).
Historical Background
The term “emerging markets” was popularized in the early 1980s by the World Bank’s International Finance Corporation (IFC) to attract investors to rapidly developing countries. In the post-Cold War era, globalization and liberalization opened new opportunities for these nations to integrate into the global economy.
From 1990 to 2020, emerging markets experienced a profound transformation:
China’s economic reforms under Deng Xiaoping unleashed massive manufacturing growth.
India’s liberalization in 1991 opened its economy to foreign investment and competition.
Latin American economies, after periods of hyperinflation, adopted market-friendly reforms.
Eastern European countries transitioned from centrally planned to market economies after the fall of the Soviet Union.
During this period, emerging markets contributed more than two-thirds of global GDP growth, reshaping international trade, investment patterns, and geopolitical influence.
Key Drivers of Growth
1. Demographic Dividend
One of the strongest drivers of emerging market growth is their young and expanding population. Countries like India, Indonesia, and Nigeria possess large working-age populations, creating both a labor supply and a consumer base. This demographic advantage supports productivity, innovation, and domestic demand — essential elements for long-term growth.
2. Urbanization and Infrastructure Development
Urbanization is a hallmark of emerging markets. Rapid migration from rural to urban areas has fueled demand for housing, transport, energy, and digital infrastructure. Cities have become centers of economic activity, contributing to higher productivity and consumption. Governments and private investors are heavily investing in infrastructure projects such as metro systems, smart cities, ports, and renewable energy.
3. Technological Leapfrogging
Emerging markets have harnessed technology to overcome traditional development barriers. The widespread adoption of mobile banking, e-commerce, and digital services has revolutionized sectors like finance, retail, and healthcare. For instance, India’s UPI digital payment system, Kenya’s M-Pesa, and China’s Alipay and WeChat Pay have made financial inclusion a reality for millions.
Additionally, emerging economies are becoming innovation hubs, contributing to global technology supply chains. Startups in fintech, edtech, and agritech are leveraging local needs and global technologies to create scalable solutions.
4. Foreign Direct Investment (FDI) and Trade Integration
FDI has played a critical role in boosting industrialization, technology transfer, and job creation in emerging markets. Multinational corporations view these economies as growth frontiers due to their large markets and lower labor costs. The signing of regional trade agreements — such as RCEP (Regional Comprehensive Economic Partnership) in Asia — has further deepened trade integration.
Emerging markets are also major players in global supply chains, especially in manufacturing, natural resources, and services. China became the “world’s factory,” while India emerged as a global IT and service hub.
5. Rising Middle Class and Consumption
The growth of the middle class has transformed emerging markets into major consumer economies. Rising incomes, better education, and urban lifestyles have driven demand for goods and services ranging from smartphones to automobiles. According to McKinsey, emerging markets will account for more than 50% of global consumption by 2030, making them pivotal for multinational corporations.
6. Policy Reforms and Economic Liberalization
Most emerging economies have undertaken structural reforms — privatization, deregulation, and financial liberalization — to attract investment and enhance competitiveness. Independent central banks, modern taxation systems, and digital governance have strengthened institutional frameworks and improved macroeconomic stability.
Challenges Facing Emerging Markets
While emerging markets have immense potential, their growth trajectories are not without obstacles.
1. Political and Institutional Instability
Weak governance, corruption, and policy inconsistency remain major barriers. Political instability can deter investors and slow reform implementation. For instance, frequent changes in government policies or bureaucratic inefficiencies can create uncertainty for long-term investments.
2. Income Inequality and Social Disparities
Economic growth has not always translated into inclusive prosperity. Many emerging economies face widening income gaps between urban and rural populations. Unequal access to education, healthcare, and digital resources hinders human capital development and social mobility.
3. Dependence on Commodities
Several emerging markets — particularly in Africa and Latin America — rely heavily on commodity exports such as oil, copper, and agricultural products. This makes them vulnerable to price volatility and global demand shifts. Diversification remains a persistent challenge.
4. External Shocks and Currency Volatility
Emerging markets are highly sensitive to global financial conditions. Fluctuations in U.S. interest rates, trade tensions, and geopolitical risks can trigger capital outflows, currency depreciation, and inflation. Episodes like the 2013 “taper tantrum” and the COVID-19 pandemic exposed the fragility of their financial systems.
5. Debt and Fiscal Pressure
Rising public debt, especially after the pandemic, has strained government budgets. Many countries have borrowed heavily to finance infrastructure and welfare programs, increasing vulnerability to credit downgrades and default risks.
6. Environmental and Sustainability Issues
Rapid industrialization has come at an environmental cost. Pollution, deforestation, and climate change pose existential threats to long-term development. Transitioning to green energy and sustainable industries is now essential but financially challenging.
Case Studies: Leading Emerging Markets
1. China
China is the quintessential emerging market success story. Through export-led growth, massive infrastructure investment, and state-directed capitalism, it became the world’s second-largest economy. However, China now faces slowing growth, demographic decline, and geopolitical pressures. The government’s push for technological self-reliance and green transition marks the next phase of its development.
2. India
India’s growth has been fueled by services, technology, and digital innovation. With a young population and expanding middle class, it is projected to become the world’s third-largest economy by 2030. Initiatives like “Make in India,” “Digital India,” and “Startup India” aim to boost manufacturing, innovation, and entrepreneurship.
3. Brazil
Brazil’s economy is driven by natural resources and agriculture but often hampered by political volatility and inflation. Recent efforts to promote renewable energy, fintech, and agritech indicate potential for sustainable diversification.
4. Indonesia and Vietnam
Southeast Asian economies like Indonesia and Vietnam have benefited from global supply chain shifts. Their competitive labor markets, stable governance, and reform-oriented policies make them attractive destinations for manufacturing and FDI.
5. African Emerging Economies
Africa, with its abundant resources and youthful population, represents the next frontier. Countries like Nigeria, Kenya, and South Africa are witnessing rapid digitalization and entrepreneurship. However, infrastructure gaps and governance challenges persist.
Future Outlook
1. Digital Transformation
The future of emerging markets will be shaped by digital infrastructure — 5G, AI, and fintech will drive innovation across industries. Governments and private sectors are investing in digital literacy, e-governance, and data economies to enhance competitiveness.
2. Green Growth and Sustainability
Sustainability is becoming central to policy agendas. The shift toward renewable energy, electric vehicles, and sustainable agriculture offers both challenges and new growth avenues. International financing for green projects will be key to achieving low-carbon transitions.
3. Regional Integration and South-South Cooperation
Emerging markets are increasingly trading and investing among themselves. Initiatives like BRICS cooperation, African Continental Free Trade Area (AfCFTA), and ASEAN integration are strengthening economic ties and reducing dependency on developed economies.
4. Innovation and Entrepreneurship
The entrepreneurial ecosystem in emerging markets is booming. Startups in fintech, healthtech, and edtech are solving local problems with global scalability. This innovation wave can help create high-value jobs and promote inclusive growth.
5. Balancing Growth with Inclusion
To sustain growth, emerging markets must prioritize education, healthcare, and social equity. Policies that enhance skills, reduce poverty, and support SMEs will be crucial for ensuring broad-based prosperity.
Conclusion
Emerging markets have transformed the global economic landscape. They have become the new centers of growth, innovation, and consumption. While challenges such as inequality, governance, and volatility persist, their potential remains enormous. With continued reforms, digital adoption, and sustainable policies, emerging markets are poised to lead the next wave of global progress.
As the balance of economic power shifts eastward and southward, the future of global growth will increasingly be written in the cities of Asia, Africa, and Latin America — where ambition, technology, and resilience are redefining what it means to “emerge.”


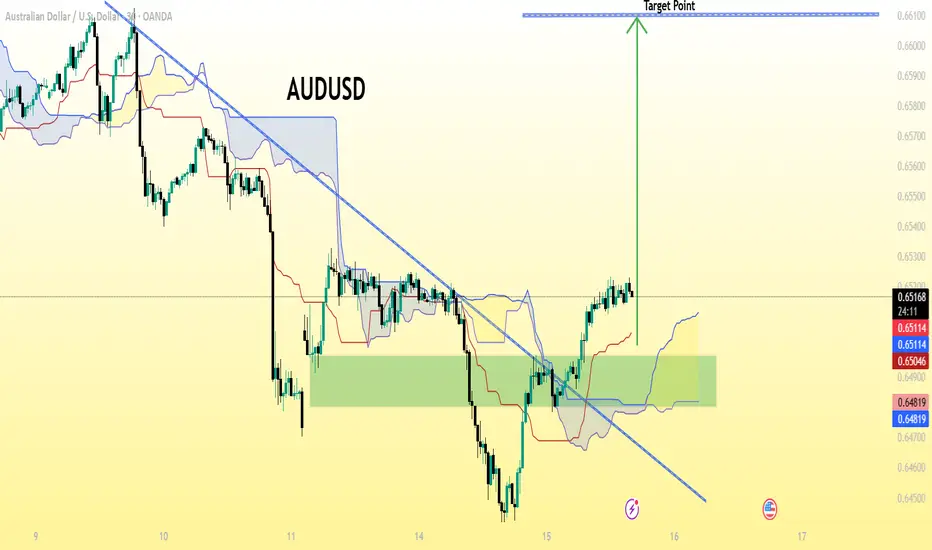
AUD/USD on a 30-minute timeframe (based on the visible labels)..AUD/USD on a 30-minute timeframe (based on the visible labels). Let’s break it down carefully:
The pair AUD/USD is currently trading around 0.6518.
The chart shows a bullish breakout above a descending trendline.
The green zone marked looks like a demand/support zone.
A target line is already drawn near the top of the chart, labeled “Target Point”.
🔍 Based on the chart:
The “Target Point” appears to be at approximately 0.6600 – 0.6605 level.
🧭 Summary:
Type Level
Entry Zone Around 0.6500–0.6520
Target (TP) 0.6600 – 0.6605
Stop Loss (SL) Likely below the green zone, around 0.6480
💡 Interpretation:
This setup seems to be a breakout + retest trade idea where the expectation is that AUD/USD will move upward about 80–100 pips toward the 0.6600 target area.
AUDUSD 15M IDEAFOREXCOM:AUDUSD
Hello traders , here is the full multi time frame analysis for this pair, let me know in the comment section below if you have any questions, the entry will be taken only if all rules of the strategies will be satisfied. wait for more Smart Money to develop before taking any position . I suggest you keep this pair on your watchlist and see if the rules of your strategy are satisfied...
Keep trading
Hustle hard
Markets can be Unpredictable, research before trading.
Disclaimer: This trade idea is based on Smart money concept and is for informational purposes only. Trading involves risks; seek professional advice before making any financial decisions. Informational only!!!

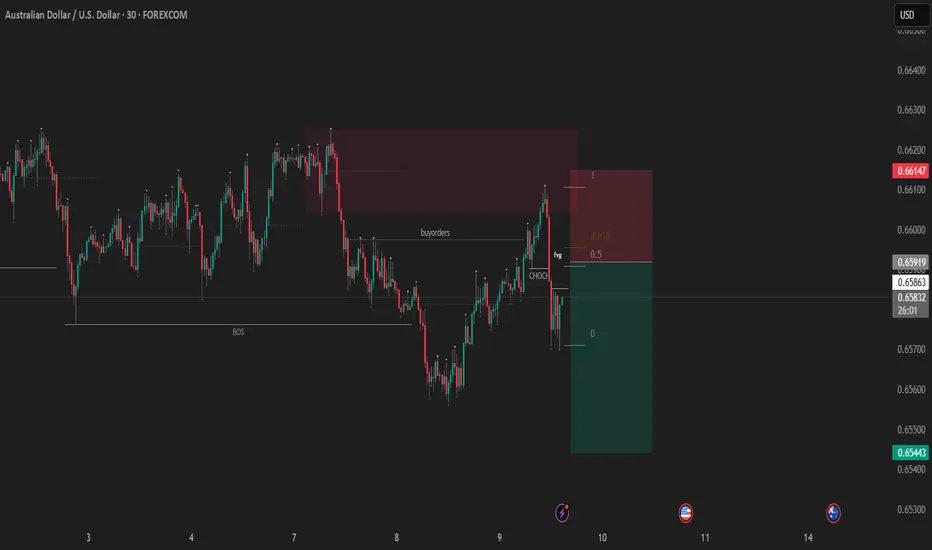
Result of the last trade idea which i published few hours agoAUD/USD short idea played out perfectly.
Price reacted from the marked supply zone during London session, aligned with strong USD fundamentals and weak AUD sentiment.
Trade respected structure, mitigated FVG, and reached the target cleanly.
Simple liquidity-based execution — patience paid off. 💪📉
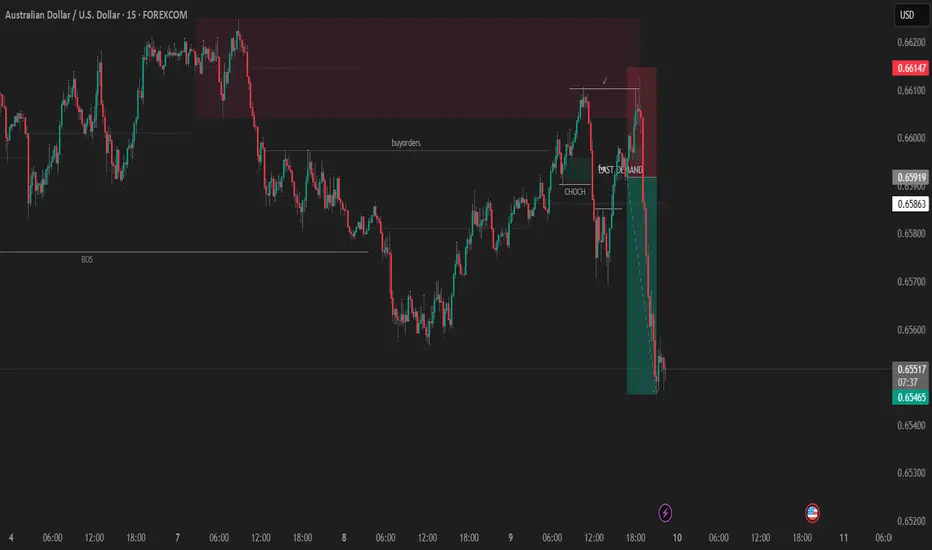
look for a short in AUDUSD, after price gave a structure shift price retraced to premium of recent break of structure(downside), from there price cleared out some buyside liquidity and gave a structure shift in lowertime frames therefore i placed a pending short limit order, at the premium of new lower time frame structure.
AUDUSD | Intraday Long Setup – Smart Money StoryThe market has been in a strong bearish trend recently, pushing AUDUSD to test a major demand zone on the lower time frame. After a continuous drop from the premium zone (highlighted in red), price has finally tapped into the green zone of interest — a potential liquidity pool and demand base.
Here’s my thought process behind this setup 👇
After observing the 15-minute chart, I noticed that price swept the previous lows, collecting liquidity below 0.6550. Immediately after the sweep, there was a clear rejection wick showing buyers stepping in with strength. This area aligns perfectly with a 4H demand imbalance zone, suggesting a possible short-term bullish retracement.
I entered my long position at 0.6556, keeping my stop-loss just below the recent low (0.6535) to protect capital in case of further downside manipulation. My first target is placed around 0.6605 — a minor resistance and internal range high — and my second target is near the 4H supply zone at 0.6624 (highlighted in red), where I expect smart money to start taking profits.
This setup is based on:
Liquidity sweep confirmation
Demand zone confluence
Bullish rejection candle
Favorable risk-to-reward structure
I’m looking for a short-term bullish push during the intraday session. If the price breaks below 0.6530 with momentum, the setup will be invalidated and I’ll look for new opportunities.
📊 Bias: Bullish (Intraday)
⏱️ Timeframe: M15
🎯 TP1: 0.6605
🎯 TP2: 0.6624
❌ SL: 0.6535
Remember — trading is all about timing, patience, and risk management. Let’s see how price reacts to this beautiful demand area today!

AUDUSD MULTI TIME FRAME ANALYSISHello traders , here is the full multi time frame analysis for this stock , let me know in the comment section below if you have any questions , the position will be taken only if all rules of the strategies will be satisfied. wait for more price action to develop before taking any position. I suggest you keep this pair on your watchlist and see if the rules of your strategy are satisfied.
🧠💡 Share your unique analysis, thoughts, and ideas in the comments section below. I'm excited to hear your perspective on this pair .
💭🔍 Don't hesitate to comment if you have any questions or queries regarding this analysis.

AUDUSD – Bearish Setup (H2 Chart)📊 AUDUSD – Bearish Setup (H2 Chart)
Pair: AUDUSD
Timeframe: 2H
Bias: Short Position
🔎 Market Context:
Price has been showing signs of weakness after a strong move up.
A resistance zone (0.66159 – 0.66328) has been identified where sellers may re-enter.
Market structure suggests a possible downside continuation if price rejects from this area.
📌 Trade Plan:
Entry Zone: 0.66159 – 0.66328
Stop Loss (SL): Above 0.66328
Take Profit (TP): 0.65651 (previous low / liquidity zone)
⚖️ Risk-Reward (RR):
Approx 1:3, fitting well into the weekly plan.
📅 Setup valid for Oct 6 – Oct 10, 2025
⚠️ Disclaimer: This chart is for educational purposes only. Not financial advice. Always manage your own risk properly before trading.


AUDUSD Buy Setup - Breakout & RetestAUDUSD is showing strength after bouncing from a daily order block and aligning perfectly with the 0.79 Fibonacci discount zone. The higher timeframe context is setting the stage for a clean upside move, but we need confirmations before execution.
🔑 Key Levels to Watch
Entry Trigger: A 4H candle close above 0.66050 will confirm the breakout of the supply zone and trendline.
Buy Plan: Enter on the retest of the broken supply/trendline zone.
Structure: 4H fractal structure shifting bullish, supported by daily OB.
🎯 Why This Matters
This is not a random bounce—price is reacting from confluence of Daily OB + Fib 0.79 + Supply Breakout. Once the 0.66050 zone flips, the path of least resistance opens toward higher liquidity pools.
📝 Trading Plan
✅ Wait for confirmation breakout (4H close above supply)
✅ Execute buy entries on retest
✅ Manage risk with stops below last swing structure
This setup rewards patience: let the breakout confirm, then catch the move with precision.
#AUDUSD #Forex #PriceAction #TradingView

AUDUSD(20250912)Today's AnalysisMarket News:
U.S. initial jobless claims surged to 263,000 in the week ending September 6, reaching a near four-year high. Traders are fully pricing in three Federal Reserve interest rate cuts by the end of 2025.
Technical Analysis:
Today's Buy/Sell Levels:
0.6636
Support and Resistance Levels:
0.6712
0.6683
0.6665
0.6607
0.6588
0.6560
Trading Strategy:
If the price breaks above 0.6665, consider a buy entry, with the first target at 0.6683.
If the price breaks below 0.6636, consider a sell entry, with the first target at 0.6607.

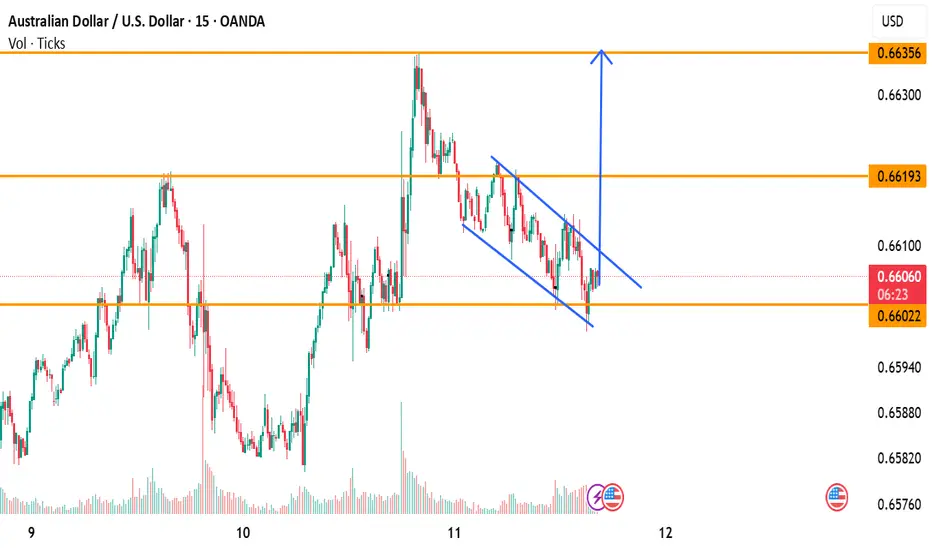
Bullish Channel Breakout Setup (15M)Price action on the 15M chart is showing a well-defined falling channel. The pair recently bounced from the lower channel support, indicating that buyers are stepping in around this area.
📌 Key Observations:
Price is respecting the channel pattern.
Breakout attempt above the channel is visible.
Support zone holding near 0.6602.
Next resistance levels to watch: 0.6619 and 0.6635.