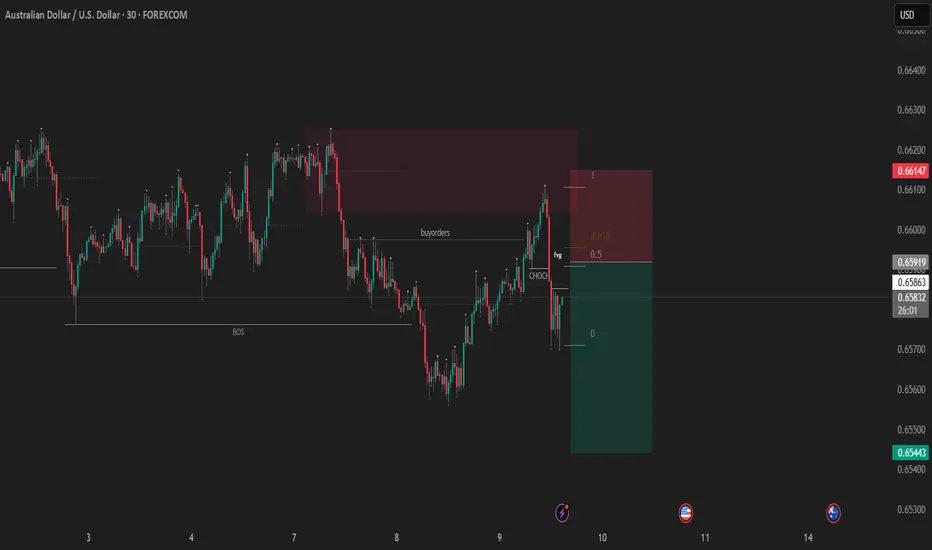
look for a short in AUDUSD, after price gave a structure shift price retraced to premium of recent break of structure(downside), from there price cleared out some buyside liquidity and gave a structure shift in lowertime frames therefore i placed a pending short limit order, at the premium of new lower time frame structure.
Trade ideas
Result of the last trade idea which i published few hours agoAUD/USD short idea played out perfectly.
Price reacted from the marked supply zone during London session, aligned with strong USD fundamentals and weak AUD sentiment.
Trade respected structure, mitigated FVG, and reached the target cleanly.
Simple liquidity-based execution — patience paid off. 💪📉
AUDUSD MULTI TIME FRAME ANALYSISHello traders , here is the full multi time frame analysis for this stock , let me know in the comment section below if you have any questions , the position will be taken only if all rules of the strategies will be satisfied. wait for more price action to develop before taking any position. I suggest you keep this pair on your watchlist and see if the rules of your strategy are satisfied.
🧠💡 Share your unique analysis, thoughts, and ideas in the comments section below. I'm excited to hear your perspective on this pair .
💭🔍 Don't hesitate to comment if you have any questions or queries regarding this analysis.

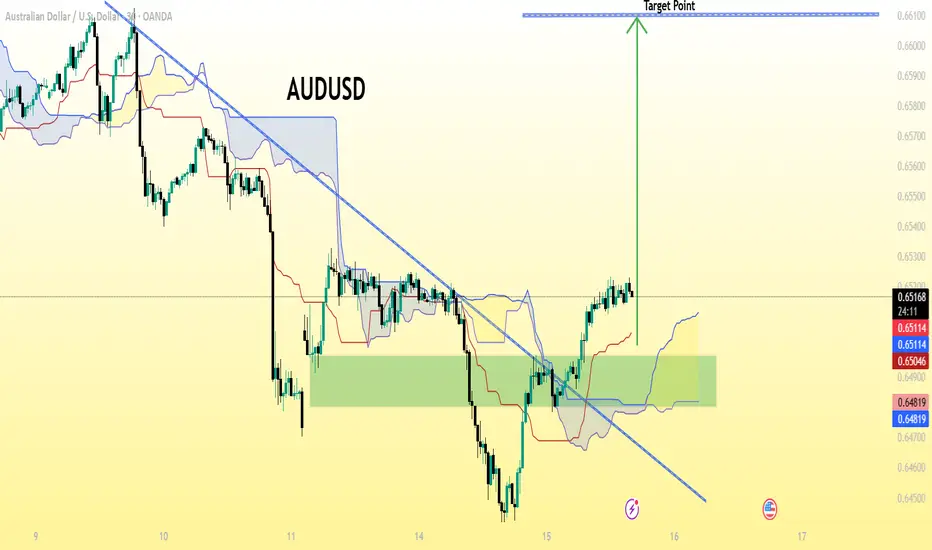
AUD/USD on a 30-minute timeframe (based on the visible labels)..AUD/USD on a 30-minute timeframe (based on the visible labels). Let’s break it down carefully:
The pair AUD/USD is currently trading around 0.6518.
The chart shows a bullish breakout above a descending trendline.
The green zone marked looks like a demand/support zone.
A target line is already drawn near the top of the chart, labeled “Target Point”.
🔍 Based on the chart:
The “Target Point” appears to be at approximately 0.6600 – 0.6605 level.
🧭 Summary:
Type Level
Entry Zone Around 0.6500–0.6520
Target (TP) 0.6600 – 0.6605
Stop Loss (SL) Likely below the green zone, around 0.6480
💡 Interpretation:
This setup seems to be a breakout + retest trade idea where the expectation is that AUD/USD will move upward about 80–100 pips toward the 0.6600 target area.
AUDUSD 15M IDEAFOREXCOM:AUDUSD
Hello traders , here is the full multi time frame analysis for this pair, let me know in the comment section below if you have any questions, the entry will be taken only if all rules of the strategies will be satisfied. wait for more Smart Money to develop before taking any position . I suggest you keep this pair on your watchlist and see if the rules of your strategy are satisfied...
Keep trading
Hustle hard
Markets can be Unpredictable, research before trading.
Disclaimer: This trade idea is based on Smart money concept and is for informational purposes only. Trading involves risks; seek professional advice before making any financial decisions. Informational only!!!

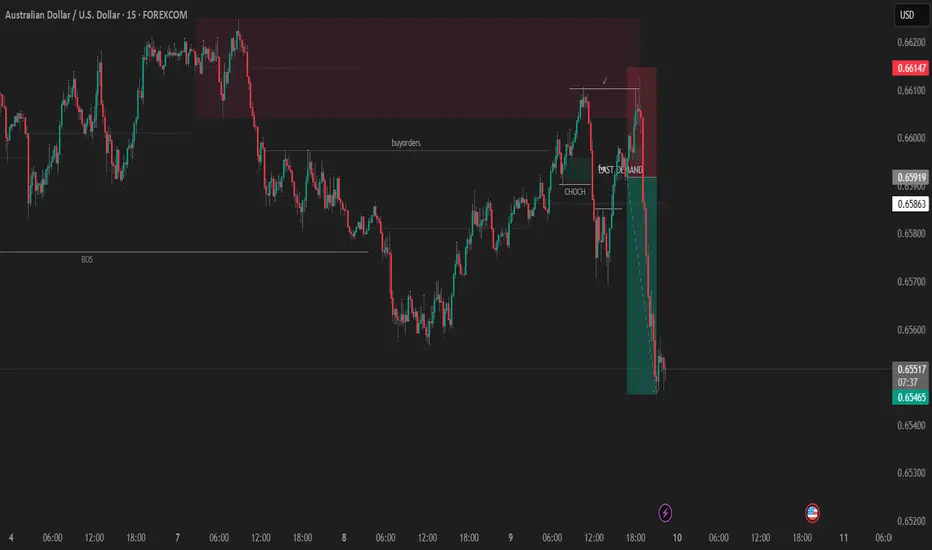
AUDUSD | Intraday Long Setup – Smart Money StoryThe market has been in a strong bearish trend recently, pushing AUDUSD to test a major demand zone on the lower time frame. After a continuous drop from the premium zone (highlighted in red), price has finally tapped into the green zone of interest — a potential liquidity pool and demand base.
Here’s my thought process behind this setup 👇
After observing the 15-minute chart, I noticed that price swept the previous lows, collecting liquidity below 0.6550. Immediately after the sweep, there was a clear rejection wick showing buyers stepping in with strength. This area aligns perfectly with a 4H demand imbalance zone, suggesting a possible short-term bullish retracement.
I entered my long position at 0.6556, keeping my stop-loss just below the recent low (0.6535) to protect capital in case of further downside manipulation. My first target is placed around 0.6605 — a minor resistance and internal range high — and my second target is near the 4H supply zone at 0.6624 (highlighted in red), where I expect smart money to start taking profits.
This setup is based on:
Liquidity sweep confirmation
Demand zone confluence
Bullish rejection candle
Favorable risk-to-reward structure
I’m looking for a short-term bullish push during the intraday session. If the price breaks below 0.6530 with momentum, the setup will be invalidated and I’ll look for new opportunities.
📊 Bias: Bullish (Intraday)
⏱️ Timeframe: M15
🎯 TP1: 0.6605
🎯 TP2: 0.6624
❌ SL: 0.6535
Remember — trading is all about timing, patience, and risk management. Let’s see how price reacts to this beautiful demand area today!

AUDUSD – Bearish Setup (H2 Chart)📊 AUDUSD – Bearish Setup (H2 Chart)
Pair: AUDUSD
Timeframe: 2H
Bias: Short Position
🔎 Market Context:
Price has been showing signs of weakness after a strong move up.
A resistance zone (0.66159 – 0.66328) has been identified where sellers may re-enter.
Market structure suggests a possible downside continuation if price rejects from this area.
📌 Trade Plan:
Entry Zone: 0.66159 – 0.66328
Stop Loss (SL): Above 0.66328
Take Profit (TP): 0.65651 (previous low / liquidity zone)
⚖️ Risk-Reward (RR):
Approx 1:3, fitting well into the weekly plan.
📅 Setup valid for Oct 6 – Oct 10, 2025
⚠️ Disclaimer: This chart is for educational purposes only. Not financial advice. Always manage your own risk properly before trading.


AUDUSD Buy Setup - Breakout & RetestAUDUSD is showing strength after bouncing from a daily order block and aligning perfectly with the 0.79 Fibonacci discount zone. The higher timeframe context is setting the stage for a clean upside move, but we need confirmations before execution.
🔑 Key Levels to Watch
Entry Trigger: A 4H candle close above 0.66050 will confirm the breakout of the supply zone and trendline.
Buy Plan: Enter on the retest of the broken supply/trendline zone.
Structure: 4H fractal structure shifting bullish, supported by daily OB.
🎯 Why This Matters
This is not a random bounce—price is reacting from confluence of Daily OB + Fib 0.79 + Supply Breakout. Once the 0.66050 zone flips, the path of least resistance opens toward higher liquidity pools.
📝 Trading Plan
✅ Wait for confirmation breakout (4H close above supply)
✅ Execute buy entries on retest
✅ Manage risk with stops below last swing structure
This setup rewards patience: let the breakout confirm, then catch the move with precision.
#AUDUSD #Forex #PriceAction #TradingView

AUDUSD(20250912)Today's AnalysisMarket News:
U.S. initial jobless claims surged to 263,000 in the week ending September 6, reaching a near four-year high. Traders are fully pricing in three Federal Reserve interest rate cuts by the end of 2025.
Technical Analysis:
Today's Buy/Sell Levels:
0.6636
Support and Resistance Levels:
0.6712
0.6683
0.6665
0.6607
0.6588
0.6560
Trading Strategy:
If the price breaks above 0.6665, consider a buy entry, with the first target at 0.6683.
If the price breaks below 0.6636, consider a sell entry, with the first target at 0.6607.

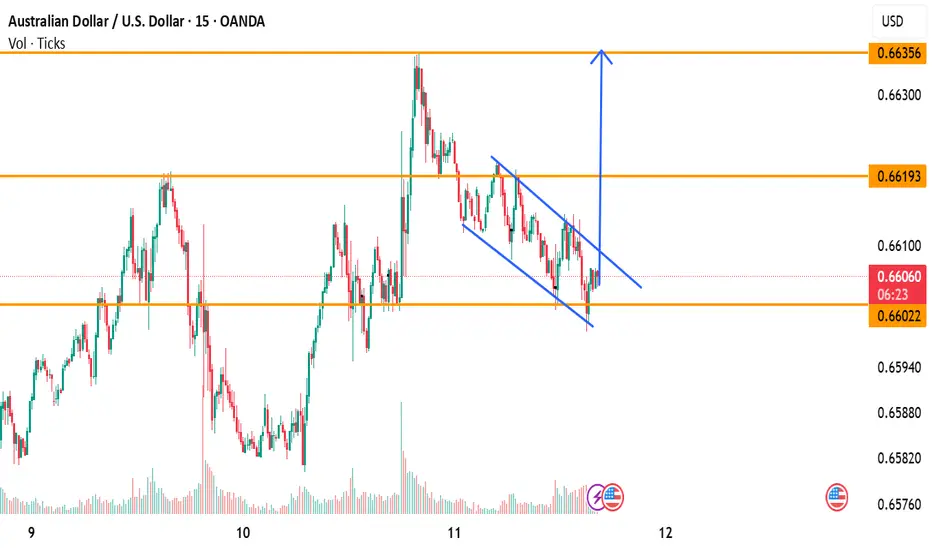
Bullish Channel Breakout Setup (15M)Price action on the 15M chart is showing a well-defined falling channel. The pair recently bounced from the lower channel support, indicating that buyers are stepping in around this area.
📌 Key Observations:
Price is respecting the channel pattern.
Breakout attempt above the channel is visible.
Support zone holding near 0.6602.
Next resistance levels to watch: 0.6619 and 0.6635.
AUDUSD(20250911)Today's AnalysisMarket News:
The U.S. PPI annual rate for August hit 2.6%, the lowest since June. Traders are increasing bets on a Fed rate cut.
Technical Analysis:
Today's bull/bear range:
0.6608
Support and resistance levels:
0.6664
0.6643
0.6629
0.6587
0.6573
0.6553
Trading Strategy:
If the price breaks above 0.6629, consider buying, with the first target at 0.6643.
If the price breaks below 0.6608, consider selling, with the first target at 0.6587

AUDUSD BullishSimple trendline on 2 hour chart, it's going to break, as per fundamentals as well AUD is going to outperform USD

AUDUSD(20250908)Today's AnalysisMarket News:
Non-farm payroll growth fell significantly short of expectations, with June's data revised downward to negative territory, marking the first contraction since 2020. The unemployment rate hit a nearly four-year high.
Technical Analysis:
Today's buy/sell levels:
0.6548
Support and resistance levels:
0.6633
0.6601
0.6580
0.6515
0.6494
0.6463
Trading Strategy:
On a breakout above 0.6580, consider a buy entry, with the first target at 0.6601.
On a breakout above 0.6548, consider a sell entry, with the first target at 0.6515

AUDUSD-ShortAUD/USD 15m Chart Update
1️⃣ HTF Resistance
Price has reached a higher-timeframe resistance zone.
This is an important supply area where sellers may step in.
2️⃣ Bearish Order Block (OB)
A bearish order block is formed just below the resistance.
Price tapped into this OB and showed rejection with red candles.
3️⃣ Volume Analysis
The recent upmove happened with less volumes, showing weak buyer interest.
Sellers gaining strength near resistance is a bearish signal.
Market showing signs of rejection from resistance + bearish OB.
Unless strong buying volume comes in, we may see further downside pressure.
🔹 Entry Zone: Around the Bearish Order Block (0.6548 – 0.6555)
🔹 Stop Loss: Above HTF Resistance (0.6560)
🔹 Target 1: 0.6530
🔹 Target 2: 0.6515 (extended target if momentum continues)
Reasoning: Price rejected from HTF Resistance. Bearish OB showing supply zone. Weak volumes in the upmove = less buyer strength.
Plan: Wait for pullback to OB zone → Short entry → Trail stop once Target 1 is achieved.

AUDUSD(20250904)Today's AnalysisMarket News:
① Waller: I believe we should cut interest rates at the next meeting. Multiple rate cuts are possible in the future, but the exact pace depends on the data.
② Musallem: Current interest rates are appropriate, but there are risks in the job market.
③ Bostic: Concerned about inflation, I still believe one rate cut this year is appropriate.
④ The Federal Reserve will hold a payments innovation conference on October 21st, which will discuss stablecoins, artificial intelligence, and tokenization.
⑤ Fed Governor nominee Milan: If confirmed, I will maintain the independence of the FOMC.
⑥ Kashkari: There is room for a modest rate cut.
⑦ The Federal Reserve Beige Book: Economic activity is roughly flat, with businesses and households feeling the impact of tariffs.
Technical Analysis:
Today's Buy/Sell Levels:
0.6532
Support and Resistance Levels:
0.6584
0.6564
0.6552
0.6512
0.6499
0.6480
Trading Strategy:
If the price breaks above 0.6552, consider entering a buy position, with the first target price at 0.6564.
If the price breaks below 0.6532, consider entering a sell position, with the first target price at 0.6512


AUDUSD MULTI TIME FRAME ANALYSISHello traders , here is the full multi time frame analysis for this pair, let me know in the comment section below if you have any questions , the entry will be taken only if all rules of the strategies will be satisfied. wait for more price action to develop before taking any position. I suggest you keep this pair on your watchlist and see if the rules of your strategy are satisfied.
🧠💡 Share your unique analysis, thoughts, and ideas in the comments section below. I'm excited to hear your perspective on this pair .
💭🔍 Don't hesitate to comment if you have any questions or queries regarding this analysis.

AUD/USD Sell Setup – Liquidity Grab + Fractal Structure Shift 📉 Pair: AUD/USD
📆 Timeframes: Daily + 4H
🎯 Strategy: Smart Money Concept (SMC)
🔹 Bigger Picture (Daily Timeframe)
The daily trend for AUD/USD remains bearish, with consistent lower highs and lower lows.
Price action confirms that sellers still control the market, and buyers are only creating short-term pullbacks for liquidity grabs.
🔹 4H Timeframe Setup
On the 4-hour chart, AUD/USD has made a clear liquidity grab around the 0.65900 zone (yellow highlighted area).
After sweeping liquidity, the market shifted fractal structure to the downside, aligning perfectly with the overall daily bearish bias.
This creates a high-probability short setup.
🔹 Trade Plan
Sell Entry: 0.64825
Stop Loss: 0.65090
Risk/Reward: Attractive based on bearish continuation
30% Quantity sell in Market Rest sell on Retest
🔹 Why This Setup Works
Daily bearish structure → Trend aligned.
Liquidity grab on 4H → Smart money manipulation before reversal.
Fractal structure break → Market confirming downside shift.
Confluence with SMC concepts → Strong institutional pattern.
⚠️ Risk Factor
The only risk in this setup is that the market has already broken the fractal structure, leaving liquidity untested around 0.65870 (triple top).
If price retraces back to test this liquidity, short-term stop hunts may occur before the drop.
🔹 Final Outlook
All major SMC elements align for a bearish continuation on AUD/USD.
If price respects the fractal shift and liquidity grab, we could see a clean move to the downside from 0.64825, offering a solid risk-to-reward opportunity for swing and intraday traders.

audusd short AUD/USD Chart Patterns: What to Know
1. Head and Shoulders (Reversal Pattern)
Seen clearly on the 4-hour chart illustration above.
A break below the neckline—notably around the 0.6600 level—could confirm a reversal, potentially moving the pair downward by approximately 150 pips .
Also identified in broader technical commentary, indicating weakening bull momentum in AUD/USD
2. Wedge Patterns (Continuation or Reversal)
On a 4-hour timeframe, AUD/USD appears to be forming an opening wedge—a narrowing trend that may precede a breakout.
If price breaks support, expect downward movement; a push higher on strong momentum may signal an upward breakout .

AUD/USD ROAD-MAP Sniper AUD/USD Entry Based on Wave Count 📉
Institutional Pattern | Liquidity Trap | Wave 3 Setup Confirmed ✅
Watch how price reacts at key levels. This is a high-probability sniper trade idea. Follow the sequence like a pro.
#Forex #AUDUSD #SniperTrading #WaveAnalysis #ElliottWave #ForexTrader #SmartMoney #LiquidityGrab #Wave3 #forexsetup #SniperWave #priceaction #forexshorts #AUDUSDsetup

AUD/USD Elliott Wave BreakdownPrice rejected beautifully near the end of Wave 2 — is Wave 3 underway?No indicators. Just pure Elliott Wave + Price Action sniper logic.
How to turns $200 to $10k Join my channel
#AUDUSD #ElliottWave #ForexTrading #WaveAnalysis #SniperEntry #PriceActionTrading #Wave3Loading #FxSniper #RamkiStyle #ChartAnalysis #ForexShorts #TradingMindset #SupplyZone #WaveCount #SniperWave
