AUDUSD BullishSimple trendline on 2 hour chart, it's going to break, as per fundamentals as well AUD is going to outperform USD
Trade ideas

AUDUSD(20250908)Today's AnalysisMarket News:
Non-farm payroll growth fell significantly short of expectations, with June's data revised downward to negative territory, marking the first contraction since 2020. The unemployment rate hit a nearly four-year high.
Technical Analysis:
Today's buy/sell levels:
0.6548
Support and resistance levels:
0.6633
0.6601
0.6580
0.6515
0.6494
0.6463
Trading Strategy:
On a breakout above 0.6580, consider a buy entry, with the first target at 0.6601.
On a breakout above 0.6548, consider a sell entry, with the first target at 0.6515

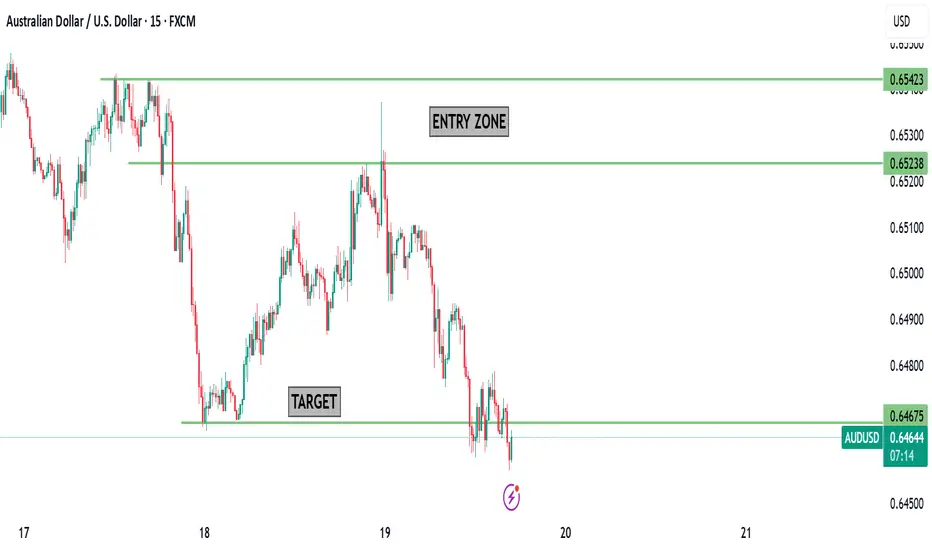
AUDUSD-ShortAUD/USD 15m Chart Update
1️⃣ HTF Resistance
Price has reached a higher-timeframe resistance zone.
This is an important supply area where sellers may step in.
2️⃣ Bearish Order Block (OB)
A bearish order block is formed just below the resistance.
Price tapped into this OB and showed rejection with red candles.
3️⃣ Volume Analysis
The recent upmove happened with less volumes, showing weak buyer interest.
Sellers gaining strength near resistance is a bearish signal.
Market showing signs of rejection from resistance + bearish OB.
Unless strong buying volume comes in, we may see further downside pressure.
🔹 Entry Zone: Around the Bearish Order Block (0.6548 – 0.6555)
🔹 Stop Loss: Above HTF Resistance (0.6560)
🔹 Target 1: 0.6530
🔹 Target 2: 0.6515 (extended target if momentum continues)
Reasoning: Price rejected from HTF Resistance. Bearish OB showing supply zone. Weak volumes in the upmove = less buyer strength.
Plan: Wait for pullback to OB zone → Short entry → Trail stop once Target 1 is achieved.

AUDUSD(20250904)Today's AnalysisMarket News:
① Waller: I believe we should cut interest rates at the next meeting. Multiple rate cuts are possible in the future, but the exact pace depends on the data.
② Musallem: Current interest rates are appropriate, but there are risks in the job market.
③ Bostic: Concerned about inflation, I still believe one rate cut this year is appropriate.
④ The Federal Reserve will hold a payments innovation conference on October 21st, which will discuss stablecoins, artificial intelligence, and tokenization.
⑤ Fed Governor nominee Milan: If confirmed, I will maintain the independence of the FOMC.
⑥ Kashkari: There is room for a modest rate cut.
⑦ The Federal Reserve Beige Book: Economic activity is roughly flat, with businesses and households feeling the impact of tariffs.
Technical Analysis:
Today's Buy/Sell Levels:
0.6532
Support and Resistance Levels:
0.6584
0.6564
0.6552
0.6512
0.6499
0.6480
Trading Strategy:
If the price breaks above 0.6552, consider entering a buy position, with the first target price at 0.6564.
If the price breaks below 0.6532, consider entering a sell position, with the first target price at 0.6512


AUDUSD MULTI TIME FRAME ANALYSISHello traders , here is the full multi time frame analysis for this pair, let me know in the comment section below if you have any questions , the entry will be taken only if all rules of the strategies will be satisfied. wait for more price action to develop before taking any position. I suggest you keep this pair on your watchlist and see if the rules of your strategy are satisfied.
🧠💡 Share your unique analysis, thoughts, and ideas in the comments section below. I'm excited to hear your perspective on this pair .
💭🔍 Don't hesitate to comment if you have any questions or queries regarding this analysis.

AUD/USD Sell Setup – Liquidity Grab + Fractal Structure Shift 📉 Pair: AUD/USD
📆 Timeframes: Daily + 4H
🎯 Strategy: Smart Money Concept (SMC)
🔹 Bigger Picture (Daily Timeframe)
The daily trend for AUD/USD remains bearish, with consistent lower highs and lower lows.
Price action confirms that sellers still control the market, and buyers are only creating short-term pullbacks for liquidity grabs.
🔹 4H Timeframe Setup
On the 4-hour chart, AUD/USD has made a clear liquidity grab around the 0.65900 zone (yellow highlighted area).
After sweeping liquidity, the market shifted fractal structure to the downside, aligning perfectly with the overall daily bearish bias.
This creates a high-probability short setup.
🔹 Trade Plan
Sell Entry: 0.64825
Stop Loss: 0.65090
Risk/Reward: Attractive based on bearish continuation
30% Quantity sell in Market Rest sell on Retest
🔹 Why This Setup Works
Daily bearish structure → Trend aligned.
Liquidity grab on 4H → Smart money manipulation before reversal.
Fractal structure break → Market confirming downside shift.
Confluence with SMC concepts → Strong institutional pattern.
⚠️ Risk Factor
The only risk in this setup is that the market has already broken the fractal structure, leaving liquidity untested around 0.65870 (triple top).
If price retraces back to test this liquidity, short-term stop hunts may occur before the drop.
🔹 Final Outlook
All major SMC elements align for a bearish continuation on AUD/USD.
If price respects the fractal shift and liquidity grab, we could see a clean move to the downside from 0.64825, offering a solid risk-to-reward opportunity for swing and intraday traders.

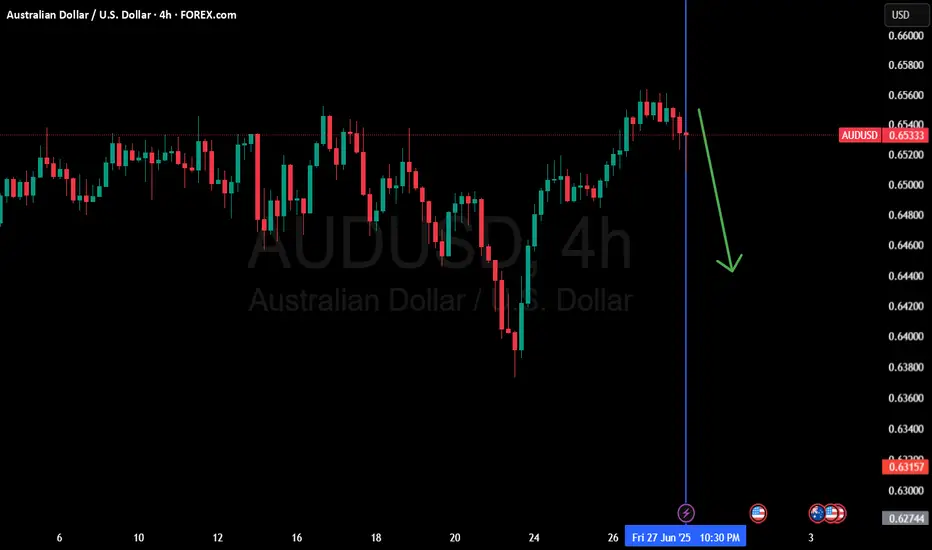
audusd short AUD/USD Chart Patterns: What to Know
1. Head and Shoulders (Reversal Pattern)
Seen clearly on the 4-hour chart illustration above.
A break below the neckline—notably around the 0.6600 level—could confirm a reversal, potentially moving the pair downward by approximately 150 pips .
Also identified in broader technical commentary, indicating weakening bull momentum in AUD/USD
2. Wedge Patterns (Continuation or Reversal)
On a 4-hour timeframe, AUD/USD appears to be forming an opening wedge—a narrowing trend that may precede a breakout.
If price breaks support, expect downward movement; a push higher on strong momentum may signal an upward breakout .

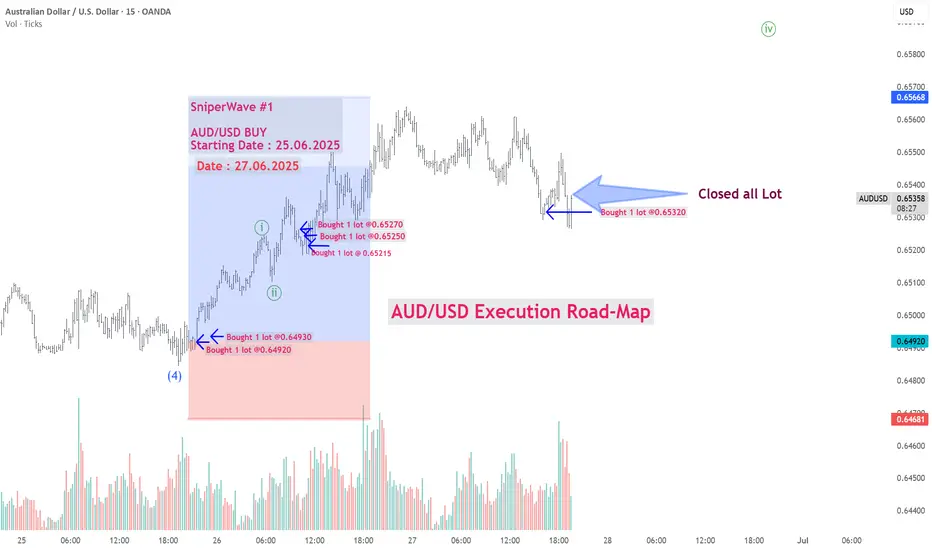
AUD/USD ROAD-MAP Sniper AUD/USD Entry Based on Wave Count 📉
Institutional Pattern | Liquidity Trap | Wave 3 Setup Confirmed ✅
Watch how price reacts at key levels. This is a high-probability sniper trade idea. Follow the sequence like a pro.
#Forex #AUDUSD #SniperTrading #WaveAnalysis #ElliottWave #ForexTrader #SmartMoney #LiquidityGrab #Wave3 #forexsetup #SniperWave #priceaction #forexshorts #AUDUSDsetup

AUD/USD Elliott Wave BreakdownPrice rejected beautifully near the end of Wave 2 — is Wave 3 underway?No indicators. Just pure Elliott Wave + Price Action sniper logic.
How to turns $200 to $10k Join my channel
#AUDUSD #ElliottWave #ForexTrading #WaveAnalysis #SniperEntry #PriceActionTrading #Wave3Loading #FxSniper #RamkiStyle #ChartAnalysis #ForexShorts #TradingMindset #SupplyZone #WaveCount #SniperWave

AUD.USD Strong signal up trendAfter a long period of sideways accumulation and price compression, AUD finally showed signs of breaking the downtrend line and starting to increase. Along with the weakening of USD, AUD has a bright chance for a strong price increase in time W+M

AUD USD Weekly Free Analysis (28-06-25 to 05-07-25)AUD USD
AUD/USD may begin to fall from the 0.6530 area as the US dollar strengthens in early July. The U.S. is expected to release strong economic data (like Non-Farm Payrolls on July 5), and the Federal Reserve is likely to stay hawkish, keeping interest rates high. This supports the dollar and puts pressure on AUD.
Meanwhile, Australia’s economic momentum is softening, with weaker consumer spending and mixed inflation trends. If the Reserve Bank of Australia becomes cautious or delays further hikes, it could weaken the Aussie dollar even more. Also, global risk-off mood or weak commodity demand (especially from China) could drag AUD lower.
Key Bearish Drivers:
Strong upcoming US data
Fed policy staying tight
Weakening Australian fundamentals
Global risk sentiment favors USD over AUD
SniperWave#1 – AUD/USD Summary📊 SniperWave#1 – AUD/USD Summary
✅ Total Investment: $1.48
📈 Total Qty: 0.06 lots
💰 Net Profit: $9.00
🛑 Risk (Initial SL): $0.96
⚖️ Risk : Reward = 1 : 9.3 🔥
One sniper setup, 6x returns. Pure Elliott Wave + Precision Execution.
Stay tuned for next wave 📡🚀
AUD/USDPrice action trading is a methodology in financial markets where traders make decisions based on the actual price movements of an asset over time, rather than relying heavily on technical indicators or fundamental analysis. It involves observing and interpreting patterns and trends in price charts to predict future price movements.
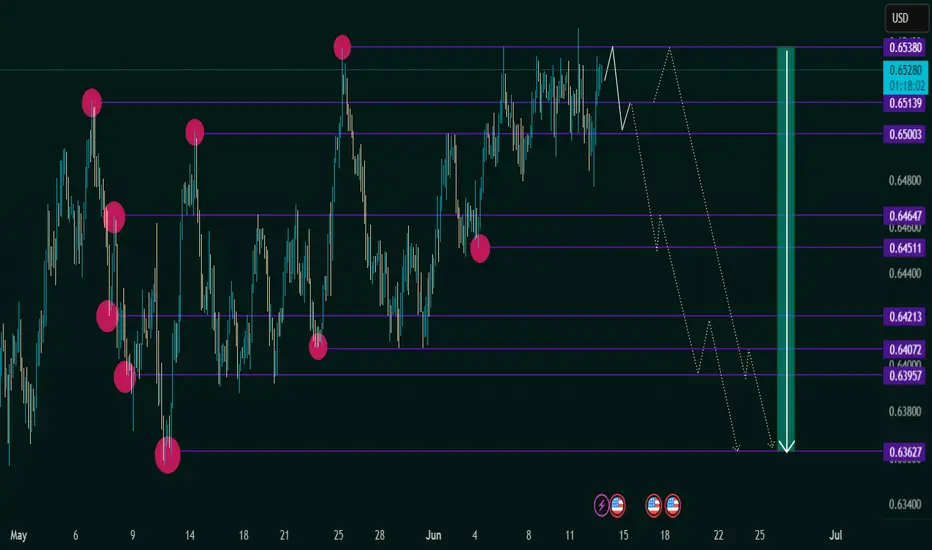
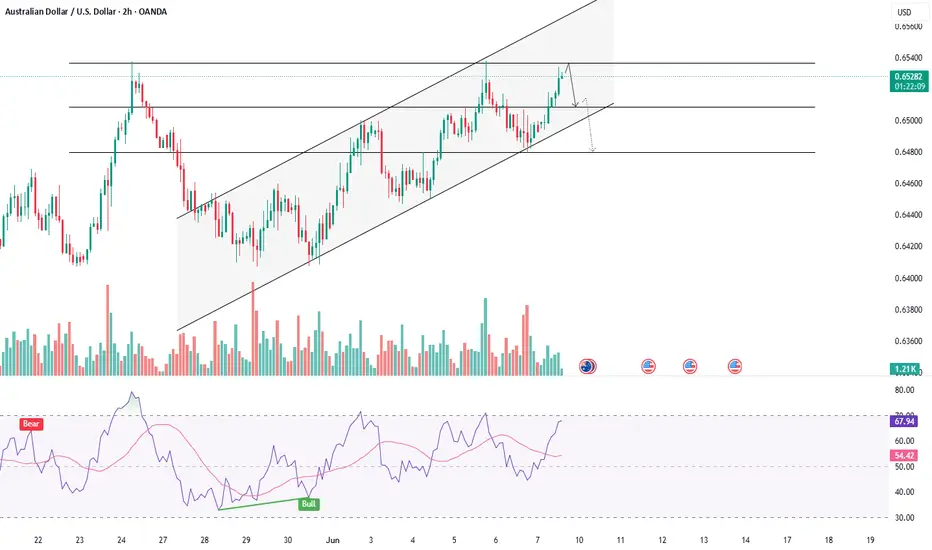
AUD/USD at Critical Resistance — Bearish Outlook Below 0.65381. Major Resistance Zone: 0.65380
Price is currently testing a strong horizontal resistance level at 0.65380, a level that has been tested multiple times (as shown by the pink circles).
This level has acted as a historical turning point, which increases its significance.
2. Price Structure: Lower Highs and Equal Highs
The chart reveals a potential double top or distribution pattern, forming under the 0.65380 resistance.
This suggests weakening bullish momentum and increases the probability of a bearish reversal.
3. Projected Bearish Path (White Dotted Lines):
If price fails to break above 0.65380 decisively, the expected move is a stepwise decline.
The projected path targets several support levels:
0.65003
0.64647
0.64213
0.63957
Final target: 0.63627, a key support from early May.
4. Support & Resistance Zones:
Resistance Levels:
0.65380 (Major)
0.65003
Support Levels (Sequential Targets):
0.64647
0.64213
0.63957
0.63627
5. Confluence with Fundamentals:
U.S. economic events (highlighted at the bottom with calendar icons) may act as volatility triggers, potentially accelerating this move.
✅ Summary & Trading Implications:
Bias: Bearish below 0.65380
Trade Idea: Watch for rejection at resistance or break below 0.65003 for confirmation.
Bearish Targets: Gradual move toward 0.63627 with key pauses at intermediate support levels.
Invalidation: Daily close above 0.65380 would negate the bearish setup and open potential for new highs.
AUDUSD - TESTING KEY RESISTANCESymbol - AUDUSD
CMP - 0.6530
AUDUSD continues to advance amid persistent uncertainty surrounding the US dollar, which remains in a consolidation phase. The currency pair is approaching a key resistance level at 0.6537
The dollar is currently range-bound due to prevailing market indecision. In contrast, the Australian dollar is gaining strength and appears poised to test a significant liquidity zone.
Within the context of the prevailing trend, the pair is progressing toward both resistance and the identified liquidity area. Given the considerable distance from the initial opening, the potential for continued upside may diminish as the pair nears its target. A false breakout above 0.6537 could signal the onset of a corrective pullback.
Resistance level: 0.6537
Support levels: 0.6509, 0.6480
A swift movement toward resistance without sustained bullish momentum could result in a false breakout at 0.6537 Should the price consolidate below this threshold, a corrective phase may follow before any potential resumption of the upward trend.

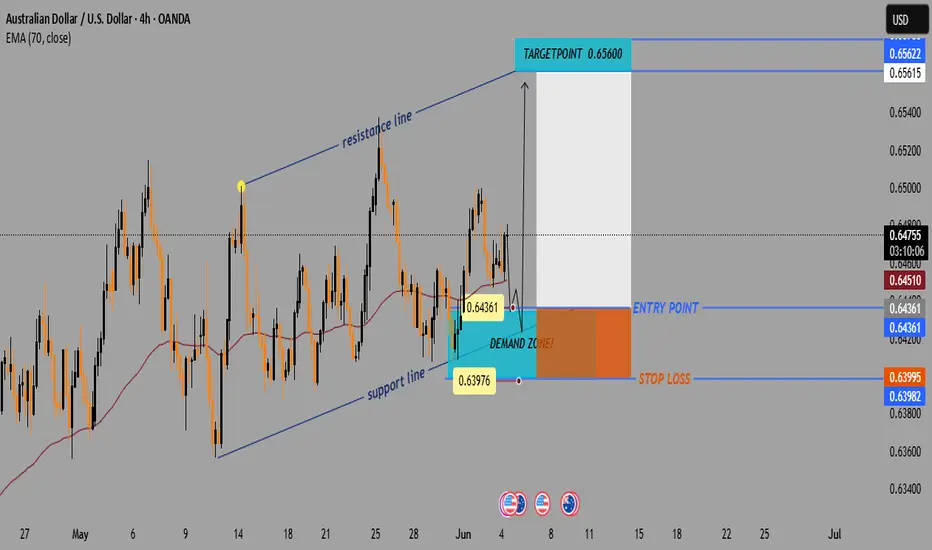
AUD/USD Bullish Setup: Demand Zone Bounce Toward 0.65600📈 Price Channel Analysis
🔼 The pair is moving within an ascending channel: • Support Line 🟦 – lower trendline showing bullish structure
* Resistance Line 🟥 – upper boundary acting as potential target
💡 This suggests bullish momentum is intact unless the price breaks below support.
📌 Key Trade Levels
🔵 Entry Point: 0.64361
* 👇 Positioned just above the DEMAND ZONE
* 📍Near the 70 EMA — a key dynamic support
🟨 Demand Zone: Area between 0.6400 – 0.6436
* 🧲 Buyers are expected here
* Good spot for a bullish entry
🔴 Stop Loss: 0.63995
* 🚨 Below the demand zone = limited risk
🟢 Target Point: 0.65600
* 🎯 Aligned with the upper resistance line
* Nice upside potential
⚙️ Technical Indicator
📉 EMA 70 (red line) = 0.64510
* Price is bouncing near it
* 📊 Acts as trend support — confirming buy idea
📊 Risk-to-Reward Ratio
🔻 Risk: ~36 pips (Entry → Stop Loss)
🔺 Reward: ~124 pips (Entry → Target)
✅ R:R Ratio ≈ 3.4:1 👍
🧠 Trade Idea Summary
📘 Trade Type 🔼 Buy (Long)
💰 Entry 0.64361
🛑 Stop Loss 0.63995
🎯 Target 0.65600
🌟 Bias Bullish
🔍 Final Thoughts
✅ Strong setup within a bullish channel
📉 EMA support + 🟦 Demand zone = Good confluence
📅 Watch out for USD news (see icons below chart)
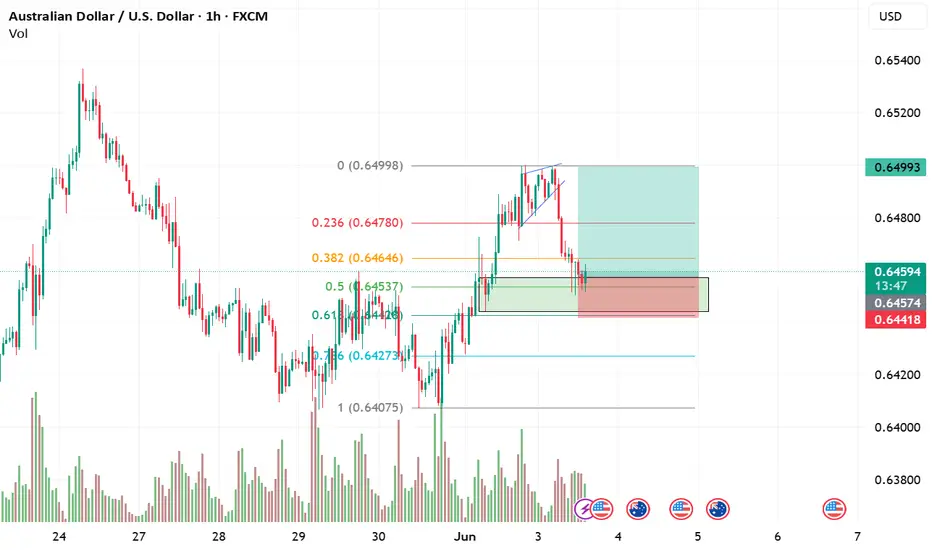
AUDUSD Long Idea : Fib and Demand zoneBullish Idea on AUDUSD at the demand zone which is occurring at Fib retracement of 0.5 and 0.618. On a good confirmation candle at this zone could be a possible good long trade.
AUD USD Weekly Free Analysis (25-05-25 to 31-05-25)AUD/USD Free Technical Outlook (26 May 2025):
Current Price Action:
Trading at 0.65198 (+0.22%) after bouncing from 0.65032 low
Shows mild bullish momentum in 4H timeframe
Key Levels:
Resistance: 0.65373 (today's high) → 0.65500 psychological
Support: 0.65000 (psychological) → 0.64600 (strong)
Short-Term Scenarios:
Bullish: Sustained break above 0.65373 could target 0.65500-0.65800
Bearish: Failure at 0.653 may retest 0.650 → break below opens 0.646
Trading Considerations:
Watch RBA rhetoric and China economic data (key AUD driver)
US dollar strength remains main counter-factor
Current 47:14 ratio suggests moderate buying pressure
(Free analysis - always confirm with fundamental triggers and volume data)

AUDUSD MULTI TIME FRAME ANALYSISHello traders , here is the full multi time frame analysis for this pair, let me know in the comment section below if you have any questions , the entry will be taken only if all rules of the strategies will be satisfied. wait for more price action to develop before taking any position. I suggest you keep this pair on your watchlist and see if the rules of your strategy are satisfied.
🧠💡 Share your unique analysis, thoughts, and ideas in the comments section below. I'm excited to hear your perspective on this pair .
💭🔍 Don't hesitate to comment if you have any questions or queries regarding this analysis.

ICTHello, I'm fxhunter. I updated the AUDUSD symbol that I previously analyzed. I hope you enjoy this analysis.
