USDCADStructure has shifted on USDCAD — price broke the previous high and formed a new Higher High (HH), confirming a bullish trend.
I’ll be watching to see if price pulls back into the 4H Supply Zone, potentially offering a rejection and a drop lower. From there, I’ll shift focus to the Demand Zone below, where I’ll be looking for long setups if price gives clear bullish confirmation.
Trade ideas

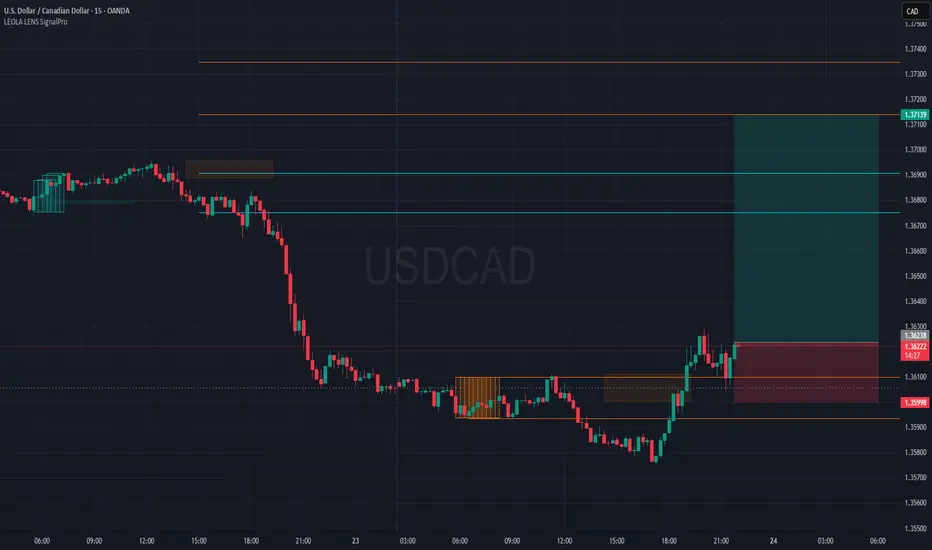
USDCAD Bullish Setup-Shift from Accumulation to ExpansionPrice has broken above recent accumulation range marked by Liquidity Control Boxes.
SignalPro long setup activated with:
🔶 Smart accumulation zone breakout
🔁 Minor retest at 1.361 area holding
🎯 Targeting upper liquidity levels around 1.37139
Price structure shows a bullish microtrend reversal with risk capped below last demand block.
Key Elements on Chart:
📦 Leola Lens SignalPro's control zones provided context for consolidation and breakout
📈 Breakout aims toward untested supply zones above
⏳ Timeframe: 15-min
🧠 Educational Use Only – No financial advice.
Tool used: Leola Lens SignalPro
USDCAD ShortPrice is currently in a downtrend on the daily timeframe. Price is retracing and retesting an 1 hour orderblock and a 30min orderblock. price is rejecting the orderblock and should continue to the downside. Take profit is at 1.35910 and stoploss is at 1.36410

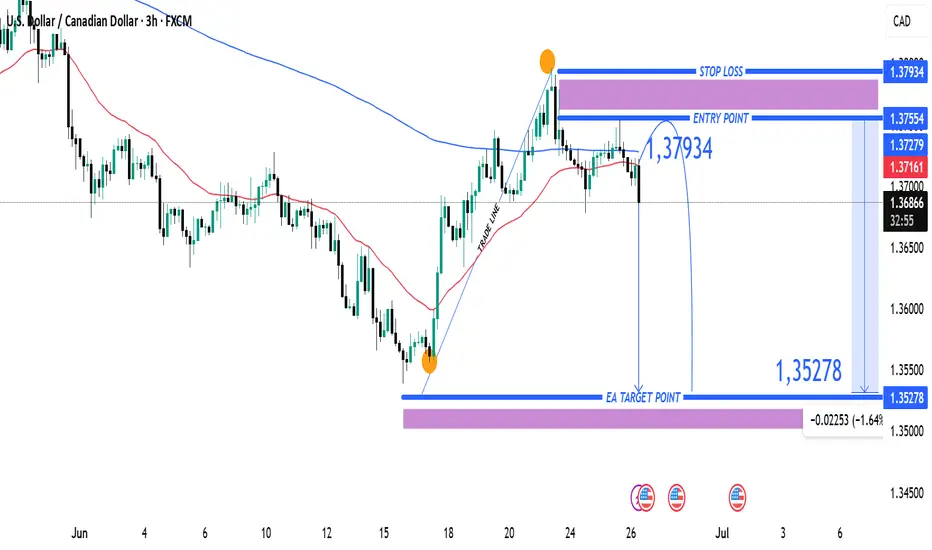
USDCAD Bearish Reversal Trade Setup – 3H Chart Analysis (June 26 Entry Zone: 1.37279 – 1.37554
🔹 Stop Loss: 1.37934
🔹 Target: 1.35278
🔹 Risk-to-Reward (RR): ~1:2.5
🧠 Technical Breakdown
Trend Overview:
Overall trend shows a downtrend from earlier June, followed by a corrective bullish move.
Price failed to sustain above the 200 EMA (blue line), indicating continued bearish pressure.
Trade Line Break:
A steep bullish trendline was broken, signaling a potential trend reversal or deeper pullback.
Bearish Rejection Zone:
The purple zone (1.37279 – 1.37554) acted as resistance.
Price formed a lower high and rejected this zone, confirming selling interest.
Entry Strategy:
Short entry is ideally within or just below the rejection zone.
Aggressive entry already in play at current market price (1.36909) after confirmation.
Target Zone:
Projected towards 1.35278, aligning with previous support and fib retracement zone.
Large purple support zone near the target suggests a potential reversal area.
⚠️ Risk Notes
Be cautious of USD volatility due to upcoming economic events (noted with icons on the chart).
Stop loss above previous swing high minimizes risk of fakeouts.
✅ Summary:
This is a bearish swing setup aiming for a significant drop toward 1.35278. The clean rejection from resistance and trendline break supports a high-probability short opportunity with favorable risk-reward.
USDCAD SELL
📉 Trade Plan (Bearish Bias – USDCAD)
🔍 HTF (High Time Frame – 4H / Daily):
Trend: Clearly bearish
Structure: Lower highs, lower lows
Current Price Action:
Price tapped into a key HTF POI (e.g., Supply Zone, OB, or FVG)
📊 1H Time Frame:
Price tapped into HTF POI
Shows weak bullish reaction or possible reversal signs
This is your watch zone to drop into LTF

USDCAD - IS A BULLISH TREND REVERSAL BREWING?Symbol - USDCAD
USDCAD is staging a recovery supported by the recent strength in the US dollar. A potential return to the prior demand zone could reinforce the bullish case for the pair and present an opportunity to establish long positions.
Amid the backdrop of dollar strength, the market appears to be transitioning into a new phase. The pair has ceased making lower lows and is now forming an EQL structure, from which it is attempting to break out of the prevailing downtrend. While the initial liquidity retest may lead to a brief correction, a swift rebound and sustained consolidation above this level would confirm the emergence of a bullish market structure.
Resistance levels: 1.3700, 1.3730
Support levels: 1.3660, 1.3648
Despite the recent breakout above descending resistance, selling pressure remains evident, with sellers likely to re-enter near the 1.3686 level. A clear breakout above this area, followed by a shift in market sentiment and consolidation above the 1.3675–1.3686 zone, would validate bullish intent and signal readiness for a broader recovery.

USDCAD (4H) Technical Analysis Long setupPair: USD/CAD
Timeframe: 4H
Bias: Bullish
Structure: Falling Wedge Breakout → Bullish Continuation
Current Price: ~1.3937
📐 Chart Breakdown
1. Falling Wedge Formation (Bullish Reversal Pattern)
Price was consolidating inside a falling wedge, typically a bullish reversal structure.
Breakout to the upside confirms buyer strength after a period of compression.
2. Breakout + Retest Setup
Clean breakout above the wedge has occurred.
Price is currently forming a small bullish flag (or consolidation), likely preparing for a retest of the breakout zone around 1.3856 before continuation.
3. Clean Bullish Imbalance Above
The large bullish candle created imbalance above, increasing the probability of a liquidity-driven move up.
4. Higher Timeframe Target Zones (Key Supply)
1st Target: 1.4150 (previous support turned resistance)
2nd Target: 1.4280 (major horizontal resistance)
Final Target: 1.4520 (multi-week supply zone)
🧾 Trade Plan – Long Setup
Entry Zone Stop Loss Take Profit Targets Risk:Reward
1.3860–1.3885 (retest of wedge) 1.3750 (below last swing low) 1.4150, 1.4280, 1.4520 1:3 to 1:5+
✅ Confluences Supporting the Long Bias
Confluence Details
✅ Falling Wedge Pattern Price broke out from bullish wedge.
✅ Retest Setup Pullback expected before continuation.
✅ Bullish Market Structure Higher highs forming post-breakout.
✅ Clean Liquidity Above Fewer obstacles on the way to major targets.
✅ Strong Demand Zone Below Buyers stepped in around 1.3750–1.3850.
🚫 Invalidation
If price breaks below 1.3750, bullish setup fails.
Close below wedge base may invite deeper bearish pressure.
📊 Trade Management Tips
Enter on bullish candle at retest zone.
Scale out profits at 1.4150, then 1.4280, let partials run to 1.4520.
Use trailing SL after price hits first TP for a risk-free runner.

USDCAD ANALYSIS Usd cad is bullish wait for retracement to buy. minor or major retracement needed atleast 50% for long position.

USDCAD - SUPPORT UNDER PRESSURE, WILL THE DOWNTREND CONTINUE?Symbol - USDCAD
CMP - 1.3803
USDCAD continues to test the support within its established trading range amidst a broader global downtrend. While the currency pair remains confined within this range, the pressure on the support persists. The market’s response to false breakouts appears to be weakening, and the price action continues to challenge the 1.3780 level, thereby increasing the likelihood of a further decline.
The US Dollar is showing signs of retreating from resistance and is beginning to decline, exerting a corresponding effect on USDCAD. Should the currency pair breach the 1.3780 level and establish a sustained close below it, this could signal the continuation of the prevailing trend following a consolidation phase.
Resistance Levels: 1.3810, 1.3830
Support Levels: 1.3780, 1.3740
The primary focus remains on the lower boundary of the trading range at 1.3780, The role of this range is to provide consolidation amidst a broader downtrend. Therefore, a decisive breakout below support would likely trigger the initiation of the distribution phase.

USDCAD - April EndAll time frames are downtrend.
But this is at strong support which made W - Close above support by rejecting it.
D- Strong bullish engulf candle to go up.
BOS happened.
Sideways is going on. let it break and go up. or wait for some magic candle at
4H or D candle.

USDCADHey trader, in today's trading session we are monitoring USDCAD for a selling opportunity around 1.3900 & 1.3840 TREND IS YOUR FRIEND.

Trade Recommendation – USDCAD Buy Position (30-Minute Chart)PAIR: USDCAD
TRADE TYPE: BUY
TIMEFRAME: 30-Minute (M30)
ANALYSIS TIME: 10:35 AM, April 25, 2025 (UTC+7)
STRATEGY: Trend-following + EMA33 (High/Low) + Pullback Signal
✅ Trade Setup:
Entry: BUY around 1.3865
Stop Loss (SL): 1.3838
Take Profit (TP): 1.3957
Risk-Reward Ratio: 1:3.2 (high reward-to-risk setup)
🔍 Technical Analysis:
Short-term trend: Price is in a mild uptrend, forming higher lows.
EMA 33 (High/Low): Price is hovering near EMA33, showing a potential pullback bounce.
Price Structure: After a short-term correction, USDCAD is consolidating and showing signs of a potential breakout above recent highs.
Volume: Increased buying volume during bullish moves indicates strong buying interest.
📌 Trade Management Tips:
Hold the position if price breaks above 1.3885 with strong volume.
Consider trailing stop or move SL to breakeven once price hits 1.3900.
This setup is suitable for short-term swing trading within M30–H1 timeframe.

USDCAD MULTI TIME FRAME ANALYSISHello traders , here is the full multi time frame analysis for this pair, let me know in the comment section below if you have any questions , the entry will be taken only if all rules of the strategies will be satisfied. wait for more price action to develop before taking any position. I suggest you keep this pair on your watchlist and see if the rules of your strategy are satisfied.
🧠💡 Share your unique analysis, thoughts, and ideas in the comments section below. I'm excited to hear your perspective on this pair .
💭🔍 Don't hesitate to comment if you have any questions or queries regarding this analysis.

USD CAD April Week 3All timeframes are downtrend.
But its at strong support and making double bottom(Weekly pullback).
So if market can not break this support and if we see bullish pressure,
we can expect good uptrend this week.
Do not sell unless it breaks this support level.
If it breaks, it should sustain below this support.
RSI - D and W are in over sold area. this kind of situation, we can expect to
go up mostly.
But market never fails to surprise us. So be care full.

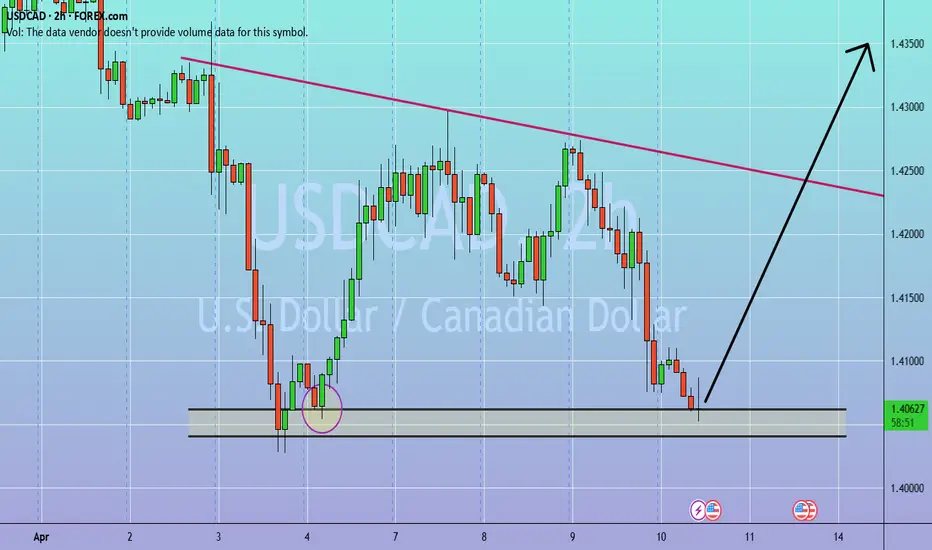
USD/CAD 1H Supply Zone Reversal Setup – Bearish Trade Plan🔵 Supply Zone (Resistance)
📍 1.39457 – 1.40000
Price is expected to face selling pressure here. This is a potential reversal area.
🔽 Entry Point: 1.39457
👀 Waiting for price to enter the supply zone before a possible drop.
❌ Stop Loss: 1.40000
🔺 Just above the supply zone – if price breaks this level, the bearish setup is invalid.
🎯 Target: 1.37500
✅ This is the expected take-profit level if price reverses from the supply zone.
Plan Summary
📈 Wait for price to enter the blue supply zone
🛑 Place stop loss at 1.40000
✅ Target at 1.37500
🔄 Risk-to-reward ratio is favorable (~1:2.5)
Chart Structure
🔻 Trend: Bearish
📉 Price is below the 7 EMA (1.39227), confirming downward momentum.

Bullish in USDCADUSDCAD is nearing at double bottom. I taking a small risk of buying here as SL will be very small as comparing to profit. In prev. case, it tested same zone before bouncing up so i feel buyers will have upper hand, this time too. Let's see, fingers crossed !
usdcad sell planusdcad sell plan with wave analysis,
market broken recent low and back to test upper liquidity level
we can plan sell after taking liquidity

Sell Trade - USD/CADGreetings to everyone!
Place a sell trade on USD/CAD and check out my chart for the ideal entry & stop-loss placement.
Remember :-
* Move your SL to breakeven once the trade reaches 1:1.4 R.
* Aim for a minimum reward of 1:1.5 R.
* Don't risk more than 3% of your total margin.
Let's execute this trade smartly! 🚀

USDCAD BULLISHBuy side liqstacking above as equal highs
Asian highs as well
Sell side liq has been captured ,
Dxy is also bullish so buying on usd cad
Tp is marked by red line

USDCAD MULTI TIME FRAME ANALYSISHello traders , here is the full multi time frame analysis for this pair, let me know in the comment section below if you have any questions , the entry will be taken only if all rules of the strategies will be satisfied. wait for more price action to develop before taking any position. I suggest you keep this pair on your watchlist and see if the rules of your strategy are satisfied.
🧠💡 Share your unique analysis, thoughts, and ideas in the comments section below. I'm excited to hear your perspective on this pair .
💭🔍 Don't hesitate to comment if you have any questions or queries regarding this analysis.

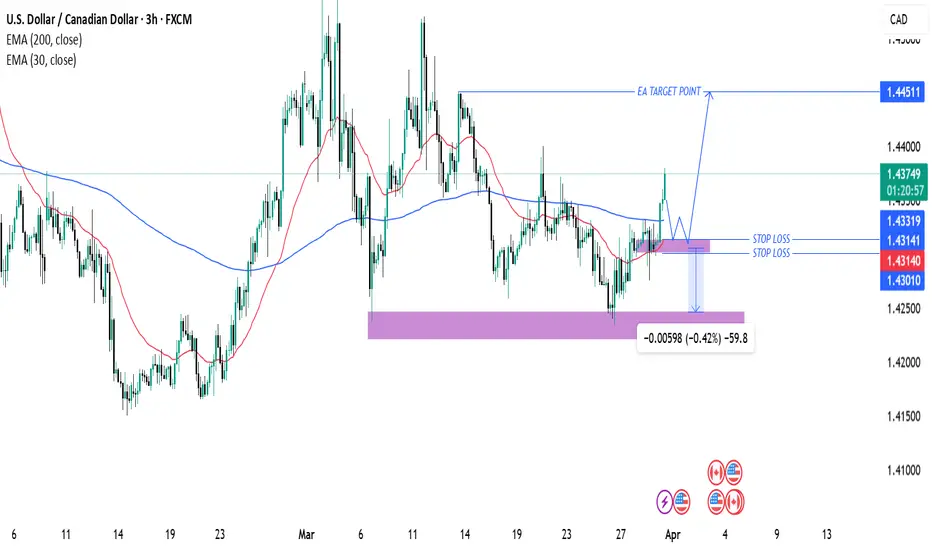
USD/CAD Bullish Trade Setup: Key Support, Entry, and Target AnalThis chart is a technical analysis of the USD/CAD currency pair on a 3-hour timeframe. Here’s a breakdown of the key elements:
Key Observations:
1. Exponential Moving Averages (EMAs):
200 EMA (Blue Line) at 1.43318 – A long-term trend indicator.
30 EMA (Red Line) at 1.43135 – A short-term trend indicator.
The price is currently trading above both EMAs, suggesting a bullish bias.
2. Support and Resistance Levels:
A support zone (purple box) around 1.43010 to 1.43141 has been identified, which the price is expected to respect.
The target level (EA TARGET POINT) is set at 1.44511, indicating a bullish price movement expectation.
3. Entry, Stop Loss & Take Profit:
Entry Point: Near the 1.43318 level (current price area).
Stop Loss: Placed below the supp
USD/CAD Bullish Breakout: Trade Hits Target Successfully200 EMA (Blue) at 1.43070: Represents long-term trend resistance.
30 EMA (Red) at 1.42660: Represents short-term trend direction.
Price has strongly surged above the 30 EMA, indicating bullish momentum.
Support and Resistance Levels:
Support Zone (Red area at the bottom): Marked near 1.42150, where the price reversed.
Target Resistance (Blue at the top) at 1.43672: Marking the expected profit zone.
Trade Setup:
Entry Point: Near the support zone at 1.42451-1.42660.
Stop Loss: Placed below 1.42150, to minimize risk.
Target Point: 1.43672, aligning with a previous resistance level.
Price Movement: A strong bullish breakout occurred, moving rapidly toward the target.
Trade Analysis:
✅ Successful Long Trade: Price moved sharply upward after consolidating at support.
📈 Momentum Confirmation: The strong bullish candles indicate aggressive buying.
🎯 Target Achieved: The trade reached the projected 1.43672 level, generating a solid risk-to-reward outcome.
Potential Future Outlook:
If the price sustains above 1.43672, further upside could be seen toward 1.44000.
If it faces resistance, a pullback toward 1.43070 (200 EMA) may occur before another move.
